


Table of Contents
It’s Time to Break the ABM Bottleneck
Introduction
In 1975, Kodak built the world’s first digital camera. But their current revenue depended on film sales. Rather than threaten that model, they shelved the innovation — and missed the future.
Most B2B marketing teams find themselves in a similar position today.
For over a decade, we’ve optimized marketing for efficiency and volume of MQLs produced — tracking MQLs, lead scores, and conversion rates like gospel. We built lead factories and still measure them using assembly-line KPIs. We think of this as the industrialization of B2B marketing.
Data from our buyer experience research clearly show that buyers have opted out of this industrialized approach. They are reluctant to complete our forms, remain anonymous as long as possible, and rarely respond when our BDRs attempt to to reach them. The industrialize, MQL factory approach to B2B has alienated the very buyers we are trying to attract and engage.
We know from the research that buyers have opted out of being funnel fodder. Instead, they build short lists and vet options on their own and only engage with vendors who’ve earned it.
We also know that a person who fills out a form isn’t necessarily in-market — or that you’re being considered. Conversely, buying groups that have not become leads for you may very well be evaluating you against your competitors.
Marketing’s job isn’t to hand off dead-end leads. It is to earn early inclusion in short lists and build preference with buying groups — well before Sales gets involved.
So, this report asks a simple question:
Have our metrics evolved to match this reality?
To find out, we surveyed over 600 B2B marketers across industries, company sizes, and go-to-market strategies. We examined ABM and demand gen teams, attribution models, compensation plans, and board-level reporting.
Three years of data tell a consistent story:
Marketing strategy may be evolving, but measurement remains stuck in the past.
Across nearly every finding, the same pattern emerges: modern approaches like ABM are being layered on top of lead-centric infrastructure. Teams say they’ve moved on from MQLs, but MQLs still drive reporting, compensation, and perceived performance.
If marketing wants to claim strategic relevance, it has to measure like it. That means moving beyond sourced/influenced labels, dropping vanity metrics, and aligning KPIs to how buying actually works.
Otherwise, like Kodak, we risk perfecting the wrong model—until it is too late to pivot.
Summary of Findings
ABM is widespread but still maturing.
Nearly 80% of organizations report having an ABM program, but most describe theirs as only somewhat developed.
Measurement still centers on traditional KPIs.
MQLs remain the dominant metric in both ABM and demand gen efforts, while revenue-focused outcomes — like closed-won deals or influenced pipeline – are tracked far less consistently.
Attribution is common but often incomplete and wildly in accurate.
Multi-touch models dominate but rely on narrow, visible interactions. More diagnostic methods – like statistical modeling – are underused, leaving blind spots in evaluating true impact.
Funnel models vary by strategy.
Organizations with ABM are more likely to incorporate pre-sales engagement and use opportunity- or account-based models. In contrast, legacy teams often rely on lead-based or sales-owned frameworks.
Tracking Performance: What Marketing Teams Measure, Report, and Incentivize
ABM Adoption Is Widespread — but Possibly Overstated
B2B marketing has changed. Or so the strategy decks say.
A decade ago, SiriusDecisions found that 20% of B2B organizations had an ABM program in place. Today, that number has grown to 80%. On the surface, that seems to signal a near-universal move away from leads and toward buying groups and accounts. But widespread adoption doesn’t guarantee depth or consistency in execution.
While there are undoubtedly organizations that have built mature and successful ABM programs, much of the data in this report suggests that many ABMers are still being measured against traditional lead-based KPIs. In other words, simply having an ABM program does not indicate that a marketing organization has matured to address how buying really works. A substantial share of teams are either in transition or have stalled in their efforts.
(Just) Talking the Talk
We have also discovered that there is also a smaller segment of marketers whose responses reflect more aspiration than reality— socially desirable responders. These individuals, prone to a well-documented survey bias, tend to answer in ways they believe will be viewed favorably. In this case, that meant being more likely to say they have an ABM program, and far more likely to report strong financial performance. In other words, the 80% ABM adoption rate we found is padded by a small but meaningful group of “Inflators” whose answers likely reflect intent or ambition more than actual practice.

Even Those With the Smallest Deal Sizes Report Relatively High ABM Adoption
| Cost of Product Offering (annualized value) | Orgs With ABM Program | Sample Size |
|---|---|---|
| $10,000 to $100,000 | 63% | 263 |
| $100,001 to $250,000 | 89% | 170 |
| $250,001 to $500,000 | 93% | 113 |
| $500,001 to $750,000 | 92% | 85 |
| $750,000 to $1,000,000 | 87% | 63 |
To get a better read on how teams perceive their own maturity, we drew on findings from a separate study conducted with Sloane Staffing, where nearly 200 B2B practitioners in ABM or ABX roles were asked to assess the state of their programs:
- 51% described their ABM program as “somewhat developed”
- 27% were just getting started
- 15% said they had a well-established ABM program
- Just 4% said their program was fully scaled across the organization.
Budget allocation offers yet another indicator of maturity. Those just getting started or “somewhat developed” devote an average of 26% of their marketing budgets to ABM. That rises to 34% among “well-established” programs and jumps to 66% among the small group that describe themselves as fully scaled.
While that final group is small and should be interpreted with caution, the broader pattern suggests that mature programs require a greater resource commitment.
It is clear that most organizations are not yet willing to make that commitment.
Together, these gaps — in self-assessment, budget allocation, and continued reliance on lead-based KPIs — suggest that ABM, while widely adopted in name, is not as deeply embedded in practice.
The sections that follow examine where momentum toward modern marketing runs headfirst into systems still designed to measure MQL factories.

Legacy Metrics Are Holding ABM Back
Early ABM simply rerouted the MQL machinery toward target accounts.
Nearly half of ABM adopters still measure success by MQLs, even from non-target accounts. That is not strategic alignment; it is legacy habit. True post-industrial ABM should prioritize progress through the buying journey and business outcomes—not arbitrary qualification thresholds. Yet only a third track pipeline from target accounts, and even fewer measure revenue impact.
Until we shed MQL-era thinking and retool around intent and influence, we’re just putting new labels on decrepit machines.
Most Tracked
- Marketing Qualified Accounts from ABM/Target Accounts – 49%
- Marketing Qualified Leads from non-target accounts – 44%
Middle of the Pack
- Opportunities from ABM/Target Accounts – 35%
- Pipeline from ABM/Target Accounts – 33%
- Closed-won deals from ABM/Target Accounts – 22% or fewer
Bottom of the List
- Non-MQL Leads from non-target accounts – 13%
- Non-MQL Leads from target accounts – 11%.

What Gets Reported Up: Progress Measured in the Wrong Currency
If you want to know what a company values, look at what gets reported to up the management chain.
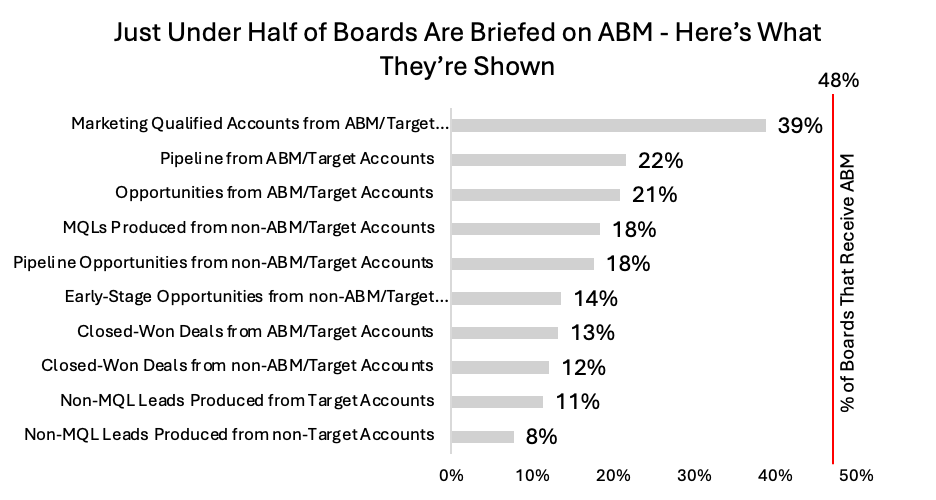
In B2B marketing, there’s finally some movement: more than a third (39%) of ABM programs report MQAs to the board. That is notable. MQAs are, at least in theory, more aligned with account-based strategies than MQLs ever were.
So that is good news.
The bad news?
- Opportunities from target accounts: reported by just 21%
- Pipeline from target accounts: 22%
- Closed-won revenue: a mere 13%.
Marketing is not reporting outcome metrics. But, we can be certain that sales is. In other words, outcome metrics—pipeline and revenue—remain the domain of sales. As long as these outcome metrics remain “sales-only” territory, marketing remains the junior partner in revenue production.

Company Size and What Gets Reported Up
In small companies, board members tend to see everything—often the same reports as senior leadership.
But as company size grows, reporting narrows:
- Senior leaders see less detail
- Boards often get a single number from marketing – usually MQAs.
The larger and more complex the company, the thinner the marketing story that is told at the top. This is to be expected when organizations are operating established processes. However, as we have seen, most organizations are still in transition – in limbo between the old industrial, lead-focused way of working and the more modern account- and buying-group centric models.
Compensation: Strategy Modernized, Rewards Stuck in the Past
How ABMers Are Paid:
- 40% say MQAs are tied to the variable compensation
- 28% say none of their ABM metrics influence compensation
- 65% tie just 1–3 metrics to pay—mostly MQAs (40%) or MQLs (31%)
- Only 7% tie 4+ metrics to incentives
That 40% of marketers have MQAs tied to the variable compensation is a great step forward. However, there is a substantial drop-off when it comes to opportunities and pipeline – more revenue-adjacent metrics.

Attribution
Attribution Practices: Broad Adoption – but Shaky Foundations
Everyone does attribution. Almost no one does it well.
That is the headline from three years of data. Despite near-universal adoption of attribution models—92% of ABM teams and 68% of legacy teams say they use one—the foundation underneath is still shaky. The models in use may be more complex than in the past, but complexity isn’t the same as insight.
What We Mean by Attribution
Marketers generally track two kinds:
- Sourced attribution: “This deal started because of us.”
- Influenced attribution: “We touched that deal at some point.”
Both rely on an optimistic assumption: that we can identify a meaningful starting point or moment of influence in buying journeys that are anonymous, messy, and fragmented.
The Mirage of Multi-Touch
The most popular model is multi-touch attribution, which is used by:
- 58% of ABM organizations
- 60% of non-ABM organizations
That may sound like progress. Adoption is up substantially from several years ago. It is not, however, progress.
Multi-touch usually means crediting three or four visible interactions. That is still a rounding error on the actual number of interactions buying groups have with vendors. A typical buying group of 11 people generate 150–200 digital touchpoints per vendor. Multi-touch isn’t measuring influence. It is cherry-picking.
| Attribution Model | % Using It (ABM) | % Using It (Non-ABM) | What It Actually Does | Reality Check |
|---|---|---|---|---|
| Multi-Touch | 58% | 60% | Credits a handful of visible touchpoints | Candy for dashboards |
| First Touch | 22% | 38% | Credits the first detectable interaction | Rearview logic |
| Last Touch | 31% | 19% | Credits the last thing before sales | The “race finish” fallacy |
| Statistical Modeling | 20% | 18% | Analyzes all activity patterns to estimate real impact | Actual measurement |
The Least-Used Model Is the Only One That Works
Just 20% of ABM programs and 18% of legacy teams use statistical attribution — the only model that can account for the full pattern of interactions over time. That is because it is harder to implement and harder to explain. But it is the only approach grounded in actual impact.
Until statistical attribution becomes the default, attribution will remain what it is today: a story we tell ourselves to justify the intuition- and preference-based decision-making.
Sourced vs. Influenced: Attribution’s Mirror Images
If sourcing is about origin stories for deals, influence is about plot twists. And, both are flawed—but in different ways.
- Sourced Revenue: Marketing claims credit because a deal started with a marketing activity.
- Influenced Revenue: Marketing claims credit because a tactic touched a deal at some point.
Neither model can reliably track what caused a buying group to act—only that marketing was visible somewhere along the way. The logic assumes cause where there’s often only coincidence.
We know from research on how buyers buy that most buyers enter a journey with prior experience with brands. And we know that only 3 in 10 buying group members of a buying group that will buy from you will fill in a form. Most of those evaluating you will stay anonymous. There’s no evidence that the person or the moment who first fills out a form is special or decisive in any way.
The origin of the opportunity – why you got on the list at all – is almost certainly not the first time you saw a form fill.
So Why Use It?
When deals are transactional in nature (<30 day buying cycle), deal sourcing can be a more reasonable approximation of what matters. Otherwise, ‘sourced’ metrics are closer to disinformation than information.
Still, our data show that:
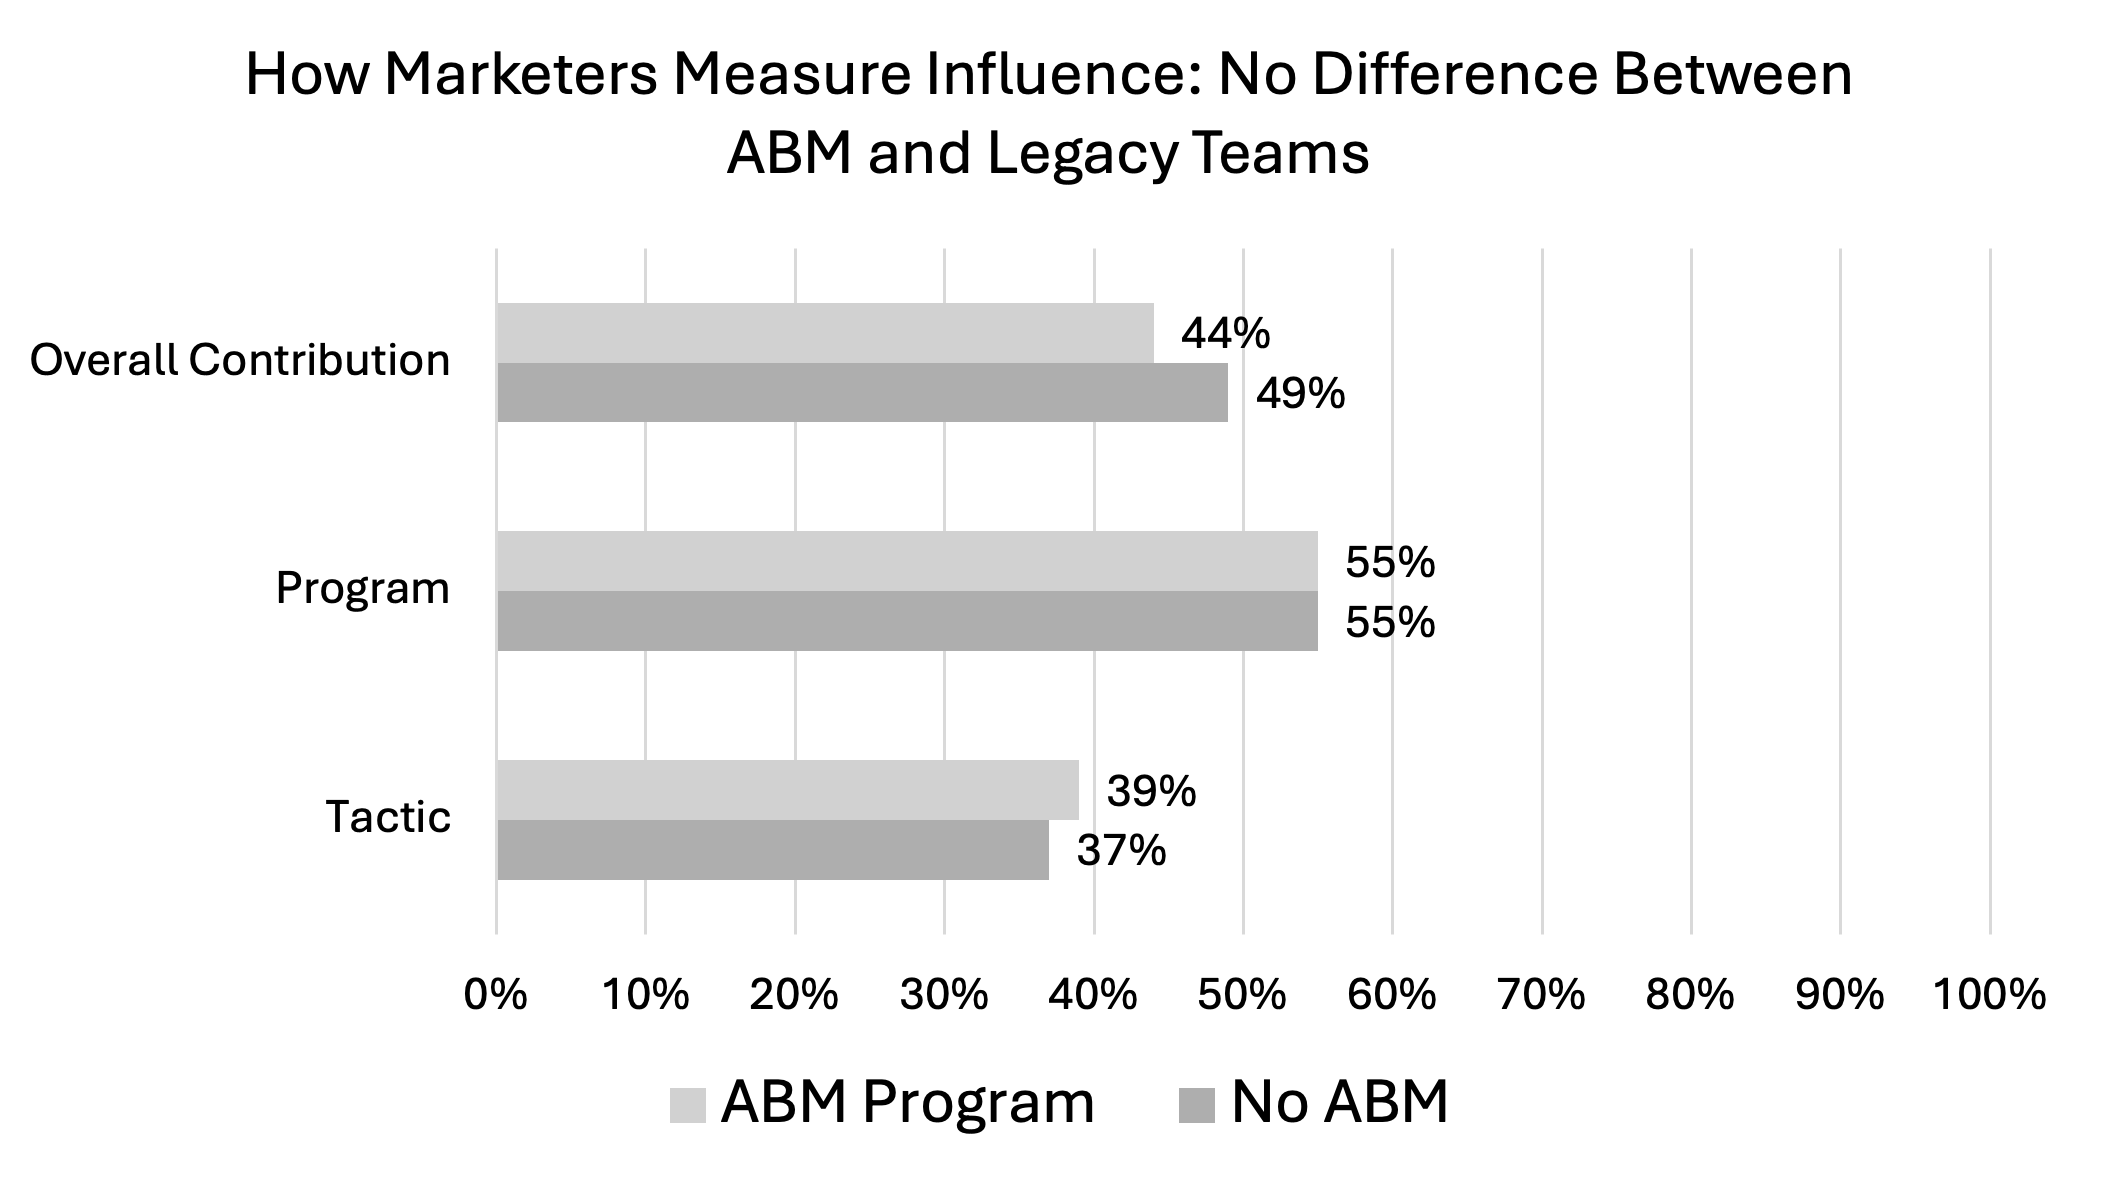
- 55% of marketers measure influence at the program level (e.g., all efforts aimed at new logo acquisition).
- 37–39% measure it at the tactic level (e.g., this email campaign influenced 12 deals).
- 44–49% evaluate influence in aggregate (e.g., total marketing contribution to pipeline).
That sounds comprehensive, but these percentages are nearly identical between ABM and non-ABM teams. ABM hasn’t changed influence measurement — it is just rebranded the same habits.
Influence Metrics Are a Vibe, Not a Verdict
Most influence measures are not much better. Theoretically, all measures should be influence, rather than sourced measures, for reasons stated above. Asking, “What actions tended to increase the likelihood of buyers choosing us?” is a very good question to ask. The data exist to answer the question.

However, as practiced in the real world still, they typically account for a small fraction of marketing touches, and they are not calculating how actions increased or decreased conversion, but instead are apportioning revenue or pipeline amounts simply based on a tactic having been ‘touched’ by a buying group. In most cases, this will be a record of what the marketing organization just happened to be doing at the time a buyer was engaging, not a record of what actually works or does not to increase buyer preference.

Marketing is involved in most opportunities. But saying a tactic touched a deal doesn’t mean it influenced it meaningfully. Until we distinguish between proximity and causality, influence reporting will remain an exercise in confirmation bias.
Marketing ROI
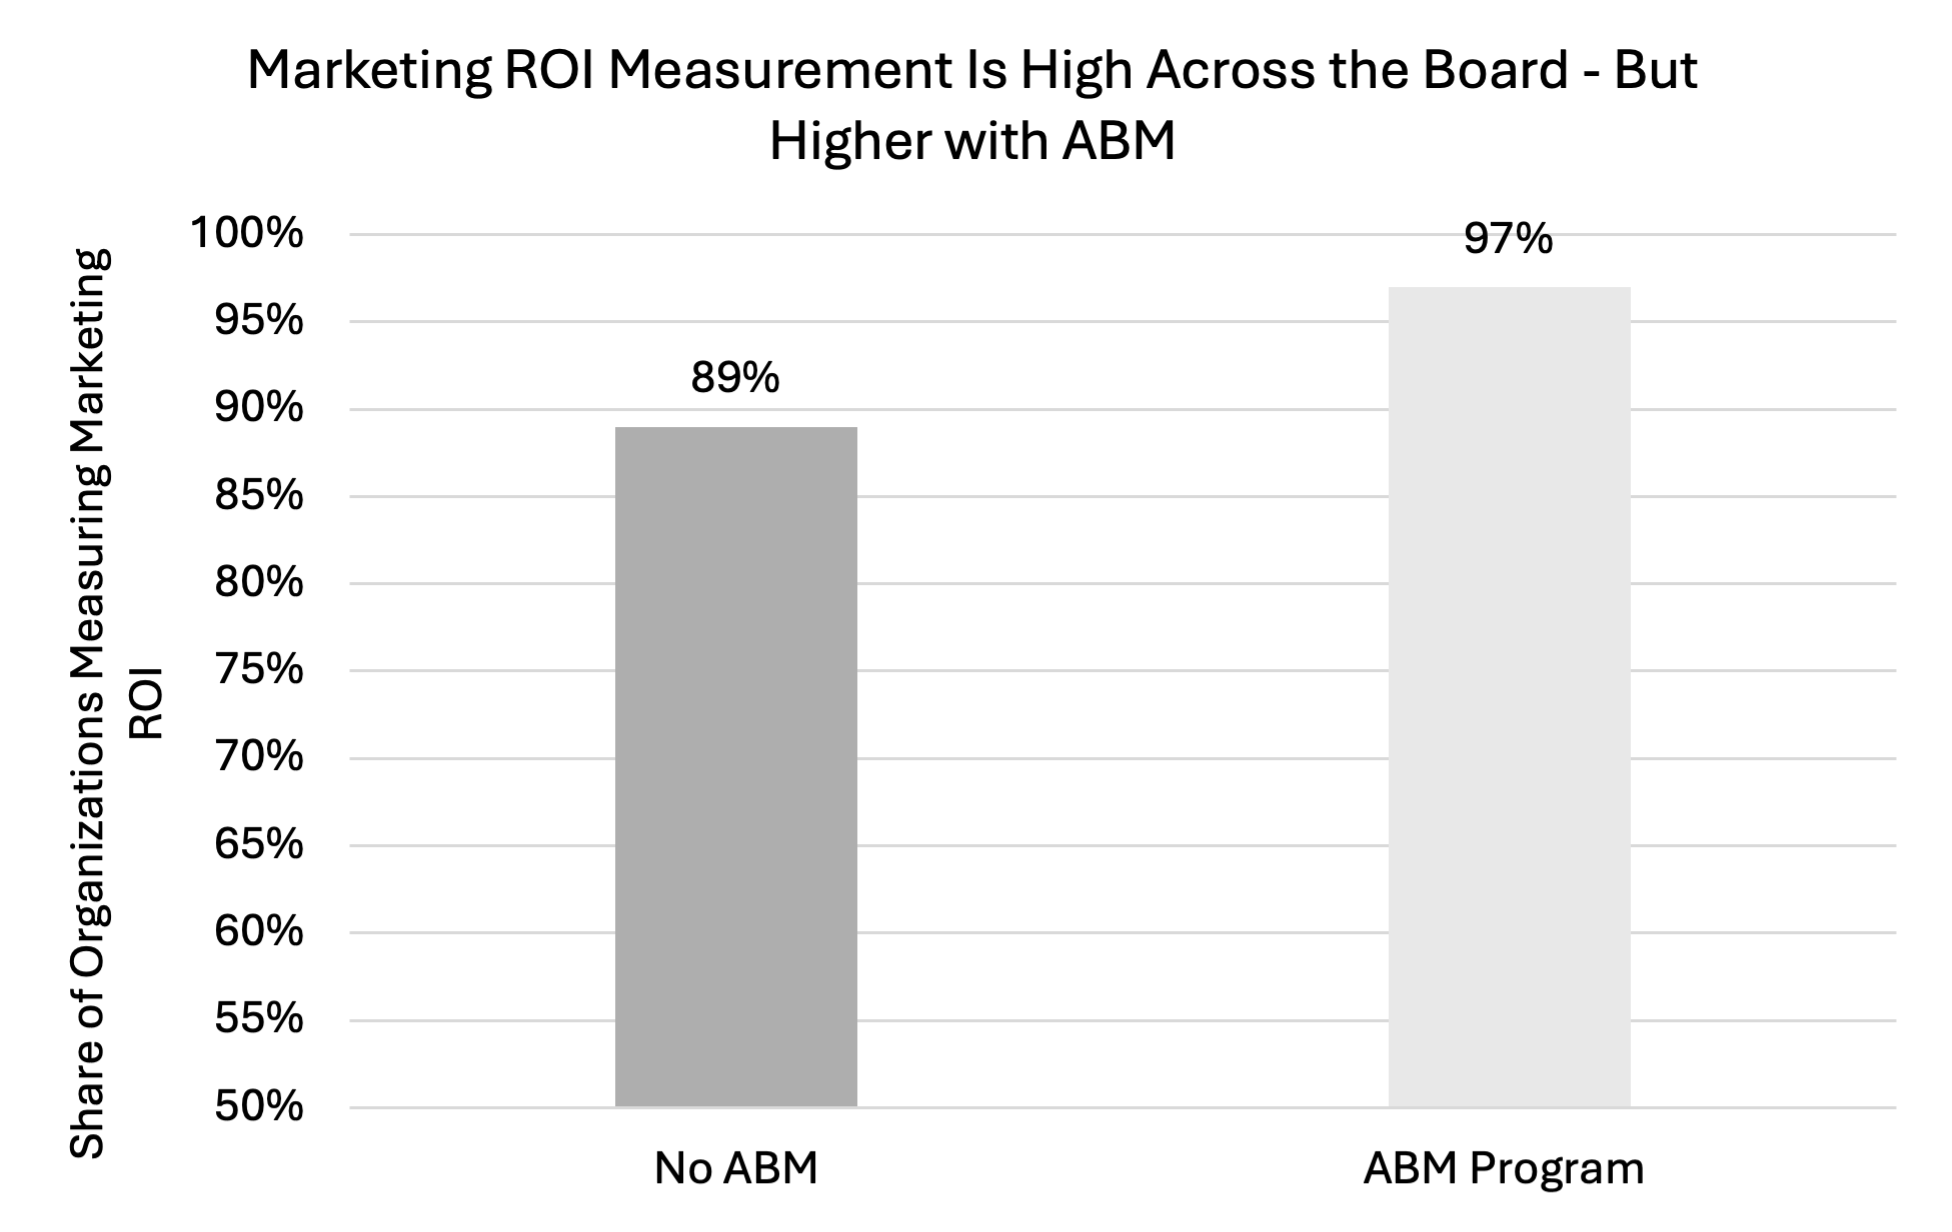
Measuring marketing ROI is a near-universal practice — especially among ABM teams. Ninety-seven percent of organizations running ABM programs report that they measure marketing return on investment, compared to 89% of legacy teams. Given ABM’s focus on high-value accounts and often larger investments per deal, the pressure to prove impact may be driving more consistent ROI tracking.
Sixty-three percent of respondents — ABM and legacy alike — report measuring marketing ROI based on overall contribution, rather than isolating the impact of specific programs or tactics. Program-level evaluation is slightly less common (46% for ABM teams, 39% for legacy). Fortunately, fewer teams assess ROI at the tactic level. Tactic-level ROI measurements undervalue tactics aimed at early-journey buyers and so tend mislead rather than inform.
These patterns suggest that most organizations prioritize a holistic view of marketing’s impact — one that may be more practical or accessible with their current tools and data structures.

Mapping Relationship Journeys: Funnel and Waterfall Models
Waterfall models offer a structured way to map the relationship between buyers and sellers over time. They help organizations track how accounts move through defined stages of engagement and opportunity creation. Some models begin with initial sales interactions, while others take a broader view — starting from the moment an account is identified or targeted, well before direct engagement from sales. In either case, the goal is to bring consistency and visibility to the stages leading up to, and including, opportunity development.
- This year, 93% of marketers with ABM report using a model that tracks engagement before sales involvement, compared to just 57% of those without ABM.
- Opportunity-based models are the most common among ABM teams (53%) but used by only 23% of legacy teams.
- Account-based models follow a similar pattern: 44% of ABM teams use them versus just 16% of legacy teams.
- Lead-based models are still used by many ABM teams (37%)—a sign that legacy practices remain embedded even in modern programs.
- Sales-owned frameworks are used by about one-fifth of both groups (24% ABM, 20% legacy), showing limited difference.

The fact that opportunity-based models are now the most common among organizations with ABM programs is perhaps the clearest sign of progress we encountered. Opportunities are the fundamental unit of measure in B2B, and waterfall or funnel models that are built to track progress against opportunities are the most reality-aligned methods for gauging success.
How Marketers See Their Own Measurement Systems
Throughout this report, we’ve noted signs of progress — but also plenty of reminders that measurement practices still operate in the shadow of legacy models, and compensation structures do little to reinforce the behaviors modern marketing demands. Given these gaps, we asked participants to tell us whether they thought their measurement practices were a fair measure of marketing’s contribution.
The average response fell between “neutral” and “somewhat fair.” That middling sentiment serves as a fitting reflection of the broader patterns we’ve seen throughout this report.
Surprisingly, there were no differences in how marketers felt about their measurement systems based on the programs they run — ABM or not. One might expect those leaning into more modern, account-based approaches to feel especially misaligned. Instead, there appears to be a universal, mild sense of disconnect.
Implications
For most B2B purchases, the buyer is — and has always been — a group of individuals working together to solve a business problem. Marketing’s shift toward account-based approaches and buying group recognition increasingly reflects that reality — 8 in 10 organizations say they have an ABM program in place.
But, as discussed above, modern approaches have been broadly adopted, but more often that not remain niche practices within B2B organizations.
We contend that a substantial reason more modern practices have not come to occupy more central role in B2B is that legacy measurement practices that remain prevalent do not capture the value modern strategies provide.
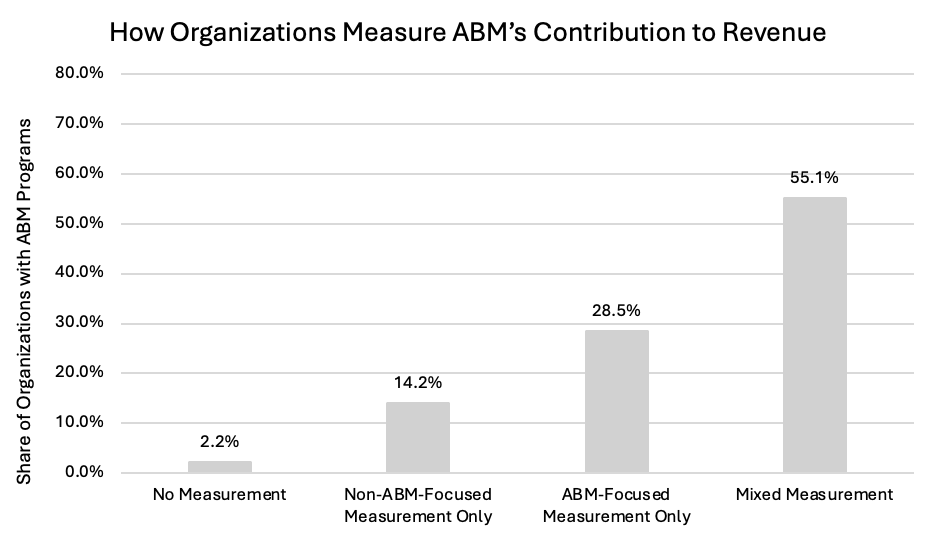
As we have seen, only 29% of ABM teams are measured solely through ABM-aligned metrics. The rest continue to rely on a combination of ABM and legacy measures, legacy measures alone — or, in some cases, no measurement at all.
The industrial, lead-factory model continues to shape reporting, incentives, and strategy. MQLs still dominate dashboards. Attribution frameworks — sourced, influenced, first-touch, last-touch — persist, despite their untenable foundations.
This misalignment is especially problematic given that most buyers (84%) have already selected their preferred vendor before contacting sellers which happens over two-thirds of the way through their buying journey. By the time sales gets involved, the shortlist has often been formed—and if marketing hasn’t influenced the buying group early in the journey, it’s likely too late. Yet the metrics used to assess performance remain anchored to the handoff: MQAs and MQLs.
If marketing’s influence during the earlier — and more decisive — stages is left out of the reporting picture, leadership will assume it isn’t there.
This gap between how B2B buying happens and how marketing is measured is precisely why we introduced the Three Principles of Modern Marketing in last year’s report. They remain just as relevant — and just as necessary — today.
- Principle 1: Marketing and sales must focus efforts against a mutually agreed-upon set of accounts.
- Principle 2: Revenue team processes must be to be tuned to identify, engage, and measure the progression of Buying Groups, not just individuals (leads/ MQLs).
- Principle 3: Revenue teams must monitor buying groups from each of their targeted accounts throughout their entire buying journeys.
Each principle points to what modern marketing teams should be doing—and measuring. We strongly encourage readers to explore the three principles further and examine current measurement practices for opportunities to align measurement to the reality of modern B2B.
Keep Reading: More Benchmark Breakdowns
This is just one slice of the data from this year’s Marketing Measurement Benchmark. For a broader look at how B2B teams approach measurement, explore our other reports covering ABM maturity, traditional demand generation, and more.
Appendix
Respondent and Company Profiles
We surveyed 634 B2B marketers in the early months of 2025. Responses were collected through a third-party panel provider. To address underrepresentation of VC-backed companies, the final dataset also includes 100 synthetic responses generated using predictive modeling based on patterns from real VC-backed respondents. This is described in more detail below.
Where appropriate, we compare this year’s results with responses collected in previous years — 716 additional responses gathered across 2023 and 2024 — to identify patterns over time.
Industries Represented
Respondents were most likely to work in Services organizations (57%), followed by Technology companies (18%) and Manufacturing firms (12%). The remaining 14% fell into an “Other” category for which respondents provided their own industry descriptions.
Seniority and Role Scope
A plurality of respondents held manager-level roles (35%), with directors making up another 23%. C-level leaders represented 18% of the sample, while 15% were individual contributors and 9% were VPs.
Most respondents (83%) reported working across multiple marketing functions, highlighting a strong presence of cross-functional marketers in the sample. Only 17% identified as single-function marketers.
Funding and Ownership Structure
Just over half of respondents (51%) said their company is publicly traded. An additional 25% came from privately held firms, while 21% worked at private equity (PE)-backed organizations. Venture capital–backed companies made up the smallest share at 3%.
Expanded Sample for VC-Backed Organizations
To address the limited representation of marketers from VC-backed organizations, we included 100 synthetic responses from simulated VC-backed organizations. These responses were generated using predictive modeling based on patterns observed in our real VC-backed respondents. Statistical tests confirm that there are no meaningful differences between the real and synthetic responses, indicating that the simulated data provides an accurate reflection of how additional VC-backed organizations would be expected to respond. Including these responses enhances the overall balance and representativeness of the sample — ensuring VC-backed companies are proportionally reflected in the findings.
Company Size
Respondents came from organizations of all sizes. The largest group (44%) worked at small companies with 200 or fewer employees, where average revenue was under $1 million. Mid-sized companies (201 to 1,000 employees) made up 27% of the sample, with revenue ranging from just under $1 million to around $30 million.
Larger companies were also well represented:
16% from firms with 1,001 to 5,000 employees (~$80 million average revenue)
6% from firms with 5,001 to 10,000 employees (~$644 million)
6% from firms with more than 10,000 employees (~$4.6 billion)
