Explore our help articles, product updates, and submit support tickets.
WE GET YOU. WE GOT YOU.
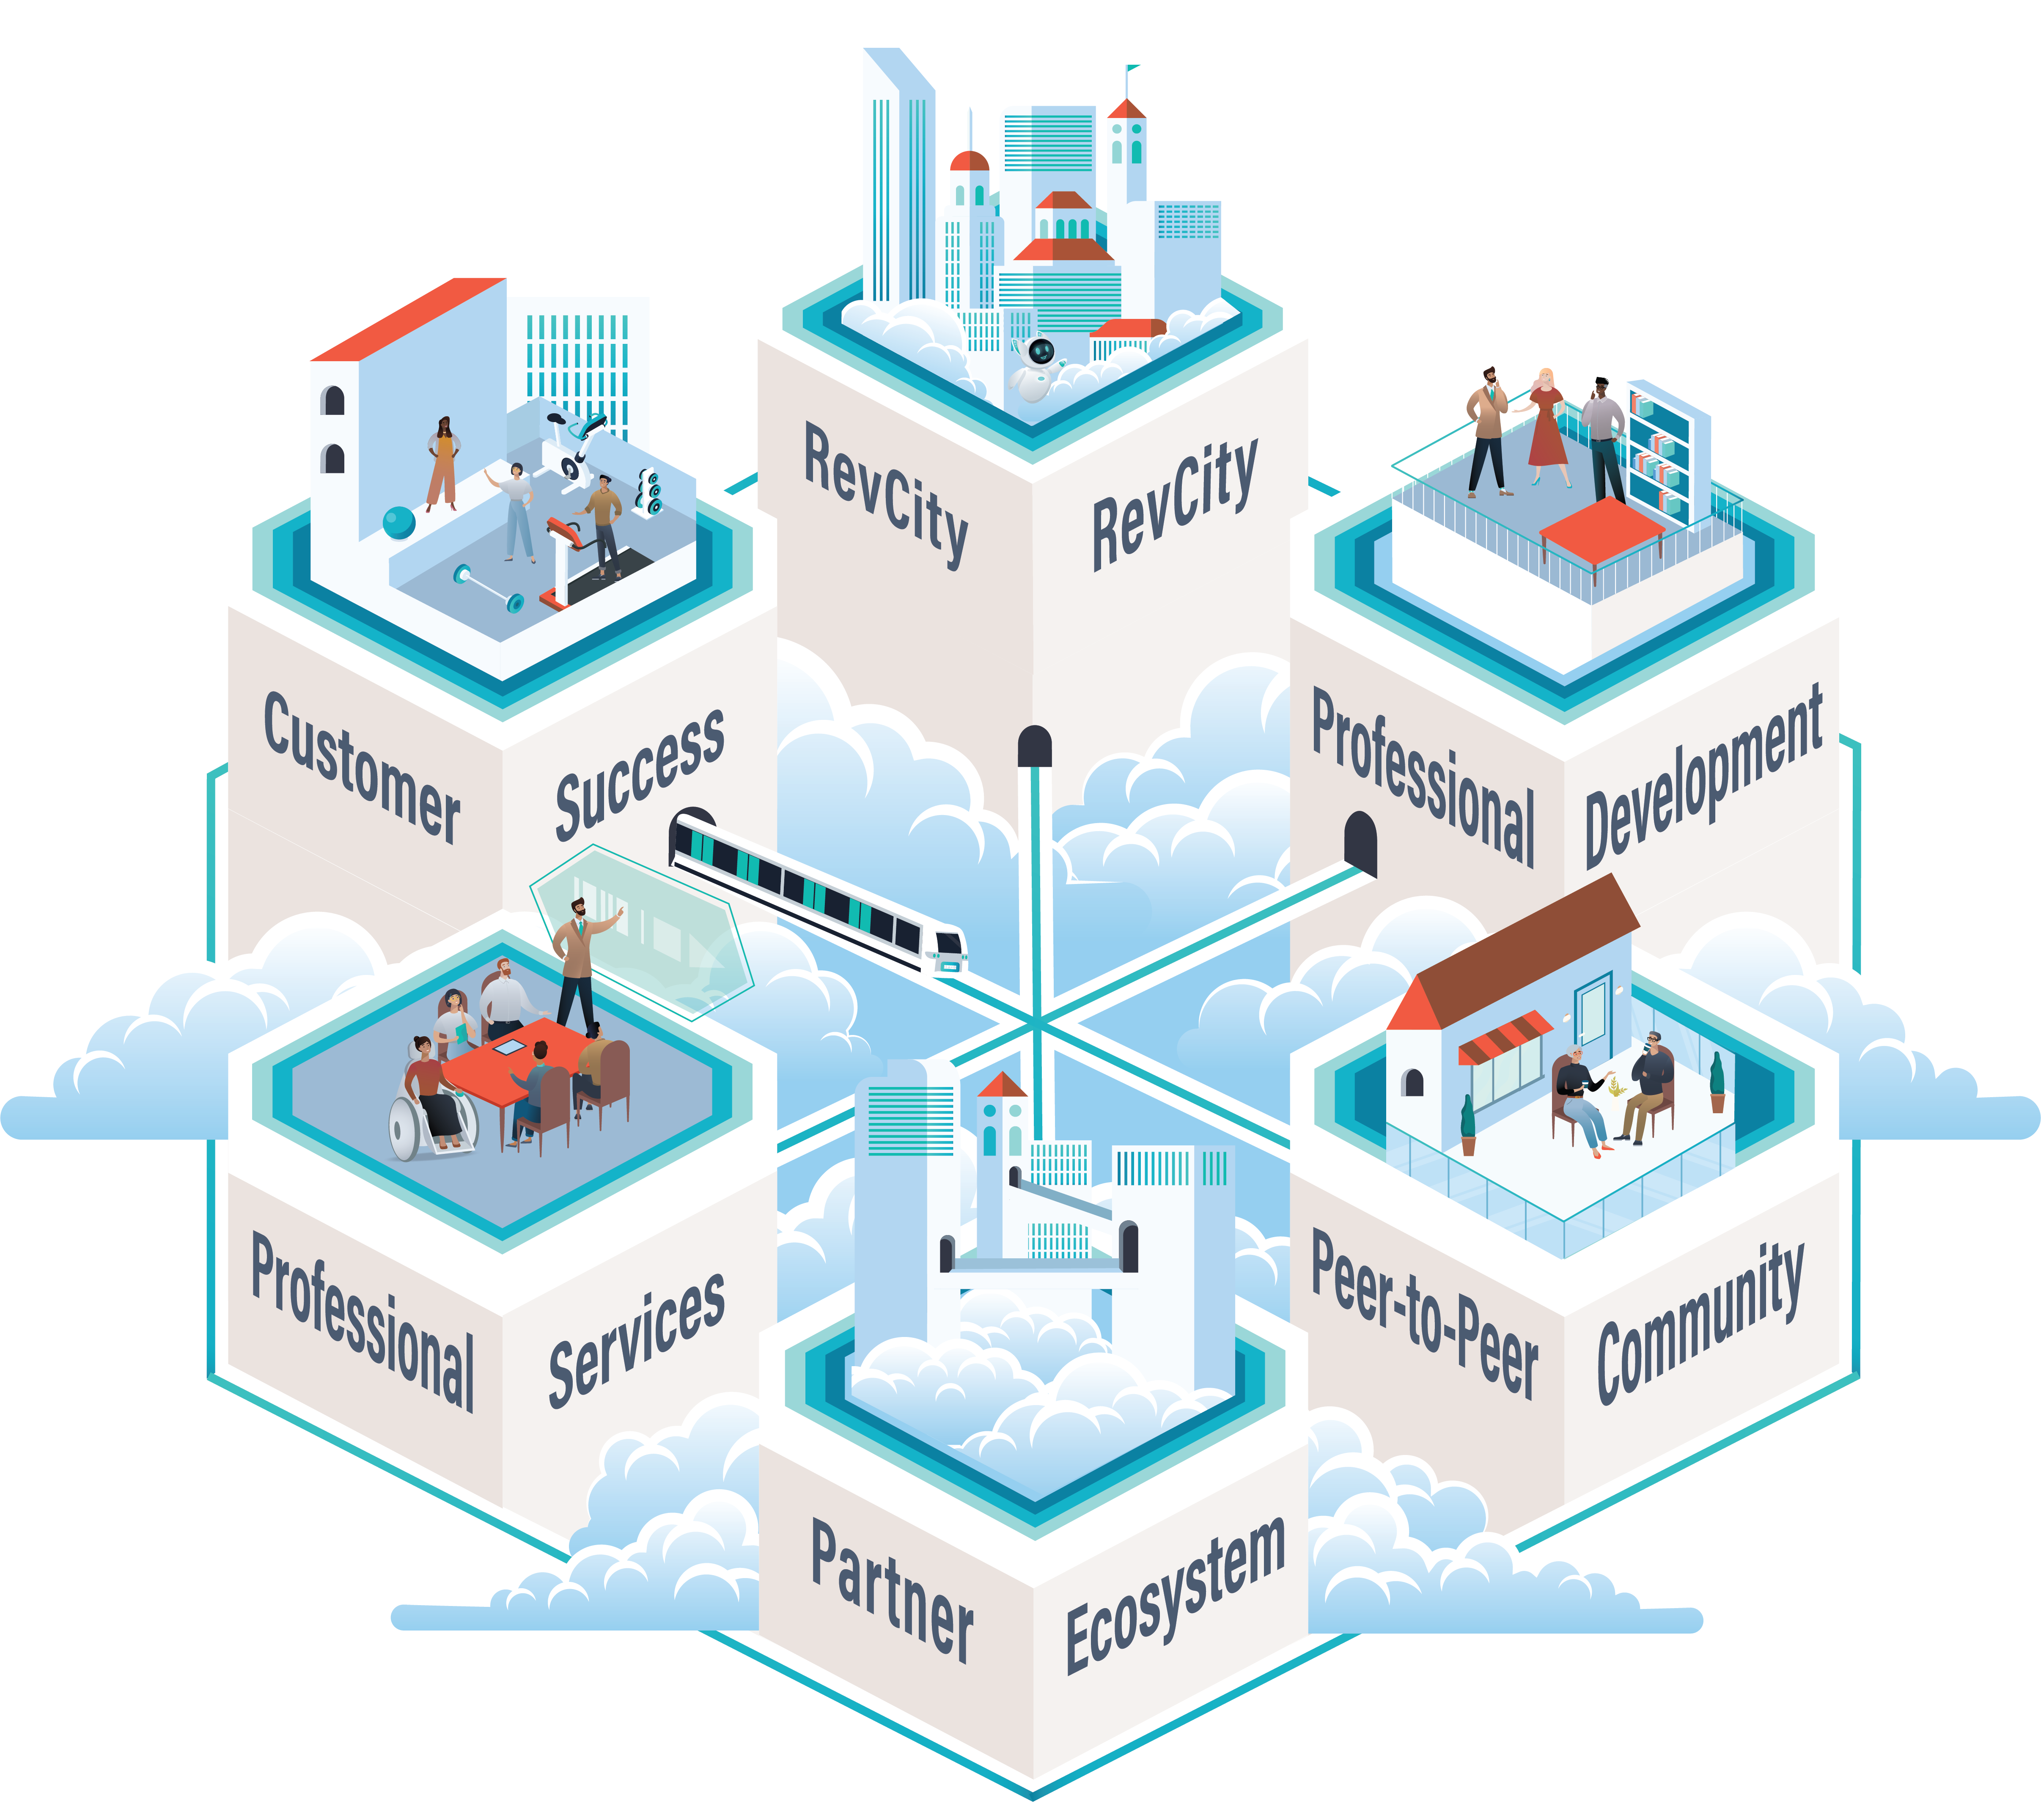
Introducing the 6dimensional Success Model™ – a methodology that empowers customers to unleash their full revenue potential and and achieve extraordinary outcomes.
Numerous factors influence the length of a buying journey, including:
Industry
Revenue
Solution type
Number of solutions
Buying group size
A recent 6sense survey of nearly 950 B2B buyers revealed exactly how much each factor plays into shortening or lengthening a buying cycle.
This research revealed:
Shorter buying cycles in manufacturing compared to tech
Shorter buying cycles for organizations with $1MM to $100MM of revenue compared to smaller or larger companies
Shorter buying cycles for solutions considered more important to an organization
Longer buying cycles for more expensive solutions
Longer buying cycles with larger buying groups
Longer buying cycles with more vendors engaged
B2B buying journeys have long been mysterious and frustrating for marketers and sellers alike. This research reveals insights that can help your teams understand the ways in which individual cycles could be lengthened or shortened — and how they can influence throughout the journey.
Read on for a more in-depth look at this research, including the methodology, our findings, and the broader implications
The Deep Dive
Reading Time: 2,692 words; about 14 minutes
Abstract/Summary
This report investigates the length of B2B buying journeys and identifies key factors influencing cycle duration. The research involves 930+ B2B buyers with purchases exceeding $10k, revealing that buying journeys average 11 months and involve large teams.
Distinct factors impact cycle length, including industry and organization size, purchase cost, solution type, and the number of vendors. Notably, Interaction Count and Buying Group Size have the most substantial influence.
This study highlights the importance of understanding these dynamics for revenue planning and emphasizes the impact of purchase cost and vendor count on buying cycle complexity. Helping buyers minimize vendor shortlists may shorten buying and selling cycles.
The Longer and Shorter of It: Why Some Buying Journeys Are Longer Than Others
Buying journeys are executed by large teams (average = ~10 members), each member of which has between 15 and 30 interactions with each of four vendors over the course of a buying journey that is more than 11 months long.
Buying in B2B is hard.
In this research, we wanted to uncover why some buying journeys are longer than others. We asked 936 B2B buyers who had been involved in a purchase of greater than $10k in value over the past 24 months the following question: “How long was the purchase process from the time your organization began researching solutions until the time the solution was finalized?”
By analyzing their responses to this question alongside the types of purchases they made, we were able to identify challenges faced by B2B buyers and the factors that contribute to longer or shorter buying journeys.
In this follow-up analysis to our B2B Buying Experience Report, we describe these findings and discuss what they suggest about how B2B providers can impact the length of buying journeys and sales cycles.
First Things First: Buying Journeys Are Not Sales Cycles
We begin by clarifying two terms that are frequently conflated in B2B: buying journey and sales cycle.
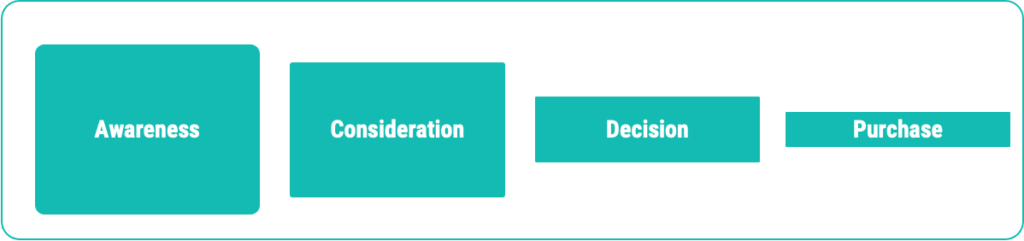
A buying journey is the process an organization goes through from the time they begin researching solutions to the time they make a purchase. Buying journeys, like sales cycles, have stages (e.g., Awareness, Consideration, Decision, Purchase), which reflect the buyer’s decision-making process.
A B2B Buying Process:
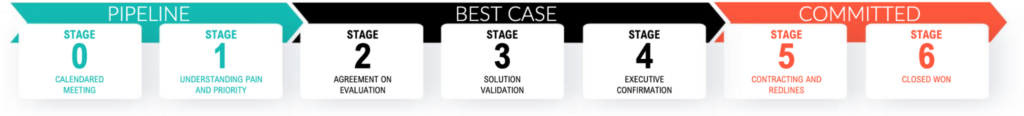
In contrast, sales cycles describe a selling organization’s progress in winning a deal, marking milestones in the seller-buyer relationship. Sales cycles also have stages, but those stages do not directly correspond to buying journey stages.
Confusion arises because buying and sales cycles sometimes run parallel once they intersect. However, buyers are typically two-thirds through their journey before engaging with sales.
Also, some buying journeys begin and end without involving one or more potential competitors, meaning that some buying processes begin and end without triggering a corresponding sales cycle in one or more potential vendors.
A B2B Sales Process:
The Factors That Influence Buying Cycles
Firmographic Factors Influence on Buying Cycle Length
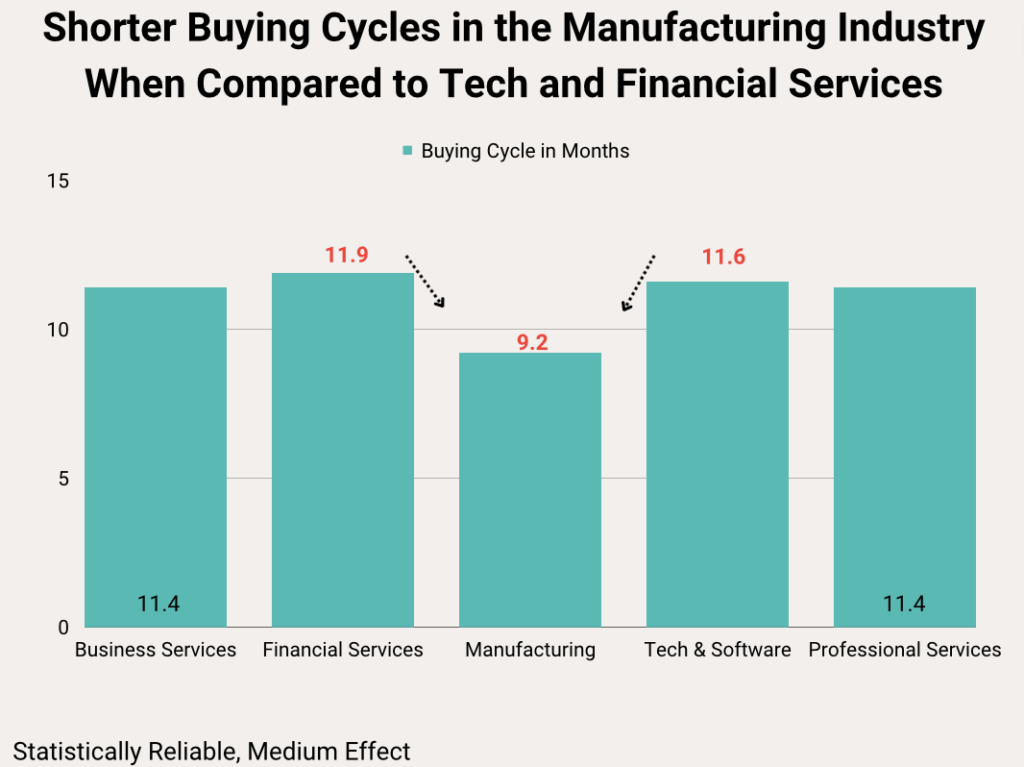
We observed statistically reliable but minor differences in Buying Cycle Length based on the Industry and Organization Size of the buyer. Buyers in the Manufacturing industry reported shorter buying cycles than Tech & Software and Financial Services buyers, though the Financial Services differences were not meaningfully different.
There may be many reasons that manufacturing purchases take less time than others, but we note that Buying Group Sizes for manufacturing purchases were substantially smaller (7.4 members) than those for Tech and Software (10.0 members) and Financial Services (10.5 members).
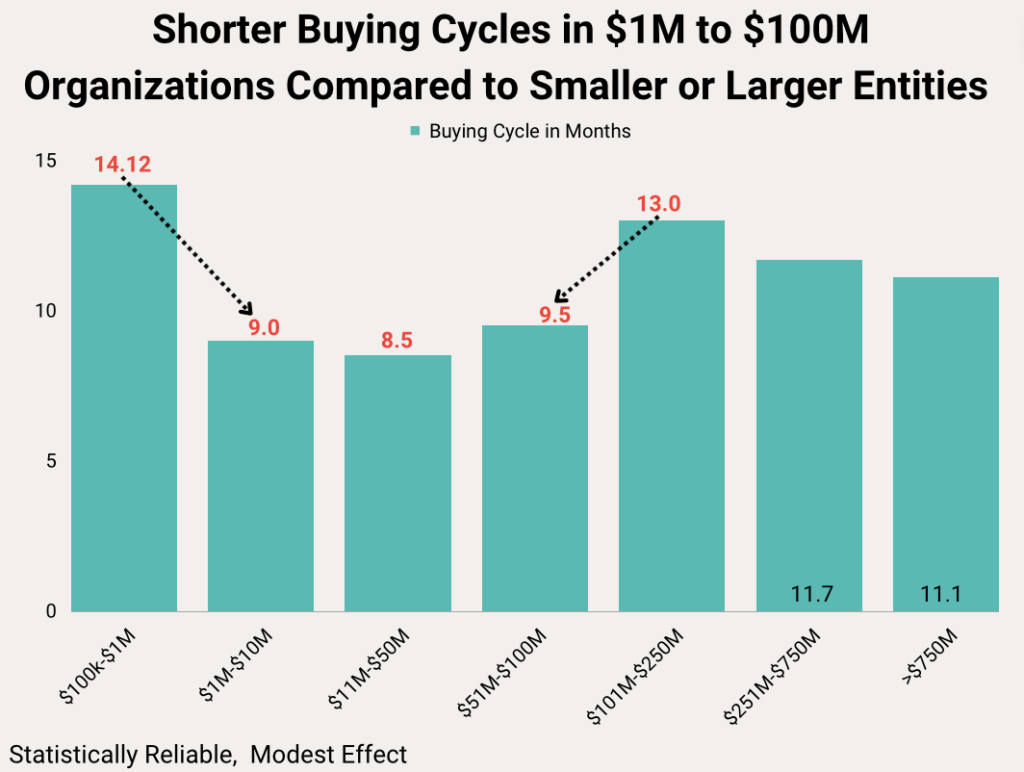
We also noted that organizations that ranged from $1M to $100M had reliably shorter buying cycles than those that were either larger or smaller. We do not have data or hypotheses to explain these differences at this time.
Buying Process Factors Influence on Buying Cycle Length
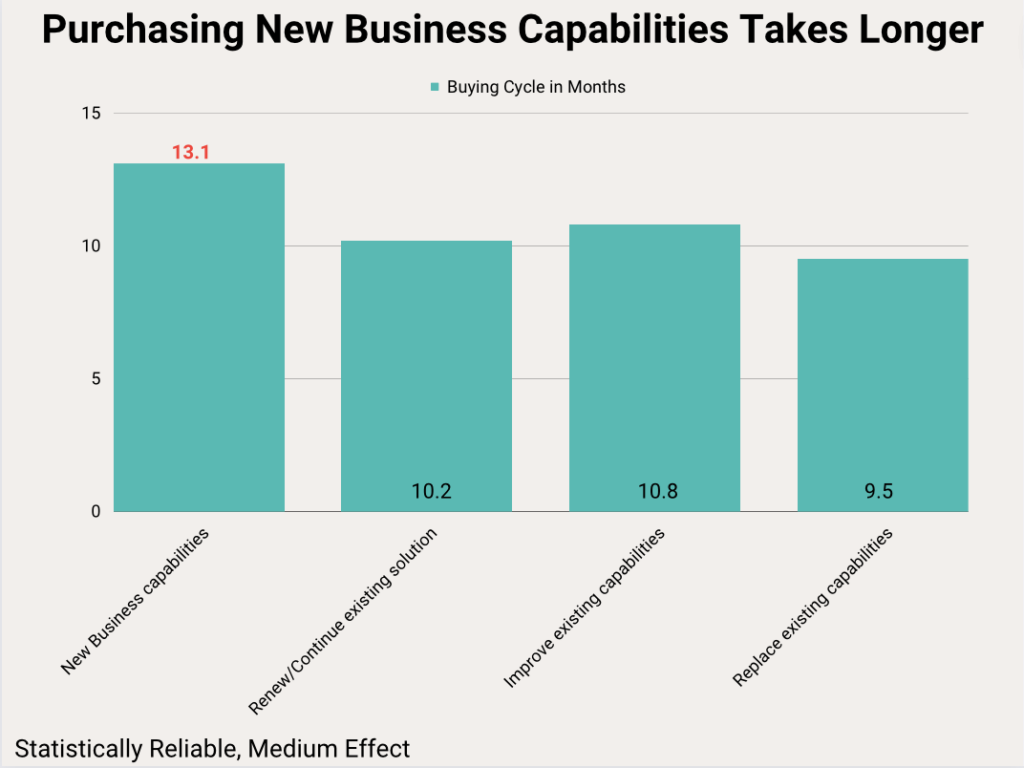
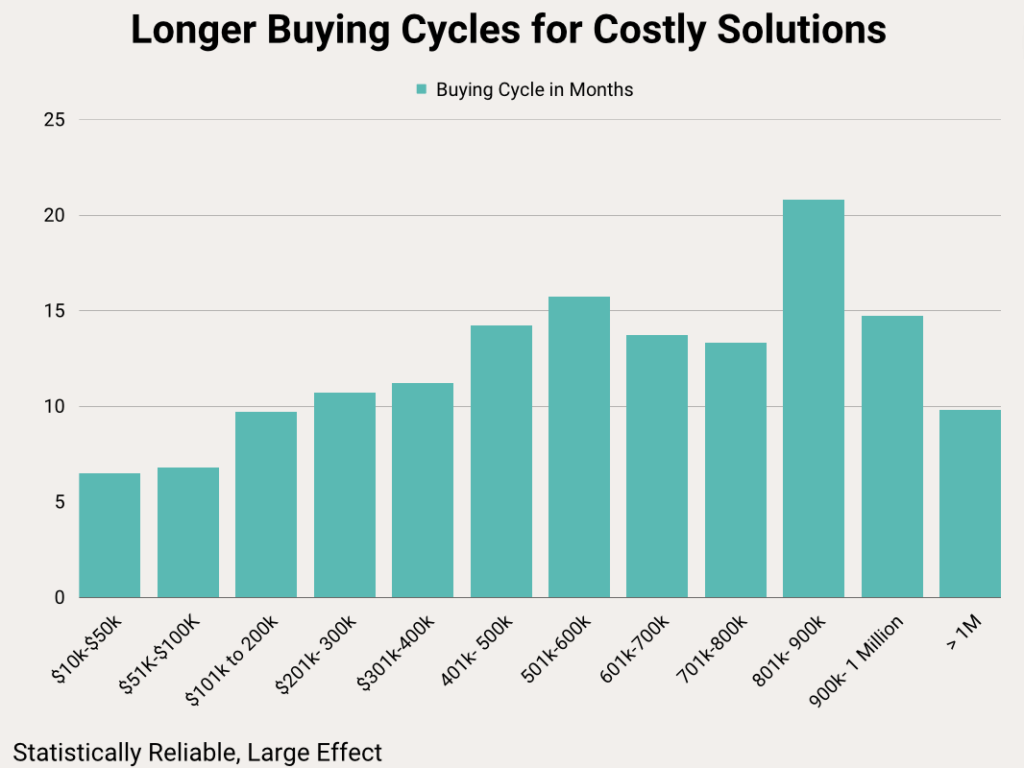
Turning to buying process factors, we observed that buying cycles for new business capabilities are reliably longer than for other types of purchases. In addition, solutions that are more expensive have longer buying cycles than less costly solutions. For example, purchases under $100K are substantially shorter than those from $101K to $400K.
Neither of these findings would surprise B2B revenue professionals; each factor would be expected to add scrutiny — and therefore time — to a purchase process. Indeed, we found strong positive correlations between purchase cost and how many interactions each buying team member has with the winning vendor, how many vendors the buying organization evaluates, and how many individuals comprise the buying team.
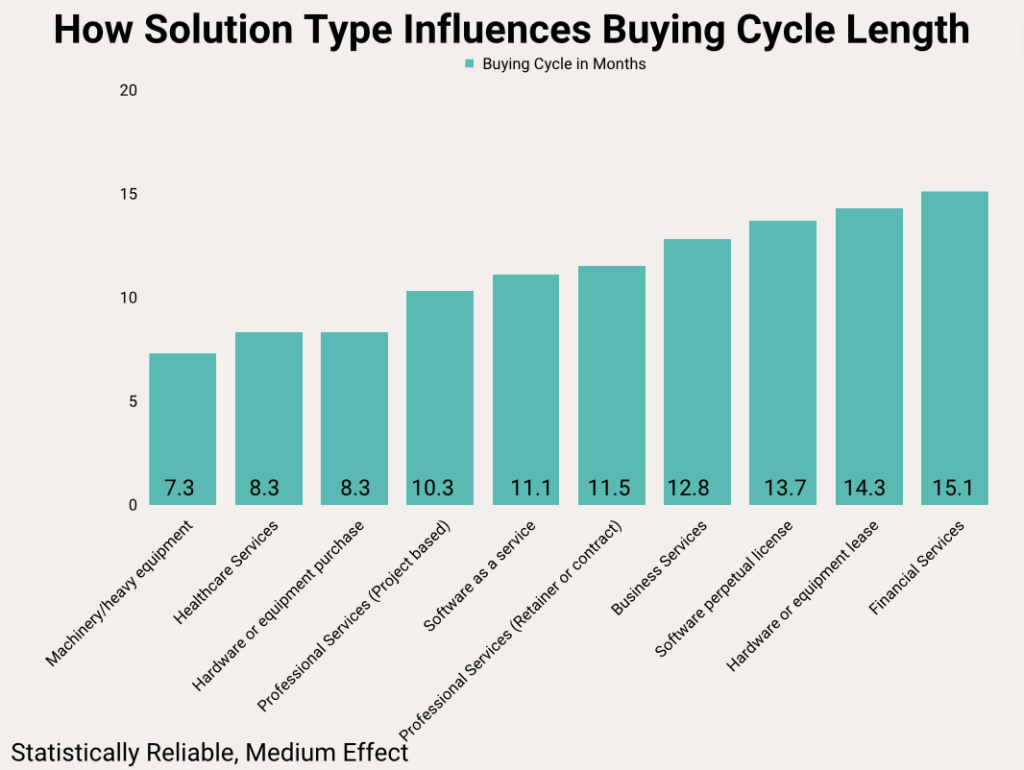
Likewise, the Solution Type influences Buying Cycle Length, with many statistically reliable differences in Buying Cycle Length based on the type of solution being purchased. These differences are depicted in the bar chart titled How Solution Type Influences Buying Cycle Length. Some solutions appear to demand more complex buying processes than others, leading to differences in Interaction Count, Buying Group Size, and Vendor Count. These factors will be included in models we create later in this report to account for their influence on Buying Cycle Length, but they are not the subject of this report.
Next, we had hypothesized that as solutions were considered more important by their organizations, Buying Cycle Length would increase. We found, however, that the reverse was true. More important solutions tend to have slightly shorter buying cycles, perhaps indicating that the selection of more important purchases is prioritized by buying organizations.
As we reported in our primary report on B2B buying experience, the number of vendors (Vendor Count) evaluated has a strong influence on the length of a buying cycle. Evaluating five vendors rather than the average of four extends the buying process by approximately two months. The reverse is also true. Evaluating fewer vendors substantially reduces buying cycle time.
Similarly, the number of interactions a buying team member reported having with the winning vendor was also associated with longer buying cycles.
Our initial analysis revealed a strong positive correlation between Buying Group Size and Buying Cycle Length, indicating that larger buying groups tend to have longer buying cycles. However, we also found robust relationships between Buying Group Size and other factors.
For instance, both purchase cost and the number of vendors being evaluated showed strong positive associations with buying group size. This complexity suggests that the relationship between buying group size and the length of a buying cycle is multifaceted. We will explore this in more detail below.
Disentangling Influences on Buying Cycle Length
To assess how these factors operate concurrently to influence Buying Cycle Length, we first conducted a multiple regression analysis, entering the factors discussed above as independent variables predicting Buying Cycle Length.
The final model produced by adding all the variables mentioned above accounted for 64% of the reason that one buying cycle is longer than another. Other factors not measured in our study would account for the 36% not accounted for by our model.
This is a remarkably high number, considering all of the factors that might cause buying cycles to be longer or shorter. Further, our analysis established that just six variables (Company Size, Purchase Cost, how important the solution is to the buyer, Buying Group Size, Interaction Count, and Vendor Count) contributed to the predictive power of the model. Removing Solution Type, Industry, and Purchase Type from the model reduced the model’s predictive power by less than one point, from 64% to 63.3% – a negligible difference.
In the real world, then, it is not the type of purchase, the type of solution, or even the buyer’s industry that causes buying cycles to be longer or shorter. Instead, it is a combination of the other six factors in our model.
Interaction Count had by far the largest direct influence on Buying Cycle Length – substantially larger than the next largest, Buying Group Size. When buyers have to continually revisit vendor content and personnel to distinguish competitor capabilities, buying cycles are extended.
Similarly, Buying Group Size influences Buying Cycle Length. Not surprisingly, when more people are involved in a buying decision, those decisions take longer to make.
(The influences on Buying Group Size will be analyzed extensively in a forthcoming report.)
For both of these factors, however, we still need to ask, What causes buying groups to need more interactions and more team members to reach a decision?
Our analysis showed that for both Interaction Count and Buying Group Size, there is a complex web of factors that influence each. For example, while more interactions per person leads to longer buying cycles, three other factors in the model (Vendor Count, Purchase Cost, and Solution Importance) all strongly influence Interaction Count (for all statistics, please see the Appendix).
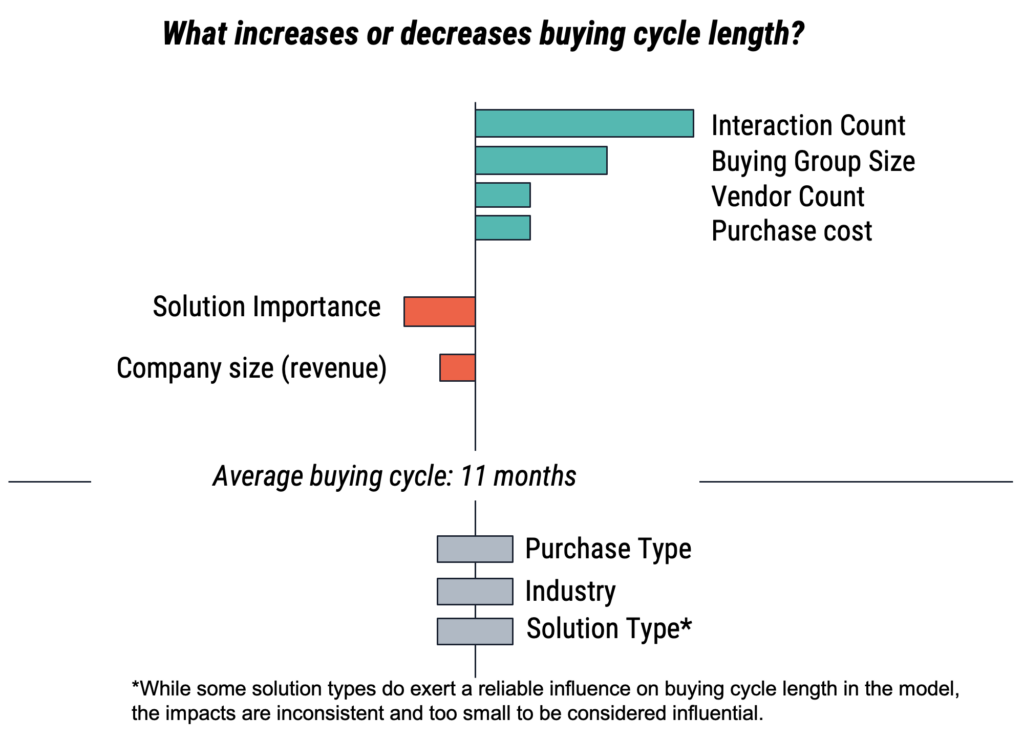
Chart 1: The relationship of factors with Buying Cycle Length
Note: Bars above represent the relative influence of each of the factors in the model. Bars to the right of the center line increase cycle length, while those to the left decrease cycle length. Bars centered on the line have no effect on buying cycle length.
For all but two factors, the influence on buying cycle length was positive, meaning that increases in each were associated with longer buying cycles.
As mentioned earlier, Solution Importance has a negative relationship with buying cycles, such that more important solutions had shorter, not longer buying cycles. B2B revenue professionals may be surprised to learn that Company Size is similar, such that larger companies tend to have shorter buying cycles.
Making Sense of the Complex Influences on Buying Cycle Length
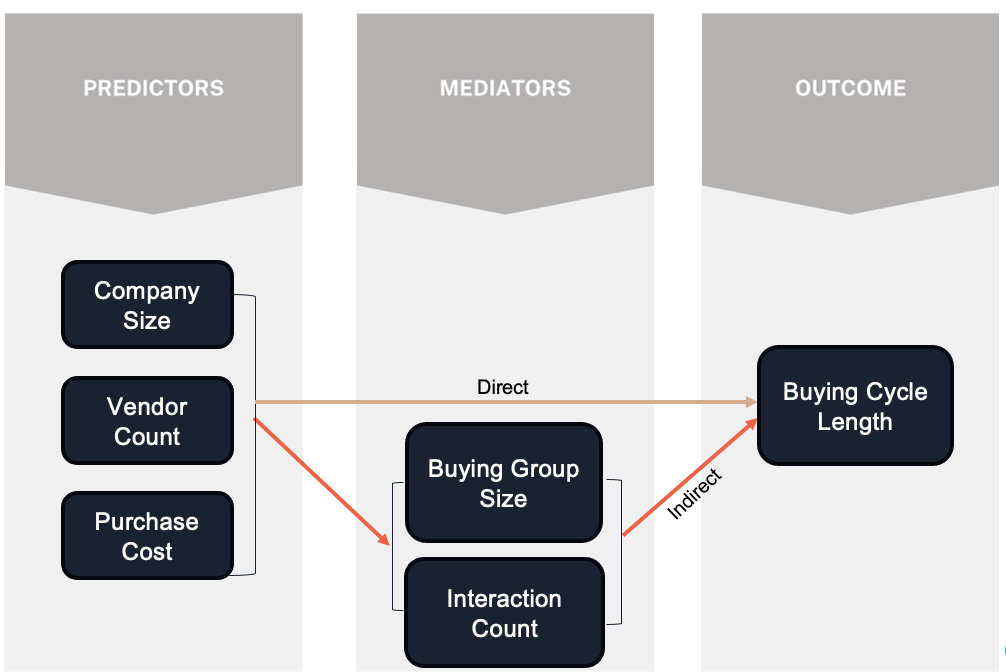
To make sense of these complex influences on the length of a buying cycle, we conducted a mediation analysis. A mediation analysis tests whether independent variables (e.g., Purchase Cost, Vendor Count, Company Size) affect a dependent variable (Buying Cycle Length) both directly and indirectly by influencing intermediate variables (e.g., Buying Group Size, Interaction Count). See Chart 2 for an illustration.
For example, consider an organization that wants to understand how its product quality impacts customer satisfaction. Of course, the objective quality of the product will have a direct impact on how happy customers are. However, other factors, such as employee training, may have an indirect effect on the relationship between product quality and customer satisfaction. If customer success employees are not properly trained, they may not be able to help customers realize the full value of the product. Mediation analysis provides a structured approach to parse both direct (product quality) and indirect (customer success employee training) influences on an outcome (customer satisfaction).
In the present mediation analysis, three factors – Purchase Cost, Vendor Count, and Company Size – were entered as independent variables predicting Buying Cycle Length. Those three factors were hypothesized to influence Buying Group Size and Interaction Count, which were entered as mediators – the indirect effects. Set up this way, the model would test the strength of both the direct and indirect influences that PurchaseCost, Vendor Count, and Company Size exert on Buying Cycle Length (see below for a visual representation).
Chart 2: The mediation model parsing influences on Buying Cycle Length
Finally, other factors that were seen to influence Buying Cycle Length outside of the regression model — Purchase Type, Industry — were entered as background confounders. (For technical reasons, Solution Type could not be entered as a factor.) This process ensures that the influence of the direct and indirect influences under consideration are statistically isolated from any influence exerted by Industry and Purchase Type.
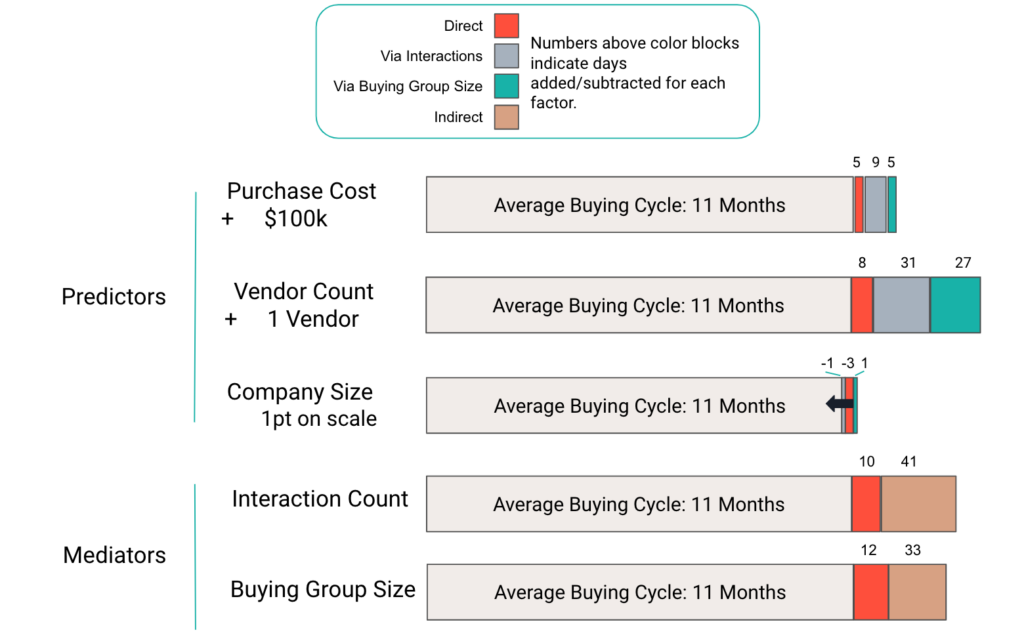
Chart 3: Direct and Indirect Influences on Buying Cycle Length
Note: Because Solution Importance is not something that is likely to be measured in advance or managed, it was not included as a predictor or mediator, but was entered as a Background Confounder to remove its influence from the final analysis.
As Chart 3 shows, both Purchase Cost and Vendor Count exert substantial influence on the length of a buying cycle both directly and indirectly, with the indirect effects substantially outweighing the direct effects.
For Vendor Count, the total indirect effects are over eight times the direct effects. For Purchase cost, indirect effects are four times the magnitude of the direct effects. Company Size exerts a smaller influence on cycle length, with larger companies tending to engage in shorter buying cycles, all other factors considered.
Finally, our analysis shows that the large influence of both Interaction Count and Buying Group Size on Buying Cycle Length is substantially due to the fact that Solution Cost and Vendor Count strongly influence both factors, which in turn strongly influence Buying Cycle Length. Company Size impacts both mediators, as well, but the effects are minimal.
Implications
Time, as the cliché goes, is money. Certainly, when the time in question is found in the length of buying cycles, the connection between time and money is clear. Buying cycles that take longer delay the realization of revenue for provider organizations. And, longer buying cycles run a greater risk of being terminated without a purchase.
In the research discussed above, we have determined that there are numerous meaningful differences in Buying Cycle Length based on the industry of the purchaser, the type of solution being acquired, and the nature of the purchase itself. Revenue professionals can use this information to understand their buyers better, and to aid in their revenue production planning.
However, our research went much deeper and uncovered the reasons that buying cycles for some industries and solutions vary from the average of 11 months. For example, while purchasers in Manufacturing have substantially shorter buying cycles (9 months) than other industries (11.3 months), that effect is almost entirely (99%) due to manufacturers evaluating fewer vendors (3.7 v 4.2 for other industries) and deploying smaller buying groups (7.4 members v 9.2 members for other industries). Future research will explore these buying group differences in greater detail.
As we said at the start of this report, B2B buying processes are arduous. Buying teams are large. Each member of the team may have dozens of interactions, both digital and with other people, on the way to making a purchase decision. What’s more, buyers are diligent in their evaluations, reporting that they have as many interactions with non-winning competitors as they do with winners.
As such, the most significant finding described in this report is that two factors in particular appear to substantially influence the complexity of buying decisions — the price of the solution (Purchase Cost) and the number of potential suppliers evaluated (Vendor Count). As solutions get more expensive, and as buyers evaluate more vendors, our research shows that buying groups get larger, and each member of the buying group has to do substantially more work to arrive at a purchase decision. As larger buying teams have increasingly more interactions on the way to making a decision, their buying cycles are extended.
While B2B organizations are generally interested in increasing their average deal size, this research suggests what the impact of doing so is likely to be. We have not only identified that increasing price tags lead to longer cycles, we have identified how much longer. Organizations can use these findings to inform their revenue planning.
Perhaps even more significantly, we also found that the number of vendors being considered has an out-sized influence on the length of buying cycles, with each vendor added to a buying process above the average of four, adding more than two months to the average 11 month buying cycle. The reverse is true, as well. Eliminating a competitor early not only increases the odds of success but decreases cycle length substantially.
This is significant, because most organizations do not actively seek to limit the number of competitors a prospect evaluates. Our research suggests that leaving this to sales reps will not help limit cycle length. To be effective, B2B organizations help buyers settle on a shorter short-list early in their buying cycles.
By clearly communicating which small set of competitors comprise a core group that buyers ought to consider, providers can both serve their buyers and, at least occasionally, prevent buying cycles from expanding to include fringe competitors that will add time and complexity to the buying process.
Above all, this research shows that buying in B2B is hard work, and that organizations that do the best job of enabling buyers to thoroughly research solutions how and when they choose will have a strong advantage in the marketplace.
Appendix
Reading Time: 2,270 words; about 11 minutes
Table 1: Statistical Reporting
Finding
Statistical Test
Statistic
Significance Level
Effect Size
Sample Size
The average buying team consists of about 10 people.
Average
n/a
n/a
n/a
934
Each member of the buying team has between 15 and 30 interactions per vendor.
ANOVA
F=149.04
p<.001
n2=.417
840
Buying teams consider an average of four suppliers.
Average
n/a
n/a
n/a
934
The average buying journey is about 11 months.
Average
n/a
n/a
n/a
934
Buying cycles in Manufacturing are reliably shorter than those in Tech & Software and marginally shorter than those in Financial Services.
ANOVA
F=5.042
p<.001
n2=.02
934
Organizations that range from $1M to $100M have reliably shorter buying cycles than those that are either larger or smaller.
ANOVA
F=7.327
p < .001
n2=.045
934
Purchases under $100k were substantially shorter than those from 101k to 400k. 801k to 900k purchases were longer than all but 501k to 600k purchases. Other minor differences were observed.
ANOVA
F=20.158
p < .001
n2=.194
934
The Solution Type influences Buying Cycle Length, with many statistically reliable differences in Buying Cycle Length based on the type of solution being purchased. Business Services > Hardware or equipment purchaseBusiness Services > Individual machinery heavy equipmentFinancial Services > Hardware or equipment purchaseFinancial Services > Individual machinery heavy equipmentFinancial Services > Professional Services Project basedFinancial Services > Software as a serviceHardware or equipment lease > ( Hardware or equipment purchaseHardware or equipment lease > ( Individual machinery heavy equipmentHardware or equipment purchase < Software as a serviceHardware or equipment purchase < (Software perpetual licenseIndividual machinery heavy equipment < Software as a serviceIndividual machinery heavy equipment < Software perpetual license
ANOVA
F=7.646
p < .001
n2=.077
934
Purchases of new business capabilities are reliably longer than the other types.
ANOVA
F=6.786
p < .001
n2=.021
934
As buying group sizes get larger, so too do buying cycle lengths. The relationship is very strong.
Pearson’s Correlation
r = .719
p<.001
Fisher’s z=.905
934
As individual buying group members have more interactions, buying cycles are extended. The relationship is very strong.
Pearson’s Correlation
r=.745
p < .001
Fisher’s z=.962
934
As individuals evaluate more vendors, buying cycles are extended. The relationship is strong.
Pearson’s Correlation
r = .568
p<.001
Fisher’s z=.644
934
Solutions rated more important by buyers tend to have slightly shorter, not longer buying cycles.
Pearson’s Correlation
r= -0.134
p<.001
Fisher’s z=-0.134
934
Industry, company size, purchase cost, solution type, purchase type, solution importance, buying group size, interactions with vendors, and the number of vendors evaluated accounted for 64.0% of the reason that one buying cycle is longer than another.
Regression
F=89.79
p<.001
R2=.64
928
Removing Solution Type, Industry and Purchase Type from the model discussed above, reduced the present model’s power in predicting buying cycle length by less than one point, from 64.0% to 63.3%.
Regression
F=264.4
p<.001
R2=.63
928
Vendor Count, Purchase Cost and Solution Importance all strongly influence Interaction Count.
Regression
F=273.09
p<.001
R2=.47
928
Purchase cost, number of vendors evaluated, interactions with the winning and losing vendors, and the importance of a solution accounts for 63% of the variability in buying group size.
Regression
F=296.5
p<.001
R2=.63
876
A single vendor more or less than the average of four can be expected to add or subtract more than a month from a buying cycle. For Vendor Count, the total indirect effects are over eight times the direct effects.
Mediation Analysis
Z-value=19.88
p<.001
Estimate= 2.190
934
For purchase cost, its indirect effects on the length of the buying cycle are four times the magnitude of its direct effects.
Mediation Analysis
Z-value=8.199
p<.001
Estimate=.625
934
Company Size exerts a smaller influence on cycle length, with larger companies tending to engage in shorter buying cycles, all other factors considered.
Mediation Analysis
Z-value= -2.09
p=.03
Estimate= -.100
934
The number of vendors being evaluated is strongly positively associated with buying group size.
Pearson’s Correlation
r = .657
p < .001
Fisher’s z=.787
934
There is a positive correlation between purchase cost and how many interactions each buying team member has with the winning vendor.
Pearson’s Correlation
r = .393
p < .001
Fisher’s z=0.415
929
There is a positive correlation between purchase cost and how many vendors the buying organization evaluates.
Pearson’s Correlation
r = .268
p < .001
Fisher’s z=.268
929
There is a positive correlation between purchase cost and how many individuals comprise the buying team.
Pearson’s Correlation
r = .381
p < .001
Fisher’s z=.401
929
Source: 6sense
Table 2: Firmographic and Buying Process Information Collected from Respondents
Factor
Factor Values
Firmographic Factors
Industry – What industry is the buying organization a part of?
Business ServicesConstructionEducationEnergy/Oil & GasFinancial servicesHealthcareInformation technologyLeisure and entertainment ManufacturingManufacturingReal estate RetailSales Transportation UtilitiesWholesale
Company Size – What is the buying company size measured in revenue?
Measured by employee count on a 10-point scale ranging from less than 50 to more than 10K
Buying Process Factors
Purchase Cost – How much did the purchase cost? (minimum $10,000 annual value)
The annualized value of the purchase measured on a 12-point scale ranging from $10k to over $1 million
Buying group size – How many people were part of the solution evaluation team?
Numeric response
Solution Importance – How critical to the functioning of your organization is that solution?
Rate the importance of a solution to the organization on a scale from Non-essential/nice to have (1) to Essential (5)
Interactions with the winning vendor – How many interactions did you have with the winning vendor?
Numeric response
Vendor Count – How many vendors were evaluated as part of the buying process?
The number of vendors being evaluated, measured by respondents’ estimate
Purchase Type – What kinds of capabilities did the purchase bring?
Improve existing capabilitiesNew business capabilitiesRenew/ Continue Existing SolutionReplace existing capabilities
Solution Type – What type of solution was the purchase?
Business ServicesFinancial ServicesHardware or equipment leaseHardware or equipment purchaseHealthcare ServicesIndividual machinery/heavy equipmentOther – Please specifyProfessional Services – Project-basedProfessional Services – retainer or contract termSoftware as a serviceSoftware perpetual license
Table 3: Definitions of Statistical Terms
Statistical Term
Definition
Statistical significance
Statistical significance is a measure of how reliable survey data is. It tells us how likely it is that the result we found represents the real world. For survey research, the standard for determining statistical significance is that we would expect to find the same result 95% of the time we replicate the survey with a sample drawn from the same population. 6sense Research uses the word “reliable” instead of “significant,” because we think it is a more accurate description of this concept. The word “significant” is often taken to mean “important” or “large” in everyday conversation, but there are many cases in which findings that are statistically significant are not meaningful, large, or important.
Significance is not importance
Statistical significance is a measure of how reliably a finding represents the population or real-world condition of interest. However, the word “significance” can be misleading. It can make people think that a statistically significant finding is also important or meaningful. But this is not always the case. In fact, many findings that are statistically significant are not really significant in any way that we would care about. When we encounter findings that are statistically “significant” but not important, we describe them as “not meaningful.” For instance, in our research of B2B buying processes we found that buyers reliably consume vendor content (e.g., website, webinars) more than they read analysts reports, but only by 4%. Thus, is an example in which we found a “statistically significant” finding that is not very meaningful.
Correlation
Correlations measure whether changes in one factor are reliably associated with changes in another. The easiest correlations to think about are those where one measurement increases, and then a second one also consistently increases. For example, in our research on B2B buying processes, we found that when buyer’s increase the number of vendors they evaluate, their buying process takes longer. That is a positive correlation. In contrast, we found a weak but reliable negative correlation between how important a buyer rates a solution and the length of the buying cycle. More important solutions have reliably shorter buying cycles .
Multiple Regression Analysis
Multiple regression (more formally, Multiple Linear Regression) is a statistical method used to predict or explain an outcome (such as buying cycle length) from various factors that might impact it (such as solution price, number of vendors under evaluation, and how important the solution is to buyers). Hence, regressions are considered predictive models. In the example alluded to here, we used multiple regression to figure out how much of the variability in buying cycle length these three factors (price, number of vendors, solution importance) can account for. Multiple regression also provides a measure of how important each factor is to the model’s prediction.
Independent variable
An independent variable is the factor that you manipulate or suspect is influencing a change in another variable. For example, let’s say you are a manager and you want to know if the amount of time employees spend working overtime affects their performance. In this case, the independent variable would be the amount of time spent working overtime, and the dependent variable would be performance.
Dependent variable
A dependent variable is an outcome that you are measuring to see how it changes in response to an independent variable. Imagine you’re checking how staying late at work (overtime) affects how well you do your job. In this case, how well you do your job is the dependent variable. That is, we’re seeing if it’s dependent on whether you work overtime or not.
Mediation Analysis
Mediation analysis is used to figure out how one thing can cause another thing to happen, but with a twist. It helps us understand if there’s a middle player involved. For example, you might want to know if the relationship between job satisfaction and performance is mediated by stress. In other words, mediation analysis can be used to see how changes in one thing (the independent variable or predictor) can indirectly affect changes in something else (the dependent variable) via the influence of a third thing (the mediator). For example, if you find that job satisfaction is positively correlated with performance, but this correlation disappears when you take stress into account, then you can conclude that the relationship between job satisfaction and performance is mediated by stress.
Mediator(s)
A mediator functions as the middleman in a process or relationship. It’s the mechanism through which one thing might affect something else. For example, in our research on B2B buying processes, we observed that as buyers evaluate more vendors, their buying cycles tend to become longer. However, one of the factors that underlies this connection is the number of interactions buyers have with potential vendors. Adding vendors causes buying team members to work harder to differentiate vendors. This causes each person to have more interactions with each vendor. That, in turn, makes the buying cycle longer. In this example, the number of interactions buyers have is a “mediator” or middleman in this relationship because it contributes and partially explains the relationship between having more vendors under evaluation and longer buying cycles.
Direct & Indirect Effects
In trying to understand how some factors influence outcomes of interest (e.g., How does the number of vendors being evaluated impact the length of a buying cycle?), we often find that a single factor has an impact on that outcome both directly and indirectly, by first influencing other factors.Direct Effect(s)For example, in our research of B2B buying processes, we found that adding an additional vendor to the list of vendors a buying team is evaluating extended the buying process by 71 days. However, only 21 of those days were due to the Direct Influence of adding a vendor to the list. The majority of the 71 day impact was due to indirect effects.Indirect Effect(s)In that same example, we found that 9 of 71 additional days were due to each member of a buying team needing to have more interactions with each vendor. The remaining 41 of those 71 extra days were added on because the additional complexity of comparing an additional vendor required buying groups to add two more members to the team to help account for the additional work. The increase in interactions and team members are mediators, and the addition to the buying cycle they cause are indirect effects.
Background Confounder(s)
A background confounder is like a hidden player in the background of a story. It’s something that can mess up our understanding of how one thing affects another. For instance, let’s say we’re trying to figure out if a company’s size affects how quickly they make purchase decisions. To get a clear picture, we might mathematically “silence” factors such as industry, the type of purchase being made, and more to allow us to clearly examine the link between company size and buying cycle length without concerns that external factors might blur the picture. In this scenario, things like industry and the type of purchase they’re making are called “background confounders” because they hang out in the background and can complicate our understanding of the main relationship we’re exploring.
Kerry Cunningham
Kerry Cunningham is a thought leader in B2B marketing and is a former SiriusDecisions and Forrester analyst. He’s an expert in the design and implementation of demand-marketing processes, technologies and teams for a wide array of B2B products, solutions, and services. He’s also developed a wealth of expertise in the alignment of marketing and sales organizations.