

• Introduction, about 1 minute
• Quick Overview, about 1 minute
• The Deep Dive, about 21 minutes
• Appendix, about 7 minutes
Introduction
Read Time: 171 words; About 1 minute
Buyers are in control. When evaluating B2B investments, they spend 70% of their time doing as much research as they can before having direct conversations with a sales rep. This period of anonymous research is conducted in what we call The Dark Funnel™.
By the time they speak to a sales rep…
- 78% either had already determined their solution requirements or experienced only slight changes after initial vendor interactions
- 84% will ultimately choose the first vendor they contact, indicating they’ve already chosen a solid front-runner before making contact
Why It Matters
Critical decisions are being made long before the first conversation between buyers and sales reps. We asked nearly 1,000 buyers how they are making those decisions.
These findings indicate that buyers are reading content and meeting internally most consistently throughout their journey. This highlights the importance of targeting buyers with messages and useful resources that will influence them long before they’re ready to pick up a phone or schedule a Zoom call.
Quick Overview
Read time: 238 words; About 1 minute
When 6sense surveyed B2B companies for our 2023 B2B Buyer Experience Report, we asked them about a broad range of activities that buyers often conduct while researching potential solutions.
We wanted to identify which activities are most important to buyers so that B2B revenue teams can do a better job of serving buyers and positioning themselves to win deals.
Some activities happen throughout the entire buying journey — such as meetings of buying team members, reading analyst reports, and online research. Other activities happen after buyers begin conversations with sellers — such as demos and meetings with vendors.
Activities can be categorized as “human mediated,” “digital mediated,” or a mix.
The research revealed the three most common self-led, buyer activities throughout their journey:
- Internal meetings with buying team (52%)
- Consuming vendor content, such as websites and webinars (43%)
- Reading analyst reports (39%)
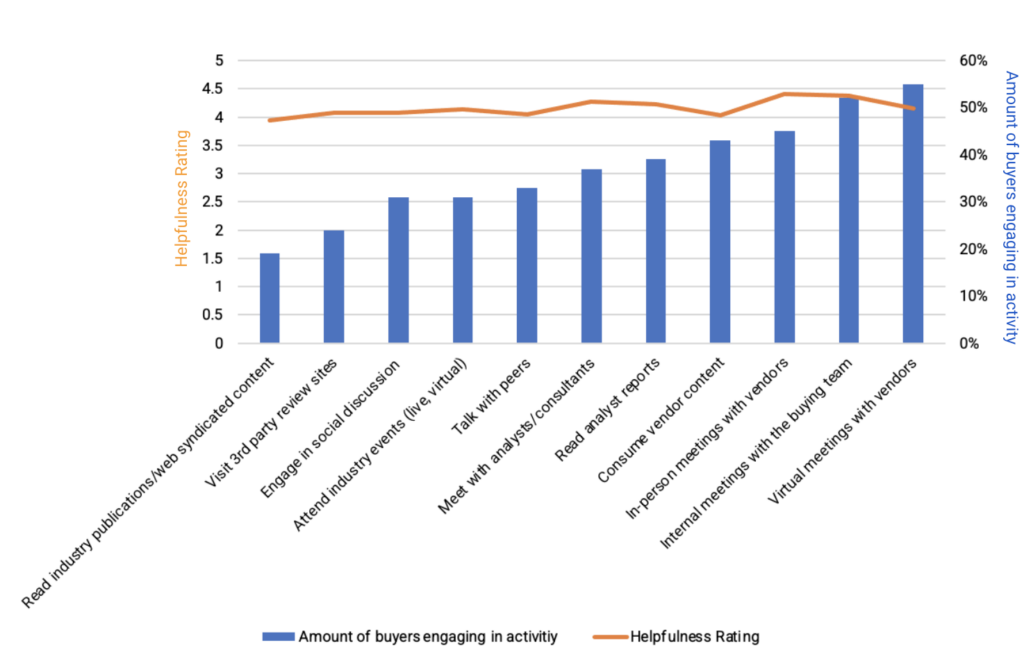
Interestingly, buyers express broad satisfaction, on a 1 to 5 scale, with the helpfulness of the information received throughout the buying journey. The orange line below shows the helpfulness score, while the blue bars represent the percentage of buyers who engage with a specific activity.
Our findings indicate that the choice of interaction types appears to be guided more by what sellers make available, and by personal preferences.
This highlights the importance of an omni-channel approach — particularly during the Dark Funnel research phase — to maximize your odds of influencing deals by providing buyers what they want to know, how they want to consume it.
The Deep Dive
Read Time: 4,184 words; About 21 minutes
In our 2023 B2B Buyer Experience Report, we dove into the entirety of the B2B buying process as reported by real B2B buyers themselves. Through the experiences of over 900 buyers, we found that
- Buyers first make contact with sellers 70% of the way through the buying cycle.
- 78% have their requirements for the purchase completely or nearly set upon contacting vendors.
- Buyers initiate contact 83% of the time, and the vendor they reach out to first wins the deal 84% of the time.
At the heart of these revelations lies a clear demonstration that the buyer is in control of the purchase process. The majority (70%) of the entire buying cycle is spent researching independently, developing a comprehensive understanding of their requirements, and not only creating a vendor shortlist, but ultimately choosing the winning vendor before they even begin to engage sellers.
The modern buyer is on their own journey. Yet, sellers don’t need to remain in the dark.
Buyer intent data offers today’s marketers and sellers more access into buyers’ pre-purchase activities than ever before. But our prior research shows that leads and MQLs, which typically occur 70% of the way through the buyer’s journey, are still among the most widely used methods for detecting and understanding buyer behavior.
In this report, we’ll dive into the various activities that buyers report engaging in across their journeys, and assess what they report liking and finding useful in their decision-making processes.
Buying Process Activities
To understand the types of activities buyers are engaging in throughout the purchase journey, we asked buyers about their general buying cycle activities and those specific to their interactions with the winning vendor.
General Buying Activities
| Survey question: Which of the following activities did you participate in as a part of the purchase process? |
| Virtual meetings with vendors |
| Consuming vendor content (website, webinars) |
| Reading analyst reports |
| Meeting with analysts/consultants |
| Talking with peers |
| Reading industry publications |
| Attending industry events (live, virtual) |
| Internal meetings with the buying team |
| In-person meetings with vendors |
| Visit third-party review sites (e.g., Gartner, TrustRadius) |
Interactions with Winning Vendor
| Survey question: In the course of the purchase process, did you do any of the following with the winning vendor? |
| Fill in a form to view vendor content |
| Respond to sales or SDR email |
| Respond to sales or SDR call |
| Register for vendor online event (webinar or similar) |
| Attend a vendor-sponsored event (e.g., dinner) |
| Click on a vendor ad |
| See, but not click on a vendor ad |
| Engage in chat on a vendor website |
| Proactively contact a vendor company for more information |
| Meet with vendor at physical offices or other locations |
Although we lack specific timestamps for these activities, it’s reasonable to anticipate that many of them happen throughout the buying cycle. For instance, internal meetings with the buying team can confidently be expected to span the entire process. While certain digital activities like visiting third-party review sites such as Gartner or TrustRadius may be more common when buyers compile their vendor shortlists, we can’t definitively rule out their occurrence in other stages. In contrast, we can confidently assert that activities involving direct interactions with vendors occur only after buyers have initiated contact, which, as previously discussed, typically takes place around the 70% mark of the purchase journey.
Nature of Interactions
To facilitate the categorization of these activities for analytical purposes, we have placed activities that may extend throughout the entire buyer’s journey into a “full-cycle” category and activities involving direct contact with vendors (which we can confidently say occur after the 70% mark in a buyer’s journey) into a “post-first contact” category.
In the tables below, we have separated the general buying activities and interactions with winning vendors into full-cycle and post-first contact categories. Additionally, within these tables, we specify whether the activity was self-directed and fully “digital” or instead involved another person, in which case it was categorized as “human-mediated.”
General Buying Activities
| FULL CYCLE or POST 70% | SURVEY QUESTION: Which of the following activities did you participate in as a part of the purchase process? | HUMAN or DIGITAL |
| FULL CYCLE | Internal meetings with the buying team | HUMAN-MEDIATED |
| Consuming vendor content (website, webinars) | DIGITAL | |
| Reading analyst reports | DIGITAL | |
| Meeting with analysts/consultants | HUMAN-MEDIATED | |
| Talking with peers | HUMAN | |
| Reading industry publications | DIGITAL | |
| Visit third-party review sites (e.g., gartner, TrustRadius) | DIGITAL | |
| Attending industry events (live, virtual) | HUMAN-MEDIATED | |
| POST-FIRST CONTACT (70%) | Virtual meetings with vendors | HUMAN-MEDIATED |
| In-person meetings with vendors | HUMAN-MEDIATED |
Interactions with Winning Vendor
| FULL CYCLE or POST 70% | Survey question: In the course of the purchase process, did you do any of the following with the winning vendor? | HUMAN or DIGITAL |
| FULL CYCLE | Fill in a form to view vendor content | DIGITAL |
| Click on a vendor ad | DIGITAL | |
| See, but not click on a vendor ad | DIGITAL | |
| Engage in chat on a vendor website | HUMAN-MEDIATED | |
| POST FIRST CONTACT (70%) | Register for vendor online event (webinar or similar) | DIGITAL |
| Attend a vendor-sponsored event (e.g., dinner) | HUMAN-MEDIATED | |
| Respond to sales or SDR email | HUMAN-MEDIATED | |
| Respond to sales or SDR call | HUMAN-MEDIATED | |
| Proactively contact a vendor company for more information | HUMAN-MEDIATED | |
| Meet with vendor at physical offices or other locations | HUMAN-MEDIATED |
A Look at the Statistics
Source: 6sense
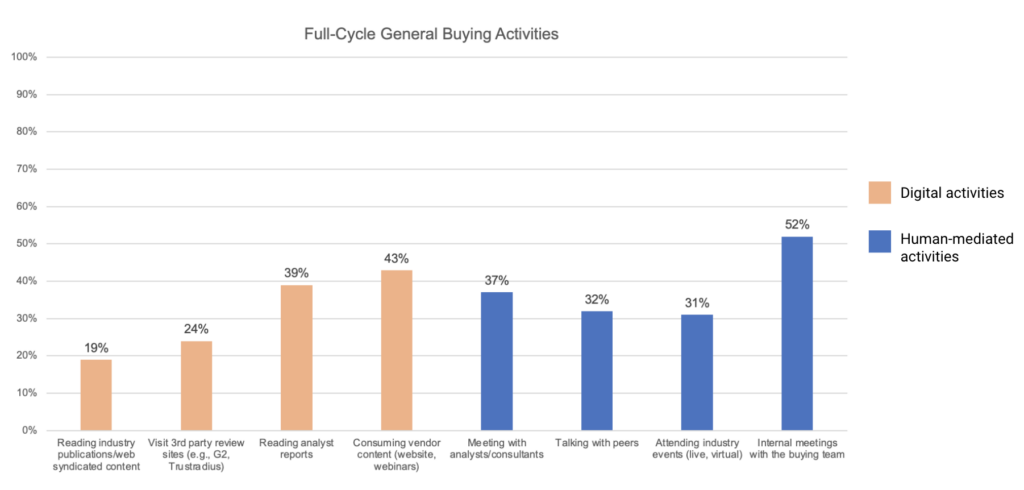
Note: These percentages represent the proportion of our sample that reported engaging in a selected activity. For example, 52% of respondents said that they engaged in internal meetings with the buying team.
Of all full-cycle general buying activities, the most utilized are:
- The internal meeting with one’s buying team (52%)
- Consuming vendor content (43%)
- Reading analyst reports (39%)
This aligns with what we’d expect as buyers work to understand their organization’s needs and what is available to them in the marketplace.
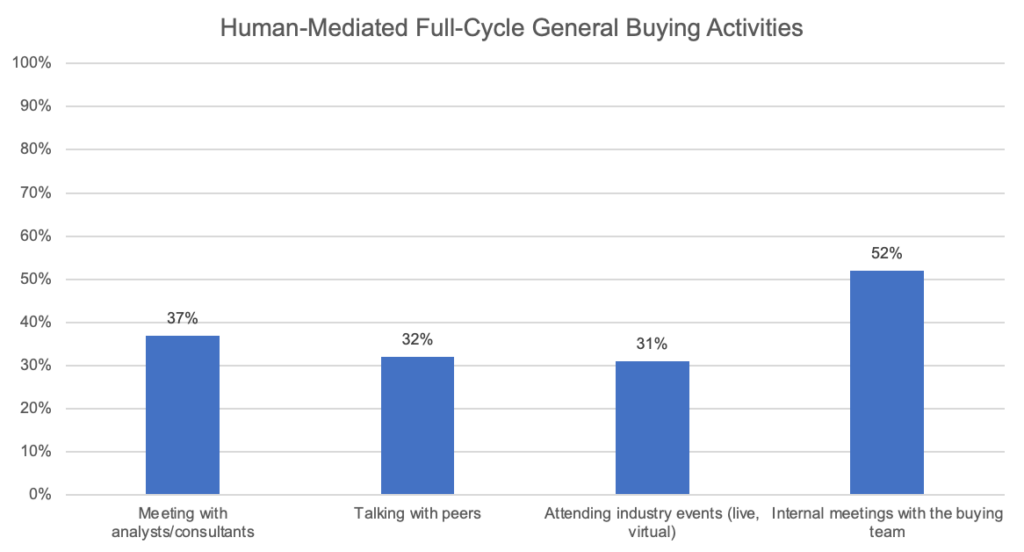
Among the activities shown above, internal meetings with the buying team are statistically the most common human-mediated activity buyers engage in. This suggests that B2B buyers are more likely to engage in internal meetings with their buying team (52%) than meet with analysts and/or consultants (37%), speak with peers (32%), or attend industry events (31%).
As discussed in our 2023 B2B Buyer Experience Report, organizations appear to either use outside resources or not, irrespective of which type of outside resource. Surprisingly, neither a solution’s perceived importance, nor a buyer’s company size, influenced whether an organization used outside resources either. Some organizations simply appear to be more likely to use outside resources than others, for reasons not captured in our survey. Among those that used outside resources, there were no meaningful differences in whether organizations relied on consultants, analysts, or both.
However, among organizations that do use outside resources, there are notable differences in how buying teams execute buying processes. Buying teams that tend to use outside resources also tend to evaluate more vendors, purchase more expensive solutions, and have buying processes that are two-times longer than those that don’t use outside resources.
While not all buying organizations engage with outside resources, they’re more likely to do so than they are to simply speak with peers (32%) or to attend industry events (31%). Among these two less common activities, B2B buyers are equally inclined to engage in discussions with peers as they are to attend industry events, statistically speaking. However, compared to the other full-cycle, human-mediated activities, both of these options stand as the least common activities buyers engage in.
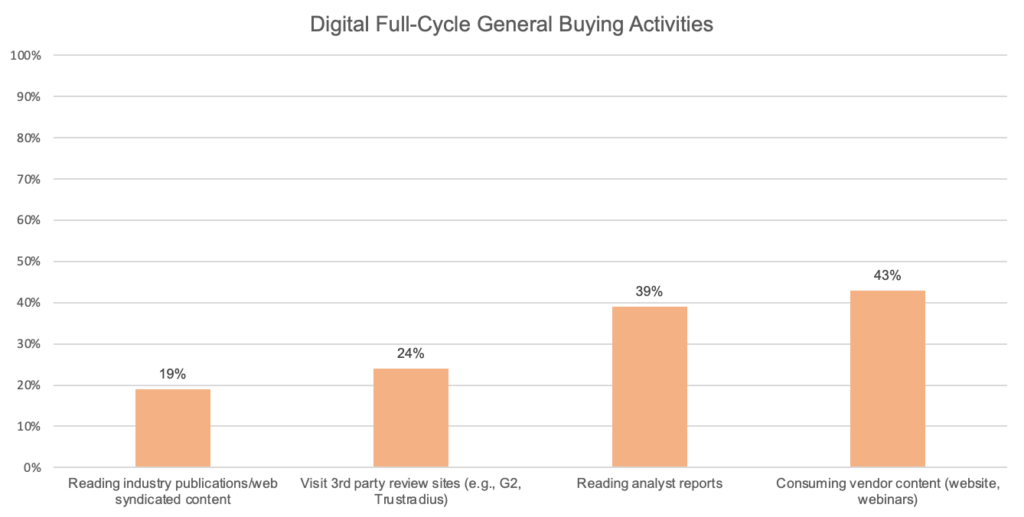
Among the activities shown above, each is statistically different from one another. Buyers consume vendor content (e.g., website, webinars) more (43%) than they read analyst reports (39%) and the latter is statistically more common than using 3rd-party review sites (24%). Reading industry publications/web syndicated content is the least-used (19%) activity of all the digital full-cycle activities.
Source: 6sense
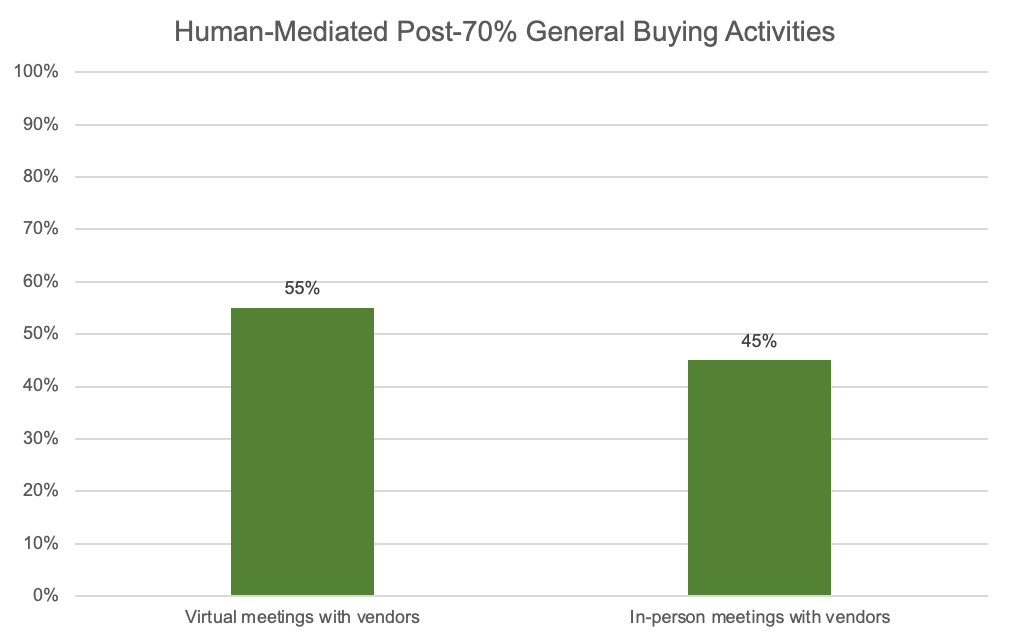
Note: These percentages represent the proportion of our sample that reported engaging in a selected activity. For example, 55% of respondents said that they engaged in virtual meetings with vendors.
Even after the pandemic, virtual meetings have remained popular. More than half (55%) of respondents engaged in virtual meetings with vendors, while just under half (45%) reported participating in in-person meetings with vendors. This difference is statistically reliable, signifying that we can confidently expect that B2B buyers at-large are more likely to participate in virtual meetings than in in-person meetings.
Interestingly, only 48% of respondents reported engaging in both virtual and in-person meetings with vendors, leaving 52% of buyers that have made a complete shift towards fully virtual prospect-to-client meetings. Moreover, among those who have embraced this shift to fully virtual prospect-to-client interactions, 66% reported that they didn’t attend industry events, either. This strongly suggests that the pandemic-era practice of buying fully virtually has become standard operating procedure for many B2B buyers.
Satisfaction With General Buying Activities
To assess how satisfied buyers are with the general buying activities they engage in throughout the buying process, we asked them to rate how useful they were toward their purchase on a 5-point scale from “not at all useful” to “extremely useful.” All interactions we asked about were rated above a 3, suggesting that buyers found all the general buying activities at least moderately helpful.
How Buyers Rate the Usefulness of Activities

Source: 6sense
Note: In the chart above, there are two vertical axes. The right axis corresponds to the bars, indicating the percentage of respondents that engaged in each activity. The axis to the left corresponds to the orange line, which indicates the respondents’ rating of how useful the interaction type was.
There is a positive relationship between usage and satisfaction for most of the general buying activities. Although buyers’ ratings of helpfulness vary across activities, these differences do not reach statistical reliability. This means that the variations we observed in buyer ratings of helpfulness are not large enough or consistent enough for us to conclude that they are reliably different.
Buyers’ helpfulness ratings were not reliably impacted by their seniority within their organization, department, industry, responsibility/role in the purchase (ultimate decision maker, influencer, champion, etc.), their company’s funding (venture-capital, public, etc.), the type of solution they were shopping for (technology, services, etc.), nor the type of capability of the sought solution (new or existing capabilities).
We might conclude simply that all activities we asked about are helpful to a degree to some buyers, and that individuals vary substantially in how they might perceive the same buying activities for reasons that are not captured in our survey.
Buying Activities With Winning Vendor
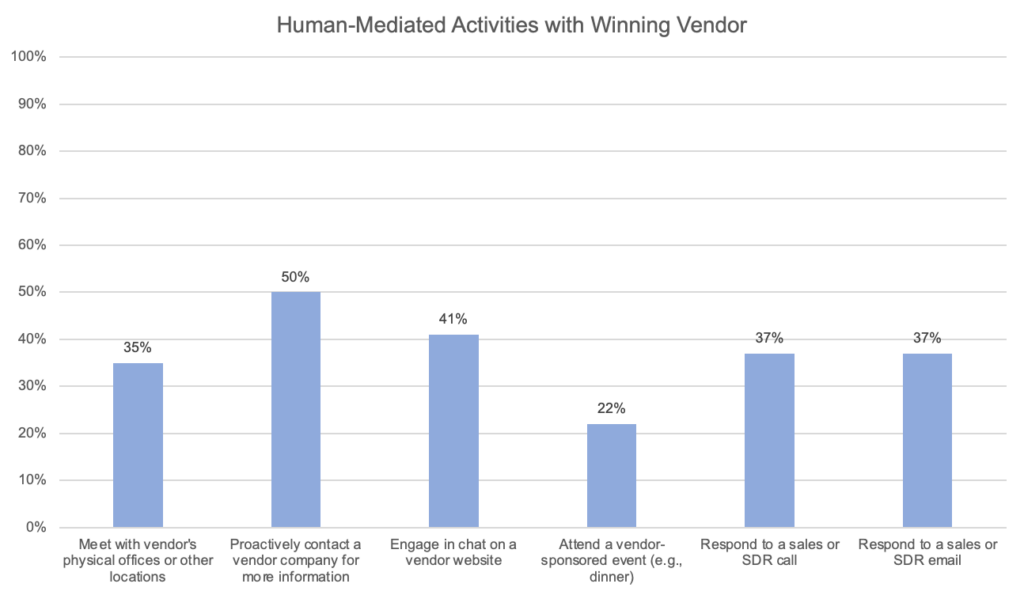
Among the activities shown above, proactively contacting a vendor for information is the most widely embraced (50%) activity by B2B buyers when engaging with their chosen vendor. This pattern is statistically reliable, indicating that this behavior extends beyond the sample of buyers we surveyed and likely reflects a broader trend among B2B buyers. This finding supports the idea that buyers decide when they will engage with sellers and do so on their own terms.
Meeting with a vendor at their physical offices or other locations is statistically more common (35%) than attending vendor-sponsored events (22%). This finding suggests that buyers prioritize face-to-face interactions with vendors in a personalized setting over attending larger events. However, it is worth noting that engaging in chat on a vendor’s website is statistically more common (41%) than meeting at a vendor’s physical office (35%), underscoring the convenience and popularity of virtual communication channels.
As one would expect, responding to Sales or SDR (Sales Development Representative) emails (37%) and calls (37%) are also more common than attending vendor-sponsored events (22%), indicating that email and phone-based communication still plays an important role in the buying process.
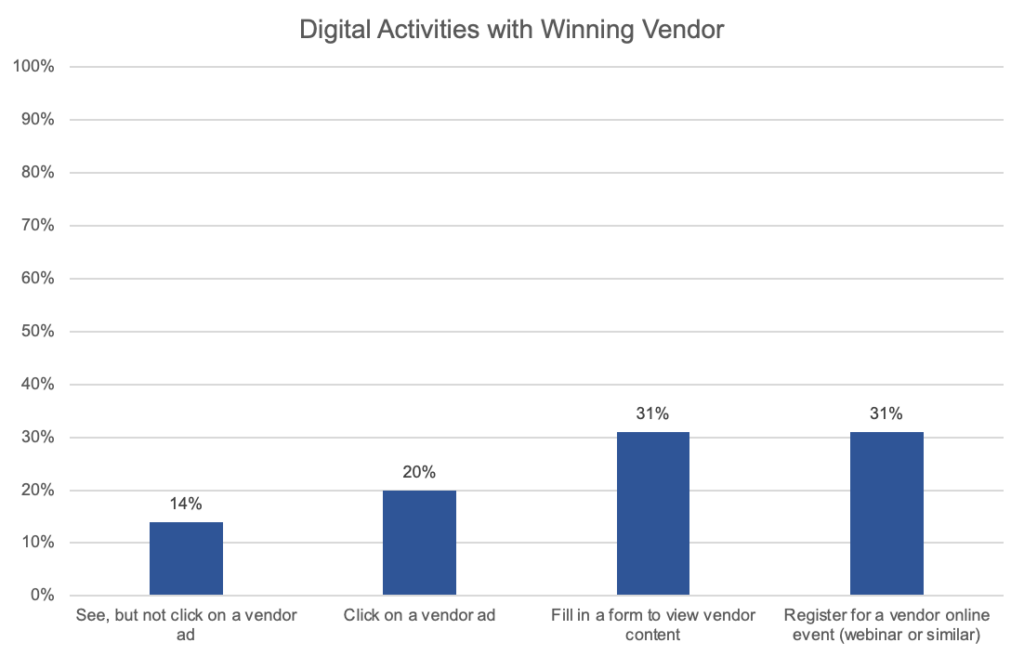
Among the activities shown above, filling in a form to view vendor content (31%) and registering for a vendor online event (31%) emerge as the most common digital interactions that buyers have with their chosen vendors. And, buyers are equally likely to engage in either activity.
While both activities are the most commonly reported by buyers compared to the other digital activities displayed above, it should be considered that the number of buyers engaging in them is still relatively low, accounting for only 31% of buyers. This means that nearly 70% of buyers do not take these actions even with their preferred vendors. This highlights the necessity for sellers to rely on a broader range of buying signals beyond these specific interactions.
In contrast, clicking on a vendor ad is less common than both filling in a form and registering for a vendor’s online event. Nevertheless, among buyers, it is more common than simply seeing a vendor ad without clicking on it. Merely seeing a vendor ad without clicking on it emerges as the least common activity among all the digital interactions with a buyer’s chosen vendor, indicating that they’re more likely to engage with the ad than not.
Behavior Is Relatively Consistent
In our exploration of B2B buyer behavior, we hypothesized that buying practices would vary based on factors such as …
- The buyer’s industry
- How their company is funded
- Whether the purchase was for new or existing capabilities
- One’s role in the purchase
- And the like (for a description of the factors we considered, please refer to the table below).
| Factor | Description |
| Respondent Industry – Does the way buyers evaluate potential vendors differ across industries? | Business Services, Construction, Education, Energy/Oil & Gas, Financial Services, Healthcare, Information Technology, Leisure and Entertainment, Manufacturing, Real Estate, Retail, Sales, Transportation Utilities, Wholesale |
| Company Funding – Does a company’s financial backing have anything to do with the way they evaluate potential vendors? | Private-Equity (PE) backed, Venture-Capital (VC) backed, Public, Privately Financed |
| Purchase Type – Do different types of purchases influence the way buyers evaluate potential suppliers? | Improve existing capabilities, New business capabilities, Renew/ Continue Existing Solution, Replace existing capabilities |
| Solution Type – Do different solutions influence the way buyers evaluate potential suppliers? | Business Services, Financial Services, Hardware or Equipment Lease, Hardware or Equipment Purchase, Healthcare Services, Individual Machinery/Heavy Equipment, Other – Please specify, Professional Services – Project-based, Professional Services – retainer or contract term, Software as a Service, Software Perpetual License |
| Company Size – Do large organizations have different practices for evaluating potential vendors than small organizations? | Measured by employee count on a 10-point scale ranging from less than 50 to more than 10K |
| Vendor Count – Do buyers’ methods of evaluating vendors change when they evaluate more or fewer of them? | The number of vendors being evaluated, measured by respondents’ estimate |
| Outside Resources – Does the way buyers evaluate vendors differ if they rely on outside resources to aid in their purchase decision? | Consultants Analysts Consultants and Analysts None |
| Purchaser Role – Does one’s role in a purchase decision affect the way they evaluate potential suppliers? | Influencer, Champion, Ultimate Decision Maker, Financial Ratifier, Purchasing/Procurement |
| Purchaser Level – Does one’s seniority within their organization influence the way they evaluate potential vendors? | Individual Contributor, Manager, Director, VP, SVP/EVP, C-Level |
| Purchase Cost – Does the cost of an intended purchase influence the way buyers evaluate potential vendors? | The annualized value of the purchase, measured on a 12-point scale ranging from $10k to over $1 million |
Surprisingly, we found that all the factors depicted above either had no influence or only minor or negligible effects on how buyers assess potential suppliers. While certain factors did exhibit statistically reliable patterns in buyer behavior, their impact was modest at most and did not substantially alter the way buyers conducted their research or engaged with the winning vendor.
In essence, the choice of interaction types seems to be guided more by what sellers make available to them and by personal preferences than the specific factors we measured.
In the charts below, you will discover the factors that, although exerting a limited influence, contributed to minor differences in engagement with general buying activities and interactions with the selected vendor.
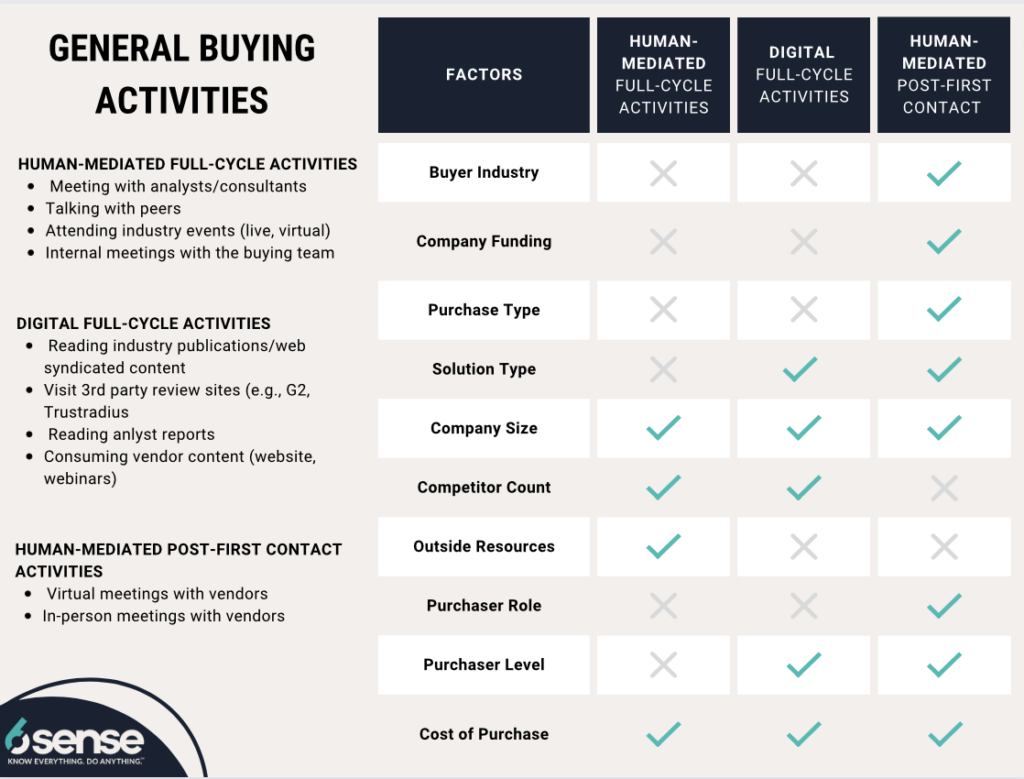
Note: In the chart above, check marks signify a statistically reliable influence on the way buyers assess potential suppliers in regards to the corresponding factor and set of purchasing activities. It’s important to note that all such impacts represent minor differences and do not represent meaningful differences in buyer behavior.
While the factors shown to make a difference in the chart above only make small impacts on the way buyers engage in the general buying activities, they’re nonetheless still interesting to note.
For instance, individuals who don’t depend on external resources such as consultants or analysts when making a purchase are more inclined to subsequently rely on and engage in discussions with their peers throughout the buying process. This is true for 41% of non-external resource buyers compared to 30% of those who utilize outside resources. This highlights the significance of social discourse — whether it occurs with hired professionals or industry peers — in the decision-making process, where ideas are exchanged and perspectives are considered. Discover some more takeaways in the table below.
| Factor | Finding |
| Buyer Industry | Those in tech are more likely to take virtual meetings with vendors (63%) than in-person meetings with vendors (41%) |
| Company Funding | Public companies are more likely to engage in virtual meetings (67%) with vendors than private companies (51%). Virtual meetings are the preferred method of communication for public companies – public companies are more likely to engage in virtual meetings with vendors (67%) than in-person meetings (45%) |
| Purchase Type | Buyers engage less in virtual meetings with vendors (31%) if they’re replacing existing capabilities versus when they are improving existing capabilities (58%) or obtaining new business capabilities (60%). If buyers are improving existing capabilities, virtual meetings with vendors are more common (58%) than in-person meetings (46%). |
| Solution Type | Those who are buying software as a service are more likely to engage in virtual meetings with vendors (67%) than those who are purchasing financial services solutions (40%). Those who are buying software as a service are more likely to engage in virtual meetings with vendors (67%) than they are to engage in in-person meetings with vendors (43%). Those purchasing hardware or equipment purchases are more likely (52%) to consume vendor content (website, webinars) than they are to read analyst reports (29%) or industry publications (19%) |
| Company Size | Large organizations are more likely to consume vendor content (48%) and read analyst reports (37%) than visit third-party review sites (15%). Small organizations are more likely to consume vendor content (43%) than read analyst reports (14%), read industry publications (14%), or visit third-party review sites (14%). |
| Vendor Count | Organizations that tend to evaluate a large number of potential suppliers are more likely to utilize third-party review sites (63%) than they are to read industry publications (44%). |
| Outside Resources | Buyers who do not engage outside resources are more likely to rely on/talk with their peers (41%) compared to those who do utilize outside resources (analysts, consultants, etc.) (30%). Those who utilize outside resources are more likely to attend industry events (35%) than those who are not utilizing outside resources (16%). |
| Purchaser Role | Purchasing/procurement are more likely to take virtual meetings (60%) than they are in-person meetings (47%) |
| Purchaser Level | SVP/EVPs and C-level buyers are more likely to take virtual meetings with vendors (74% and 67% respectively) than they are to take in-person meetings with vendors (34% and 51% respectively). |
| Cost of Purchase | Buyers making purchases over a million dollars in value tend to rely on analyst reports (57%) more than 3rd party review sites (19%). |
Source: 6sense
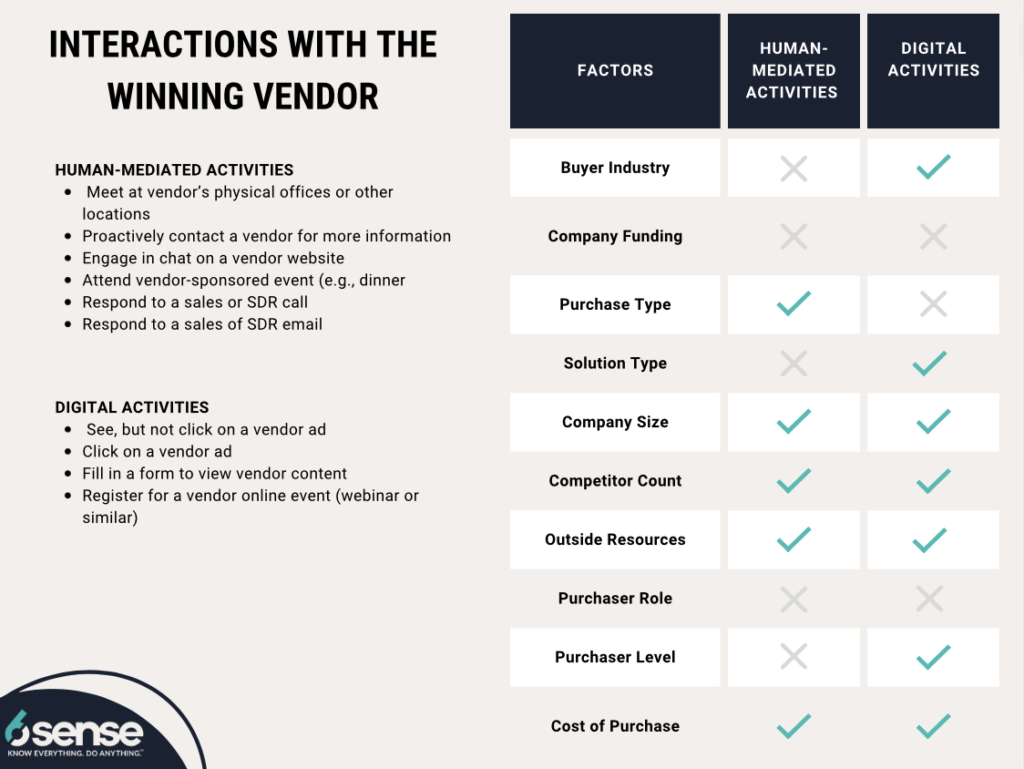
Note: In the chart above, check marks signify a statistically reliable influence on the way buyers assess potential suppliers in regards to the corresponding factor and set of purchasing activities. It’s important to note that all such impacts represent minor differences and do not substantially alter buyer behavior.
As with the case of the general buying activities, the factors we have highlighted in the chart above continue to exert a minor influence on how buyers interact with their chosen vendor. To explore the types of patterns these factors generate in the interactions buyers have with their selected supplier, please consult the table below.
| Factor | Finding |
| Buyer Industry | Those in Business Services and Manufacturing are more likely to proactively contact a potential vendor for more information (52% and 58% respectively) than to attend a vendor-sponsored event (26% and 16% respectively). |
| Purchase Type | Buyers who are improving existing capabilities are more likely to meet at a vendor’s office (36%), respond to a Sales/SDR call (38%), and engage in chat on a vendor’s website (43%) than attend a vendor-sponsored event (22%) |
| Solution Type | Buyers purchasing software as a service are more likely to fill in a form on a vendor’s website (36%) than click on a vendor’s ad (19%). Registering for vendors’ online events are more popular among those purchasing business services solutions (42%) than those purchasing hardware equipment purchases (20%). Buyers purchasing software as a service are more likely to register for an online event (32%) than view vendor ads (12%) |
| Company Size | Buyers from large organizations are more likely to individually meet potential suppliers at their offices or other physical locations (50%) than to attend a vendor sponsored event (e.g., dinner event) (22%). |
| Vendor Count | Organizations that tend to evaluate a large number of potential suppliers are more likely to proactively contact a potential supplier for more information (56%) than they are to respond to an SDR email (44%). |
| Outside Resources | Buyers are more likely to respond to sales/SDR emails (40%) and calls (41%) if they are utilizing outside resources than those who do not utilize outside resources (among those who don’t utilize outside resources 25% respond to sales/SDR emails and 22% respond to sales/SDR calls). Buyers who are utilizing outside resources are more likely to engage in chat on a vendors’ websites (47%) than those who are not utilizing outside resources (20%). Buyers who utilize outside resources (analysts, consultants, etc.) are more likely to register for a vendor online event (36%) than those who do not rely on outside resources (14%). Buyers who utilize outside resources are more likely to fill in a form on a vendor’s website (35%) than those who do not rely on outside resources (20%). |
| Purchaser Level | Buyers in entry-level positions are more likely to engage in chat on a vendor website (35%) than respond to an SDR call (11%) |
| Cost of Purchase | Buyers making purchases over a million dollars in value tend to meet with potential vendors at their offices or other physical locations (62%) more than engage in chat on a vendor’s website (24%). |
Source: 6sense
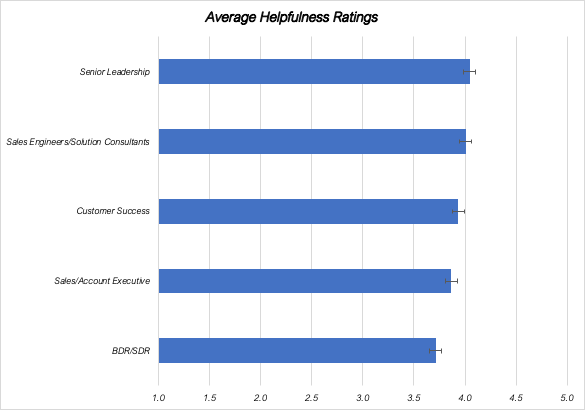
Person-Help Preferences
In addition to asking buyers about the activities they engaged in throughout the purchase process, we asked them to tell us how helpful five key selling team roles were. Those roles are given with their helpfulness ratings in the chart below from “not at all useful” to “extremely useful.”
Here, the analysis of variance did find statistically reliable differences between several of the roles. BDR/SDRs were found to be meaningfully less helpful from every other role. Senior leadership and sales engineer/solution consultants scored the highest, but these differences were only meaningfully different from the scores Sales AEs and BDRs received. In sum, buyers find provider representatives to be useful to their buying processes, but not, perhaps, as useful as they could be. Not surprisingly, buyers find interactions with more senior and more technically-oriented seller personnel most useful.
Implications
Today’s B2B buyers undeniably wield significant control over the purchase process, a fact reinforced by our 2023 B2B Buyer Experience Report. A substantial 70% of the entire buying cycle is dedicated to independent research, meticulous requirement assessment, vendor short-list creation, and, remarkably, the choice of a winning vendor — and all of this before direct seller engagement begins 84% of the time.
However, as revealed in this report, the buyer’s journey is multifaceted, encompassing various activities and interactions. From general buying activities to their interactions with selected vendors, buyers participate in a diverse array of interactions. Notably, across all types of buying activities, the most common interactions involve person-to-person engagements. And yet, the medium for these interactions varies, with many interactions, such as virtual meetings and web chats, being digital.
Furthermore, one of the central insights from our research refutes our original hypothesis about the buyer’s journey. We had hypothesized that factors such as industry, company funding, purchase type, a contact’s level in the organization, and their role in the buying process would drive different buying behaviors. However, our findings indicate that even when these variables lead to statistically reliable differences in buyer behavior, they do not exert a meaningful impact on the types of interactions chosen or preferred by buyers. In essence, the choice of interaction types appears to be guided more by what sellers make available and by personal preferences.
It is our hope that this report provides sellers with valuable insights into the activities and interactions that B2B buyers engage in throughout their purchase journeys. By aligning marketing and sales strategies with these insights, organizations can better support buyers and enhance their prospects of succeeding in today’s fiercely competitive B2B landscape.
Appendix
Read Time: 1,462 words; About 7 minutes
| Finding | Statistical Test | Statistic | Significance Level | Effect Size | Sample Size |
| Buyers first make contact with sellers 70% of the way through the buying cycle. | Frequency | n/a | n/a | n/a | 934 |
| 78% have their requirements for the purchase completely or nearly set upon contacting vendors. | Frequency | n/a | n/a | n/a | 926 |
| The first vendor that buyers contact wins the deal 84% of the time. | Frequency | n/a | n/a | n/a | 931 |
| Of all full-cycle general buying activities, the most used is the internal meeting with one’s buying team (52%). | Repeated Measures ANOVA | F=40.039 | p<.001 | n2=.041 | 940 |
| Buyers consume vendor content (e.g., website, webinars) more (43%) than they read analyst reports (39%). | Repeated Measures ANOVA | F=67.202 | p<.001 | n2=.067 | 940 |
| More than half (55%) of the respondents indicated their engagement in virtual meetings with vendors, while just under half (45%) reported participating in in-person meetings with vendors. | Repeated Measures ANOVA | F=21.009 | p<.001 | n2=.022 | 940 |
| Only 48% of respondents reported engaging in both virtual and in-person meetings with vendors, leaving 52% of buyers that have made a complete shift towards fully virtual prospect-to-client meetings. | Frequency | n/a | n/a | n/a | 940 |
| Proactively contacting a vendor for information is the most widely embraced (50%) activity by B2B buyers when engaging with their chosen vendor. | Repeated Measures ANOVA | F=35.486 | p<.001 | n2=.036 | 940 |
| Meeting with a vendor at their physical offices or other locations is statistically more common (35%) than attending vendor-sponsored events (22%). | Repeated Measures ANOVA | F=35.486 | p<.001 | n2=.036 | 940 |
| Responding to Sales or SDR (Sales Development Representative) emails (37%) and calls (37%) are also more common than attending vendor-sponsored events (22%). | Repeated Measures ANOVA | F=35.486 | p<.001 | n2=.036 | 940 |
| Filling in a form to view vendor content (31%) and registering for a vendor’s online event (31%) emerge as the most common digital interactions that buyers have with their chosen vendors. | Repeated Measures ANOVA | F=45.816 | p<.001 | n2=.047 | 940 |
| Merely seeing a vendor’s ad without clicking on it emerges as the least common activity among all the digital interactions with a buyer’s chosen vendor. | Repeated Measures ANOVA | F=45.816 | p<.001 | n2=.047 | 940 |
| Those who don’t depend on external resources such as consultants or analysts when making a purchase are more inclined to subsequently rely on and engage in discussions with their peers (41%) than those who use outside resources (30%). | Repeated Measures ANOVA | F=13.66 | p<.001 | n2=.004 | 940 |
| Those who use outside resources are more likely to attend industry events (35%) than those who are not using outside resources (16%). | Repeated Measures ANOVA | F=13.66 | p<.001 | n2=.004 | 940 |
| Buyers engage less in virtual meetings with vendors (31%) if they’re replacing existing capabilities versus when they are improving existing capabilities (58%) or obtaining new business capabilities (60%). | Repeated Measures ANOVA | F=7.824 | p<.001 | n2=.013 | 934 |
| If buyers are improving existing capabilities, virtual meetings with vendors are more common (58%) than in-person meetings (46%). | Repeated Measures ANOVA | F=7.824 | p<.001 | n2=.013 | 934 |
| Those who are buying software as a service are more likely to engage in virtual meetings with vendors (67%) than those who are purchasing financial services solutions (40%). | Repeated Measures ANOVA | F=2.102 | p=.022 | n2=0.012 | 934 |
| Those who are buying software as a service are more likely to engage in virtual meetings with vendors (67%) than they are to engage in in-person meetings with vendors (43%). | Repeated Measures ANOVA | F=2.102 | p=.022 | n2=0.012 | 934 |
| Those purchasing hardware or equipment purchases are more likely (52%) to consume vendor content (website, webinars) than they are to read analyst reports (29%) or industry publications (19%). | Repeated Measures ANOVA | F=2.354 | p=.01 | n2=.008 | 934 |
| Purchasing/procurement roles are more likely to take virtual meetings (60%) than they are in-person meetings (47%). | Repeated Measures ANOVA | F=4.423 | p=.002 | n2=.01 | 934 |
| SVP/EVPs and C-level buyers are more likely to take virtual meetings with vendors (74% and 67% respectively) than they are to take in-person meetings with vendors (34% and 51% respectively). | Repeated Measures ANOVA | F=9.239 | p<.001 | n2=.015 | 936 |
| Public companies are more likely to engage in virtual meetings (67%) with vendors than private companies (51%). | Repeated Measures ANOVA | F=3.512 | p=0.015 | n2=.006 | 936 |
| Those in the tech industry are more likely to take virtual meetings with vendors (63%) than in-person meetings with vendors (41%). | Repeated Measures ANOVA | F=2.151 | p=.05 | n2=.006 | 936 |
| Those in Business Services and Manufacturing are more likely to proactively contact a potential vendor for more information (52% and 58% respectively) than to attend a vendor-sponsored event (26% and 16% respectively). | Repeated Measures ANOVA | F=7.126 | p<.001 | n2=.013 | 934 |
| Buyers are more likely to respond to sales/SDR emails (40%) and calls (41%) if they are using outside resources than those who do not use outside resources (among those who don’t use outside resources, 25% respond to sales/SDR emails and 22% respond to sales/SDR calls). | Repeated Measures ANOVA | F=26.08 | p<.001 | n2=.015 | 934 |
| Buyers who are improving existing capabilities are more likely to meet at a vendor’s office (36%), respond to a Sales/SDR call (38%), and engage in chat on a vendor’s website (43%) than attend a vendor-sponsored event (22%). | Repeated Measures ANOVA | F=4.089 | p=.007 | n2=.003 | 934 |
| Those purchasing software as a service are more likely to fill out a form on a vendor’s website (36%) than click on a vendor’s ad (19%). | Repeated Measures ANOVA | F=3.201 | p<.001 | n2=.012 | 934 |
| Registering for vendors’ online events are more popular among those purchasing business services solutions (42%) than those purchasing hardware equipment purchases (20%). | Repeated Measures ANOVA | F=3.201 | p<.001 | n2=.012 | 934 |
| Those purchasing software as a service are more likely to register for an online event (32%) than view vendor ads (12%). | Repeated Measures ANOVA | F=3.201 | p<.001 | n2=.012 | 934 |
| Buyers who are using outside resources are more likely to engage in chat on a vendor’s websites (47%) than those who are not using outside resources (20%). | Repeated Measures ANOVA | F=56.785 | p<.001 | n2=.011 | 934 |
| Those who use outside resources (analysts, consultants, etc.) are more likely to register for a vendor’s online event (36%) than those who do not rely on outside resources (14%). | Repeated Measures ANOVA | F=40.352 | p<.001 | n2=.014 | 940 |
| Those who use outside resources are more likely to fill in a form on a vendor’s website (35%) than those who don’t rely on outside resources (20%). | Repeated Measures ANOVA | F=40.352 | p<.001 | n2=.014 | 940 |
| BDR/SDRs were found to be meaningfully less helpful from every other role. Senior leadership and sales engineer/solution consultants scored the highest. | Repeated Measures anova | F=22.113 | p<.001 | n2=0.026 | 940 |
| Large organizations are more likely to consume vendor content (48%) and read analyst reports (37%) than to visit 3rd-party review sites (15%). | Repeated Measures anova | F=1.999 | p=.037 | n2=0.006 | 933 |
| Small organizations are more likely to consume vendor content (43%) than read analyst reports (14%), read industry publications (14%), or visit 3rd-party review sites (14%). | Repeated Measures anova | F=1.999 | p=.037 | n2=0.006 | 933 |
| Buyers making purchases over a million dollars in value tend to rely on analyst reports (57%) more than 3rd-party review sites (19%). | Repeated Measures anova | F=2.158 | p=.01 | n2=0.009 | 940 |
| Buyers from large organizations are more likely to meet potential suppliers individually at their offices or other physical locations (50%) than to attend a vendor-sponsored event (e.g., dinner event) (22%). | Repeated Measures anova | F=2.396 | p=.01 | n2=0.004 | 936 |
| Organizations that tend to evaluate a large number of potential suppliers are more likely to proactively contact a potential supplier for more information (56%) than they are to respond to an SDR email (44%). | Repeated Measures anova | F=6.089 | p<.001 | n2=.01 | 934 |
| Buyers in entry-level positions are more likely to engage in a chat on a vendor’s website (35%) than respond to an SDR call (11%) | Repeated Measures anova | F=2.513 | p=.05 | n2=.002 | 936 |
| Buyers making purchases over a million dollars in value tend to meet with potential vendors at their offices or other physical locations (62%) more than engage in a chat on a vendor’s website (24%). | Repeated Measures anova | F=5.272 | p<.001 | n2=.014 | 940 |