
• Introduction, about 1 minute
• The Deep Dive, about 13 minutes
• Appendix, about 5 minutes
Introduction
Reading Time: 139 words, about 1 minute
Not all purchases are the same. Our recent look at the B2B buyer experience revealed the differences that occur across these different types of purchases:
- New capabilities
- Upgrading existing capabilities
- Renewing existing solutions
- Replacing existing capabilities
Our research revealed that the purchase of new capabilities differed from the three other categories in the following ways:
- New capability purchases were larger, ranging from $301,000 to $400,000 compared to renewals which sat between $201,000 to $300,000.
- New capability purchases featured more vendors under consideration than other purchase types.
- Buying groups were larger by 1.4 people on average.
- Buying cycles for new business average two months longer than improving existing capability purchases, and more than three months longer than the other two types.
- Renewal purchases vary in their length, cost, and complexity substantially more than other purchase types
Read on for more insights about how purchase types influence a number of factors.
The Deep Dive
Reading Time: 2,596 words, about 13 minutes
Abstract/Summary
In this research, we examined how different types of purchases differ (e.g., purchases to acquire new business capabilities, renewals, replacements, or improvements). We considered various dimensions, including purchase cost, the number of vendors evaluated, buying group size, the number of interactions per person, and buying cycle length. This insight is crucial for revenue teams to tailor their strategies and planning based on the specific nature of the purchase. We also found that Renewal/Continue purchases tended to vary in their characteristics more than other purchase types.
Introduction
B2B purchasing decisions are complex, and not all buying processes are the same. Logic would suggest that when companies acquire brand new business capabilities (e.g., acquiring a solution that provides AI-driven conversational email to automate prospect responses to enable effective BDR/SDR outreach for the organization), the process of deciding what to acquire would take longer than a buying process to replace or renew solutions that provide existing capabilities.
In our previous research reports on the B2B buying experience, we identified a variety of characteristics most buying processes share. We also identified several factors that meaningfully impact how large buying groups are, how long buying processes are, and when decisions are made in the course of a buying process, among much else.
In this report, we look specifically at how the type of purchase a company is making impacts buying processes.
About the purchases and buyers in our survey
- New business capabilities: The acquisition of solutions to bring a new capability to the organization. E.g.: We do not have technology to enable account-based marketing and selling, so we are evaluating providers.
- Improving existing capabilities: Enhance existing products, services, or solutions with additional features or better performance. E.g.: We are currently using an ABM platform to target ads to in-market buyers. Now we are adding conversational email to automate outreach via email.
- Renewing/continuing existing solutions: Extend the use of current products, services, or solutions without changes or enhancements. E.g.: We are happy with our current provider and the capabilities we use, so we are renewing for another two years.
- Replacing existing capabilities: Remove and replace old solutions with new ones offering improved features or performance. E.g.: We intend to continue our account-based GTM practice, but we are opening up the evaluation process to consider new vendors.
In our survey, we found that “Improve Existing Capabilities” made up more than half of the purchase types reported. “New Business Capability” purchases made up nearly a quarter. While our survey respondents were taken at random, we cannot say whether this distribution of purchase types is typical of B2B in general.
Table 1: Distribution of Purchase Types
| Purchase Type | Count | Percent |
| New business capabilities | 217 | 23.2% |
| Improve existing capabilities | 529 | 56.6% |
| Renew/ Continue Existing Solution | 87 | 9.3% |
| Replace existing capabilities | 101 | 10.8% |
Company Size and Funding type
Many factors might be expected to influence the kinds of purchases a company makes, along with their buying processes. A company’s size, maturity, financial performance and how the company is funded might all be expected to be influential.
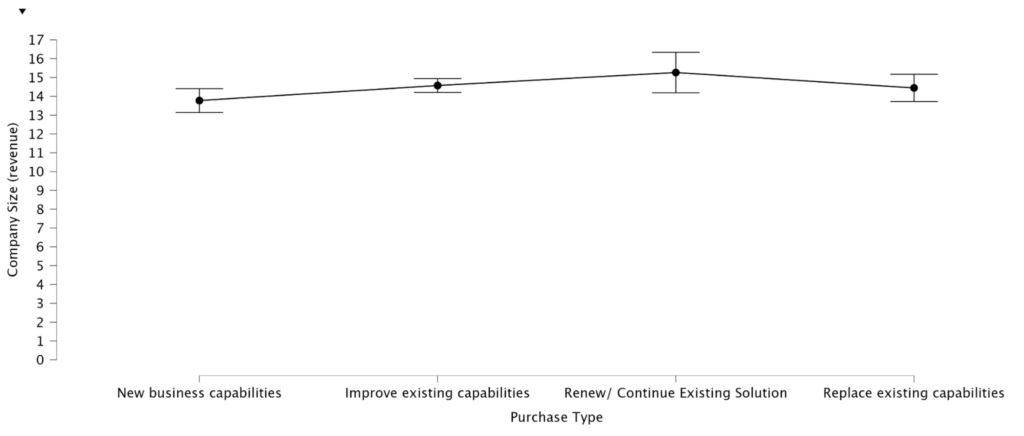
In our sample, respondents who had made a New Capability purchase were likely to be from slightly smaller companies ($51M to about $250M in revenue) than those with Renewal or continuation purchases ($251 to about $500M in revenue). This may indicate that somewhat smaller companies were more likely to have capability gaps to fill. However, the average size for New Capability purchases fell within the margin of error for both Replace Existing and Improve Existing capability purchases, suggesting some other factor, not identified in our study, may be at work here.
Chart 1: Company Size and Purchase Type
Next, we considered how a company’s funding influenced the kinds of purchases a company makes.
Table 2: Distribution of Purchase Types by Company Funding Type
| Purchase Type | ||||
| Funding Type | New business capabilities | Improve existing capabilities | Renew/ Continue Existing Solution | Replace existing capabilities |
| Private Equity (PE) | 26.83% | 53.66% | 17.07% | 2.44% |
| Venture Capital (VC) | 27.59% | 48.28% | 17.24% | 6.90% |
| Private | 20.49% | 56.91% | 8.62% | 13.98% |
| Public | 28.92% | 57.43% | 8.84% | 4.82% |
| Total | 23.23% | 56.64% | 9.32% | 10.81% |
Note: The percentage within cells represents the percent of each purchase type for companies of each funding type. For example, 26.83% of PE-backed companies in our survey made New Business Capability purchases.
Where findings for a given funding category differ from others, those differences are bolded in the chart above.
- Private companies were less likely to report a “New Business Capability” purchase than their counterparts in companies with other sources of funding.
- VC-funded companies were less likely to make purchases to improve an existing capability.
- Together with PE-backed companies, VC-backed companies were roughly twice as likely to make “Renew/Continue” purchases as were privately- and publicly-funded companies.
- Private companies were more than twice as likely as VC-backed companies to be replacing existing capabilities, and more than three times as likely to be doing so than PE-backed or public companies.
Financial Performance
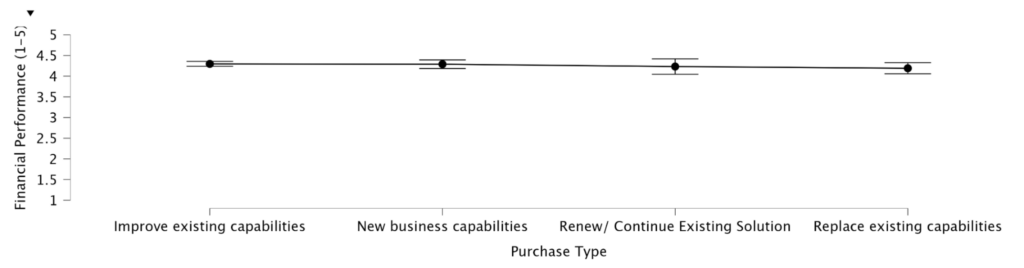
Because we asked all participants to rate their company’s financial performance over the past year, we were able to test whether there might be a relationship between a company’s financial performance and whether they are likely to be engaging in a net new purchase or instead renewing, augmenting, or replacing existing.
The data revealed nearly identical financial performance across purchase types, ruling out financial performance as an explanation for observed differences in reported purchases or associated buying processes.
Chart 2: Purchase Type and Financial Performance
What do the purchase types have in common?
The Point of First Contact
A key finding from earlier reports on the buying experience was that nearly all B2B buyers, regardless of their …
- Rank in the company
- Role in the buying process
- The size of the purchase
- Or even the type of solution (e.g., hardware, software, services, machinery)
… say they first interacted with provider representatives (had their point of first contact) about 70% of the way through their buyer journeys.
In this regard, we found no statistically reliable differences between the purchase types. However, “Renew/Continue” purchases trended toward a later point of first contact. This difference did not meet the standard of statistical reliability, but that is primarily because renewal/continuation buyers varied considerably in when they had their point of first contact. The average for “Renew/Continue” purchases was nearly six percentage points later (75%) in the process than the next closest (Improve Existing Capabilities, 69%).
Because the point of first contact for “Renewal/Continue” purchases varied so much, we cannot conclude that this finding would hold up were we to take another sample of buyers.
Chart 3: Purchase Type and Point of First Contact (POFC)
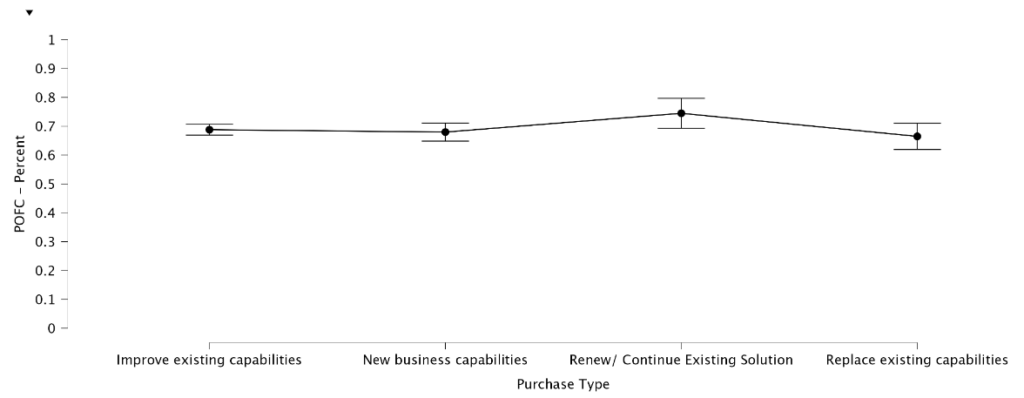
Note: The larger vertical bar indicating variability in respondent answers for “Renew/Continue” prevents a finding of statistical reliability, despite the apparently later point of first contact for this type of purchase.
Solution Importance
Given the variability in how “Renew/Continue” buyers answered, it is possible many solution renewals require substantial internal collaboration before teams engage with providers, while others require less. We tested whether “Renewal/Continue” purchases tended to be viewed as more important than others. They are not. Neither, as we shall see, are they more expensive. Once again, we observed that “Renew/Continue” buyers tended to vary substantially
Chart 4: Purchase Type And Importance of The Solution
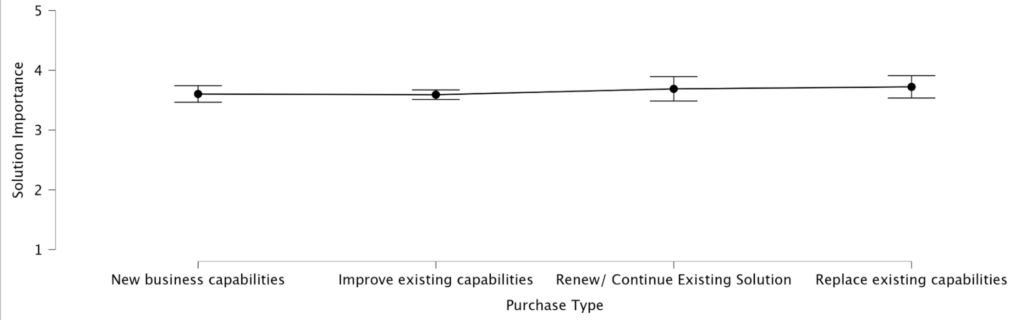
Note: Importance was ranked on a scale from 1 (Non-essential/ Nice to have) to 5 (Essential).
What is different?
So, how do the buying processes for the different purchase types differ? Building off our previous reporting on how buying cycles vary, we first examined two key drivers of buying cycle differences:
- Purchase cost, and
- The number of vendors evaluated
Both have been seen to drive substantial differences in the size of buying groups, the number of interactions each buying group member has with providers, and the length of buying cycles.
Purchase Cost
First, we tested whether there were cost differences between the purchase types. Here it may be expected that the purchase of net new business capabilities might require larger investments than for renewals, improvements or replacements, and that is what we found. The acquisition of new business capabilities was found to be more costly ($301,000 to about $400,000) than “Renew/Continue” purchases ($201,000 to about $300,000), but within the margin of error for the other types. As with our finding concerning the point of first contact, we observed considerable variability in the responses of “Renew/Continue” purchasers — substantially more variability than for any of the other purchase types.
Chart 5: Purchase Type and Purchase Cost

Vendors
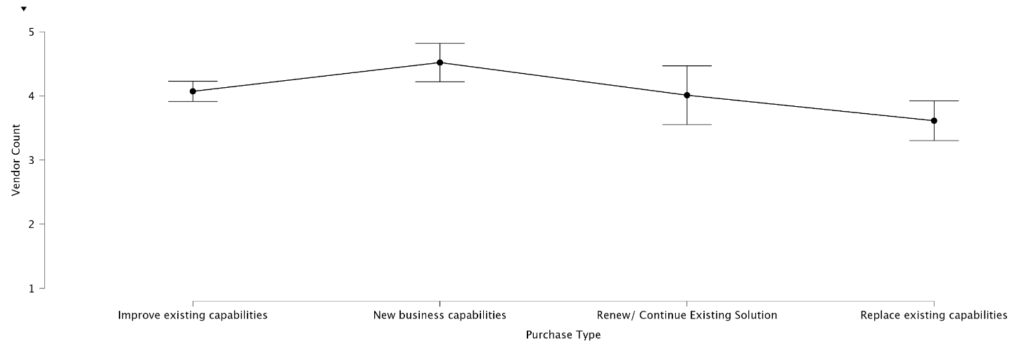
In our earlier research, we found that when buying teams have more vendors to evaluate, those buying teams tend to expand to accommodate the extra work, and each member of the buying group has to do more work during the selection process. As a result, we hypothesized that New Capability purchases would involve more vendors, as organizations do their due diligence to acquire novel capabilities.
Indeed, we found that new capability buyers evaluated more vendors than the other purchase types. The exception to this was “Renew/Continue” purchases. As we have seen twice already, “Renew/Continue” purchasers are substantially less predictable than other types of purchasers. As a result, despite “Renew/Continue” purchases involving the same number of vendors on average as Improve existing purchases, we cannot conclude that “Renew/Continue” purchases are meaningfully different from “New Capability” purchases.
Chart 6: Purchase Type and Vendors Evaluated
Buying Group Sizes
Given our previous finding that evaluating a greater number of vendors requires larger buying groups, we expected to find that buying groups for New Business Capabilities would be larger than for others. At this point, however, we also expect to find that “Renew/Continue” buyers respond unpredictably.
Both of our expectations were borne out by the data. Buying groups for new business capabilities were larger by 1.4 people on average compared to the next largest type, “Improve Existing Capabilities”, and statistically larger than all but “Renew/Continue” purchases. Once again, the inconsistency in how “Renew/Continue” buyers responded prevented a finding of statistical reliability. There was also substantial variability in how “Replace Existing” buyers responded.
Chart 7: Purchase Type and Buying Group Size
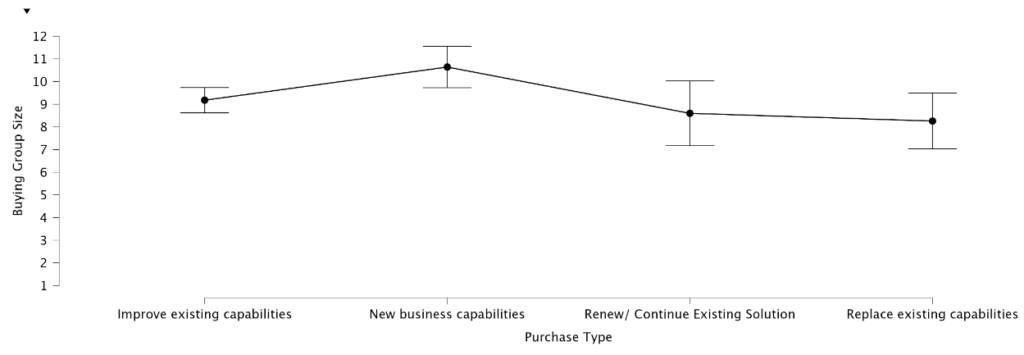
Consistent with using larger buying groups, “New Capability” purchasers were substantially more likely (82.5%) than buyers in other Purchase Types (74.1%) to use outside resources such as consultants and analysts.
Interaction Volume
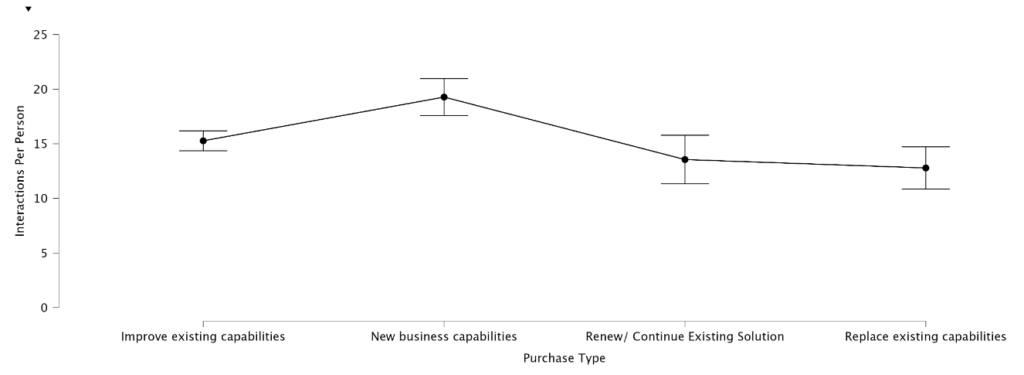
Higher cost and more vendors to evaluate also make the job of selecting a vendor more complex, increasing the number of interactions buyers require en route to deciding. We found that “New Business Capability” purchases required nearly four more interactions per person than others, making it statistically different from the other purchase types, despite “Renew/Continue” purchases once again exhibiting substantial variability.
Chart 8: Purchase Type and Interactions Per Person
Buying Cycle Length
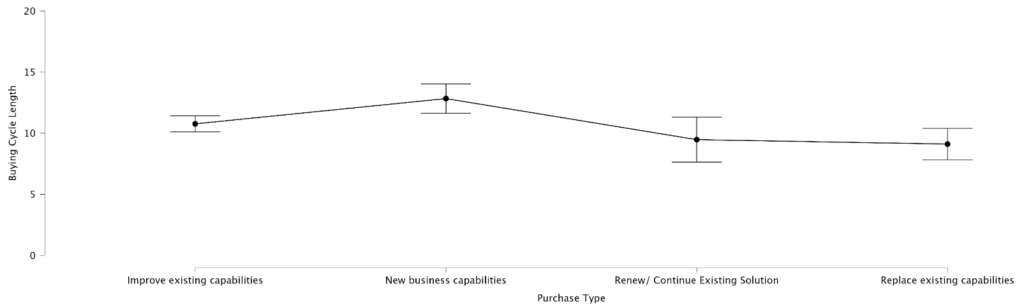
So far, we have seen that all the factors that tend to increase the length of a buying cycle would suggest that buying cycles for new business capabilities would be longer than others. That is exactly what we found. Buying cycles for new business capabilities average two months longer than “Improve Existing Capability” purchases, and more than three months longer than the other two types. And again, despite finding that “Renew/Continue” purchases vary in length more than others, “New Capability” purchases were reliably longer than all other types.
Chart 9: Purchase Type and Buying Cycle Length
Requirement Setting
Given how late in the buying process first contact with provider representatives occurred, we also wanted to know the extent to which purchase requirements changed after the point of first contact. Here, we expected that buyers that were replacing, renewing, and expanding existing solutions would have their requirements more firmly established at the point of first contact than would “New Capability” purchasers.
As Chart 10 below illustrates, on average, purchase requirements were only slightly changed after the point of first contact for all purchase types. However, contrary to expectation, requirements for “New Capability” purchases were least changed after the point of first contact. This difference was statistically reliable but relatively small.
Chart 10: Requirements Set? And Purchase Type
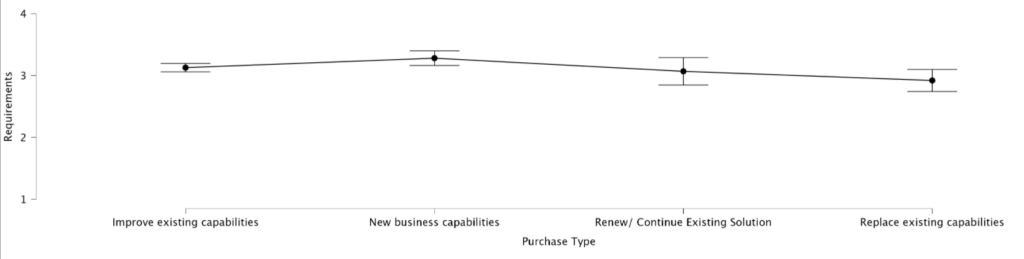
Note: Requirements were reported on a scale from 1 = Requirements changed substantially, 2 = Requirements were changed moderately, 3 = Requirements changed slightly. 4 = Requirements were set
Implications
As anticipated, “New Capability” purchases tend to differ reliably from the renew, replace, or improve purchase types across many dimensions of the purchase process. In contrast, “Renew/Continue,” “Replace,” and “Improve Capability” purchases did not reliably differ from each other. The exception to this rule is that “Renew/Continue” buyers were much less consistent in how they characterized their purchases than were other buyers.
To clarify how “New Capability” purchases differ from others, we collapsed the other three into one category (“Other purchase types”) and compared them with “New Capability” purchases. Results can be seen in the bar charts Graphic 11 below. These clearly show that “New Capability” purchases have similar points of first contact, and are more likely to be executed by slightly smaller companies.
However, “New Capability” purchases are more expensive, involve more vendors, have larger buying groups, more interactions by each member of the buying team, and are longer than other purchase types. To our surprise, however, “New Capability” purchasers are slightly more open to amending their requirements once they begin engaging directly with providers’ representatives.
Chart 11: Contrasting New Business Capability Purchase with All Other Types

While the main narrative of this research remains that purchases intended to provide New Business Capabilities are distinct in most ways from others, a distinct secondary narrative, one for which we do not currently have viable explanations, is that Renew/Continue buyers report widely disparate buying experiences. Further research will be required to better understand this.
Readers should use this report to inform planning for revenue production. Where organizations rely on a variety of purchase types to make up their revenue goals, knowing how opportunities for those revenue types are likely to perform can help make planning more accurate and inform intelligent actions to advance and close deals.
A Note on Purchase Types and the Current Economy
Because this is the first year we have conducted this research, we cannot say whether current economic conditions impact the type of purchases respondents to our survey reported. The buyers who participated in our research made their purchases within one to 24 months before completing the survey (roughly, Q2-2021 to Q2-2023). New Business Capability purchases tended to have taken place on average nine months prior to the survey collection (circa, Q4-2022), whereas the other purchase types took place, on average, seven months prior to our survey (early in Q1-2023).
Research from other sources has indicated that New Business Capability purchases are down substantially from prior periods. While the precise purchase date is not specified, Vendr’s report indicates that while 30% of 2022 SAAS purchases were for New Business Capabilities, that number is down to just 19% in 2023. We found that 23% of purchases reported in our survey were for Net New Business Capabilities, which falls midway between Vendr’s 2022 and 2023 numbers. On this surface, this appears to be consistent with Vendr’s finding.
Appendix
Reading Time: 926 words, about 5 minutes
Table 1: Quick statistical comparison of purchase types
| Purchase Type | Count | Percent | POFC | Purchase Cost | Vendor Count | Buying Group Size | Interactions Per Person | Buying Cycle Length (Months) | Requirements |
| Improve existing capabilities | 529 | 56.60% | 69% | 251k to 350k | 4.1 | 9.2 | 15.3 | 10.8 | 3.1 (Changed slightly after POFC) |
| New business capabilities | 217 | 23.20% | 68% | 300k – 400k | 4.5 | 10.6 | 19.2 | 12.8 | 3.3 (Changed slightly after POFC) |
| Renew/ Continue Existing Solution | 87 | 9.30% | 75% | 251k to 350k | 4 | 8.6 | 13.6 | 9.5 | 3.1 (Changed slightly after POFC) |
| Replace existing capabilities | 101 | 10.80% | 67% | 251k to 350k | 3.6 | 8.3 | 12.8 | 9.1 | 2.9 (Changed slightly after POFC) |
Table 2: Statistical Reporting
| Finding | Statistical Test | Statistic | Significance Level | Effect Size | Sample Size |
| Respondents who had made a New Capability purchase were likely to be from slightly smaller companies than those with Renewal or continuation purchases. | ANOVA | F = 2.8 | p = .038 | n2=.009 | 934 |
| Private companies are less likely to report a New Business Capability purchase than their counterparts in companies with other sources of funding. | Chi2 | N/A | p<.001 | x2=28.43 | 934 |
| VC-funded companies were less likely to make purchases to improve an existing capability. | Chi2 | N/A | p<.001 | x2=28.43 | 934 |
| Together with PE-backed companies, VC-backed companies are roughly twice as likely to make Renew/ Continue purchases as were Private and Publicly funded companies. | Chi2 | N/A | p<.001 | x2=28.43 | 934 |
| Private companies are more than twice as likely as VC-backed companies to be replacing existing capabilities, and more than three times as likely to be doing so than PE-backed or Public companies. | Chi2 | N/A | p<.001 | x2=28.43 | 934 |
| Buyers first make contact with sellers 70% of the way through the buying cycle. | Frequency | n/a | n/a | n/a | 934 |
| No statistically reliable differences between the types of purchases and when buyers reach out to vendors were found. | ANOVA | 2.25 | p = .08 | n2=.007 | 934 |
| Renewal/Continuation purchases are not seen as more important than others. | ANOVA | F=.702 | p=.551 | n2=.002 | 934 |
| The acquisition of new business capabilities was found to be more costly than Renew/Continue purchases, but within the margin of error for the other types. | ANOVA | F = 3.001 | p = .03 | n2=.01 | 929 |
| New capability buyers evaluate more vendors than the other purchase types with the exception that we cannot conclude that Renew/Continue purchases are meaningfully different from New Capability purchases. | ANOVA | F=5.55 | p<.001 | n2=.018 | 934 |
| Buying groups for new business capabilities are larger by 1.4 people on average compared to the next largest type, Improve Existing Capabilities, and statistically larger than all but Renew/ Continue purchases. | ANOVA | F=4.217 | p=.006 | n2=.013 | 934 |
| New Capability purchasers were substantially more likely (82.5%) than buyers in other Purchase Types (74.1%) to utilize outside resources such as consultants and analysts. | Chi2 | N/A | p<.001 | x2=20.68 | 934 |
| New business capabilities require nearly four more interactions per person than others, making it statistically different from the other purchase types. | ANOVA | F=11.25 | p<.001 | n2=.035 | 934 |
| Buying cycles for New Business Capabilities average two months longer than Improve Existing Capability purchases, and more than three months longer than the other two types. New Capability purchases are reliably longer than all other types. | ANOVA | F = 6.79 | p < .001 | n2=.021 | 934 |
| On average, purchase requirements are only slightly changed after the point of first contact for all purchase types. However, contrary to expectation, requirements for New Capability purchases are least changed after the point of first contact. This difference was statistically reliable but relatively small. | ANOVA | F = 4.42 | p = .004 | n2=.014 | 926 |
Table 3: Definitions of Statistical Terms
| Statistical Term | Definition |
| Statistical significance | Statistical significance is a measure of how reliable survey data is. It tells us how likely it is that the result we found represents the real world. For survey research, the standard for determining statistical significance is that we would expect to find the same result 95% of the time we replicate the survey with a sample drawn from the same population. 6sense Research uses the word “reliable” instead of “significant,” because we think it is a more accurate description of this concept. The word “significant” is often taken to mean “important” or “large” in everyday conversation, but there are many cases in which findings that are statistically significant are not meaningful, large, or important. |
| Significance is not importance | Statistical significance is a measure of how reliably a finding represents the population or real-world condition of interest. However, the word “significance” can be misleading. It can make people think that a statistically significant finding is also important or meaningful. But this is not always the case. In fact, many findings that are statistically significant are not really significant in any way that we would care about. When we encounter findings that are statistically “significant” but not important, we describe them as “not meaningful.” For instance, in our research of B2B buying processes we found that buyers reliably consume vendor content (e.g., website, webinars) more than they read analysts reports, but only by 4%. Thus, is an example in which we found a “statistically significant” finding that is not very meaningful. |
| Margin of Error | With a 95% confidence level, the margin of error provides an interval that is expected to contain the true population parameter in 95 out of 100 samples. |