


Executive Summary
Our prior research showed that B2B buyers select a favored vendor before engaging sellers — and that pre-contact favorite wins the deal roughly 80% of the time. That core truth still holds in 2025. What has changed is the timing of that first contact.
This year’s main global study of nearly 4,000 B2B buyers found that:
- Buying cycles are shorter. Average cycle length dropped from 11.3 months in 2024 to 10.1 months in 2025.
- Buyers are contacting sellers earlier. The point of first contact (POFC) shifted from 69% of the journey to 61% — a difference of roughly six to seven weeks.
- Yet decisions are largely cementer prior to first contact with sellers. Ninety-five percent of the time, the winning vendor is already on the Day One shortlist, and four out of five deals are still won by the vendor on the top of the shortlist prior to seller engagement.
In Europe:
- The average buying cycle was not statistically different from last year, though it trended longer — rising from 9.0 months in 2024 to 9.8 months in 2025. This contrasts with a contraction in buying cycles elsewhere in the world.
- Buyers are also contacting sellers earlier. The point of first contact (POFC) shifted from 67% of the journey to 58% — about one to two weeks sooner.
- However, like the rest of the world, decisions remain locked in before the first contact with sellers. In Europe, 92.4% of the time the winning vendor is already on the Day One shortlist, and buyers choose the vendor they ultimately purchase from before ever speaking with sales roughly 75% of the time.
Two external shocks explain these changes:
- Artificial Intelligence. Nearly 90% of buyers report AI features are now part of the solutions they acquired. The need to validate what AI capabilities vendors actually provide — including pricing, security, implementation — is pulling buyers into earlier conversations with sellers.
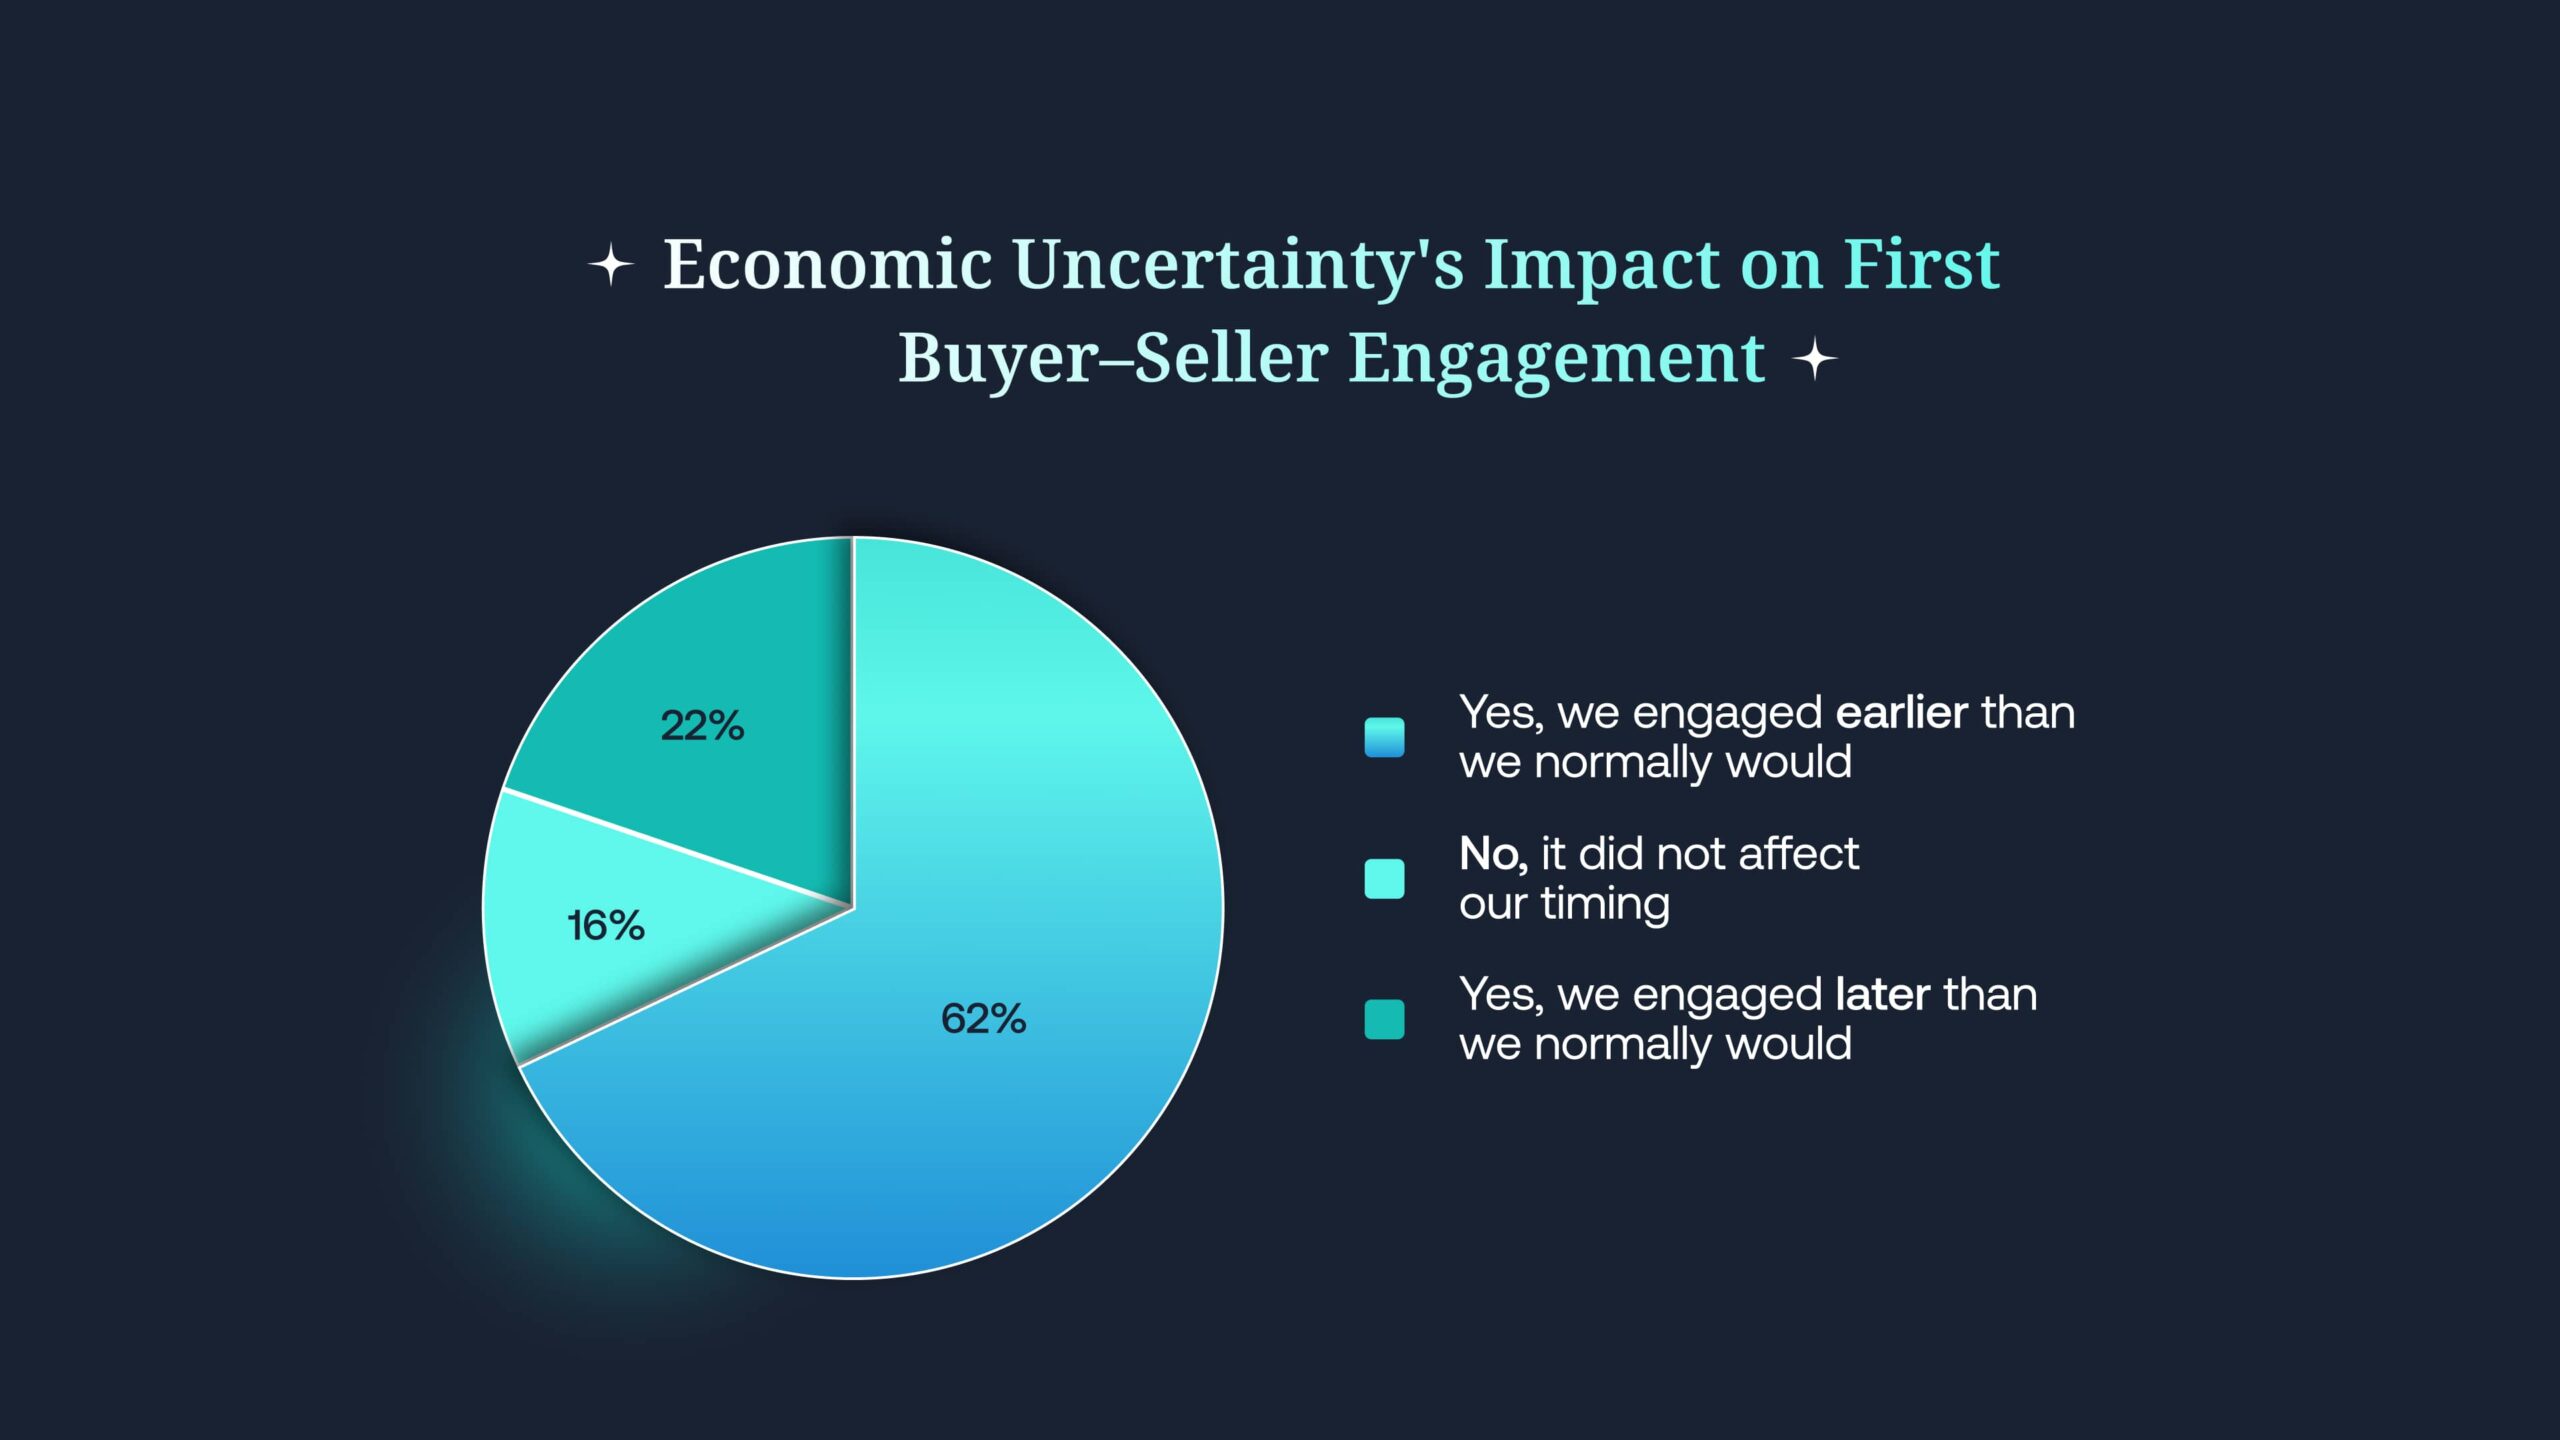
- Economic Uncertainty. Nearly half of buyers said economic pressure shortened their cycles, and 62% said it drove earlier seller engagement. Many sought to commit funds quickly before budgets could tighten.
Despite these disruptions, buyers remain in control. They are more experienced than we ever understood before, averaging eight to nine prior purchase journeys (8.3 in Europe) per category. And they still set preferences well before first contact, meaning that sellers encounter buying groups whose members are deeply experienced and whose choices are largely decided.
A Special Thank You
In producing the European version of the Buyer Experience Report, we extend our thanks to LeadFabric, our regional partner, whose insight was essential in capturing the nuances of European buying groups.
LeadFabric is a leading European B2B marketing consultancy specializing in aligning strategy, technology, and execution. They help organizations elevate buyer and customer experiences through marketing automation, ABM, and demand generation expertise.
Introduction
Over the past year, the promise of AI and specter of economic uncertainty have dominated business discussions. Our 2025 study of buyer behavior comprises two surveys totaling more than 4,000 responses, and it captured a marketplace in a state of flux, buffeted by these powerful forces.
Last year, we described the 70/30 Buying Journey, which divides the buying process into two main phases: the Selection Phase and the Validation Phase. The Selection Phase, which accounts for the initial 70% of the journey, finds buyers researching, debating, and forming preliminary consensus on a preferred vendor. The Validation Phase, which follows, begins with buyers reaching out to sellers and culminates in the purchase. Notably, about 80% of the time, the favored vendor at the end of the Selection Phase is the same one buyers ultimately purchase from after the Validation Phase.
In this year’s report, we delve into how the promise of AI and the looming specter of economic uncertainty are distorting the contours of what we had termed the “70/30 Buying Journey”, while leaving its key dynamics intact.
The Promise of AI
Across boardrooms, SLT meetings, and LinkedIn feeds, AI is discussed in terms that are equal parts fear and reverence:
- Is this the birth of our dystopian — or our utopian — future?
- Will it make us all more productive, or redundant altogether?
- Are buyers already relying heavily on LLMs for their buying research?
- Will buyer agents soon be doing deals with seller AI agents, leaving revenue teams out of the picture entirely?
What we discovered in our research for the 2025 Buyer Experience Study is that AI is reshaping buying in not one, but two important ways.
First, there’s the use everyone’s been watching: how buyers are turning to generative AI — large language models such as ChatGPT or Europe’s Mistral AI — as they research and evaluate solutions. Our report describes how buyers are utilizing AI in their shopping.
But the second — and currently more important — shift is that AI has become a core element of nearly every solution companies are acquiring, and buyers have to account for that in their evaluations.
In our earlier Buyer Experience Reports, we have emphasized how the buying journey has been abstracted from the sales cycle. Results from two years of research (2023-2024) and just over 5,000 B2B buyers across three major global markets have shown us that:
- Buyers are deeply experienced in the solution categories that impact their roles, and
- They are able to execute two-thirds of their buying journeys – including choosing winning vendors — before engaging with sellers.
However, buyers of nearly every B2B solution now have to understand whether AI is embedded in those solutions, and, if so, what it is doing. They need to know how AI is changing a vendor’s capabilities, pricing models, implementation timelines, and data security.
Simply put: a buyer’s due diligence now includes answering vital questions about how AI is being implemented in solutions they buy, whether technology or services, and even physical goods.
Buyers’ experience in a given category is of little use in this new terrain, and the information they need is not readily available on vendor websites. Later in this report, we discuss how this is warping buying processes.
The Specter of Economic Uncertainty
Alongside the rise of GenAI, persistent macroeconomic uncertainty continues to keep many organizations in a defensive crouch — slowing hiring, tightening budgets, and raising the bar for new investments.
Our interest, naturally, is to understand whether buyers are pulling back with caution and skepticism – or, conversely, moving quickly to spend before budgets tighten further.
Our 2025 Buyer Experience Report answers these questions.
What you will read in this report is that buyers are still in control, still human, and surprisingly consistent in how they move through the buying process — even as the world around them transforms. However, transform it has, and buyer behavior reflects that, distorting a key aspect of the buying journey we have been reporting on for two years.
Methods
Last year’s research into Continental Europe included Belgium, the Netherlands, and Germany, with about 330 responses across those countries. This year, coverage expanded to also include France and Sweden, resulting in a total of 945 responses across the five countries for 2025.
As in the main global study (n=3,744), respondents qualified for participation by having been involved in a purchase for their organization of at least $25,000 USD within the past two years. The average purchase cost in Europe this year was in the mid-to-high $200,000s USD, compared with a global median of $200,000 to $300,000 USD.
An additional 766 responses came from a companion survey on AI in solutions and economic conditions, carried out with respondents in North America and the UK. Further details on our sample of buyers can be found in the appendix.
Findings
Summary of 2023 and 2024 Buyer Experience Study Findings
In 2023 and 2024, we set out to map the modern B2B buying journey by gathering direct feedback from thousands of buyers across roles, regions, and industries. We wanted to understand what buyers are actually doing — not just what vendors believe they’re doing — during the decision-making process.
Across both years (2023-2024), a consistent global picture of the buying journey emerged. Buying groups are large and complex, often involving around ten individuals for an average deal size of roughly $250,000 USD. The journey itself is lengthy, often stretching close to a year, and buyers evaluate roughly five vendors before reaching a decision.
The evidence also shows that buyers across the globe come to the table with experience and preferences already in place. They begin their journeys with most of their shortlist filled—often based on prior knowledge or direct experience with vendors—and they delay engaging sales teams until about two-thirds of the way through. When they do make contact, it is buyer-initiated in about 80% of cases, and the winning vendor is chosen before that first conversation with sales roughly 80% of the time.
Last year in Europe:
- B2B buying groups were large. On average, 9 people from the buyer’s organization were involved in a purchase decision.
- The typical buying journey lasted 9 (9.1) months.
- European buying groups evaluated an average of 4 vendors.
- On average, buyers didn’t engage with sellers until they were two-thirds (67%) of the way through their journeys.
- Sales development (SDR/BDR) outreach played a minimal role in influencing the Point of First Contact (POFC) with buyers; in most cases, buyers are deliberately ignoring unsolicited outreach until they’re ready.
- When buyers did engage, they initiated that contact 87% of the time, reaching out to vendors only once they established purchase requirements and ranked their shortlists in order of preference.
- The vendor buyers contacted first had a massive statistical advantage: 79% of the time, the vendor buyers reached out to first won the deal, strongly indicating that buyers identify a favorite vendor prior to contact and reach out to that provider first.
| European Buying Journeys in 2024 | |
|---|---|
| Total Buying Cycle Length | 9.1 months |
| Point of Fist Contact with Sellers (% of Journey) | 67% |
| Average Number of Vendors Evaluated | 4 |
| Number of Interactions per Person, per Vendor | 14 |
| Buying Group Size (Number of Individuals) | 9 individuals |
| Buyer-Initiated Contact | 87% |
| Contact with Winner First | 79% |
| Purchase Requirements Are Mostly or Fully Defined Before Seller Contact | 91% |
| Buyers Engaging External Resources (Analysts, Consultants) | 59% |
Within the careers of most B2B marketing leaders, buyers had no choice but to engage with sellers to begin their buying journeys, as they had little to no direct access to product information. But for many years now, buyers have been able to chart most of the journey themselves — engaging sellers only after they have formed strong opinions. As a result, sales cycles today don’t begin until buyers initiate contact with sellers, and buyers put that moment off until they are nearly two-thirds of the way through their buying journey.
That was the baseline heading into 2025.
But as new technologies and market pressures take hold, this year’s research suggests that first contact between buyers and sellers has shifted earlier in the journey for the first time since we have begun measuring.
2025 Findings: The Song Remains the Same, But the Rhythm Has Been Disrupted
This year, our global study confirmed the same central truth we have seen in prior years: B2B buyers remain confident and independent, with critical decisions made before sellers are ever involved. What has shifted is the timing. Buyers are now engaging sellers earlier than before, largely to assess how vendors are incorporating AI into their solutions.
At the same time, the study showed that buyers still come to the table with deep experience and clear preferences. Shortlists are mostly formed from day one of the buying journey, and the winning vendor is almost always among those initial options. Buying groups remain large and complex, but the average journey itself is becoming more compressed, even as buyers evaluate more vendors.
Together, these findings highlight a global buying journey that is still buyer-led, but evolving in meaningful ways.

This year in Europe:
- The average buying cycle is not statistically different from last year, though it trends longer — rising from 9.1 months in 2024 to 9.8 months in 2025.
- European buying groups remain steady at an average of 9 (9.2) people, the same as last year.
- Buyers are evaluating slightly more vendors. The average has increased from 4 in 2024 to 4 ½ (4.6) in 2025. They have prior experience with nearly all (3.7) of those and fill 3 ½ spots on their shortlist on day one of the buying journey.
- In Europe, 92.4% of the time the winning vendor is on the Day One shortlist.
- Buyers are also contacting sellers earlier. The point of first contact (POFC) shifted from 67% of the journey to 58% (58.3%). Because the journeys are longer, this amounts to only about two weeks sooner in calendar time than it would have been in prior years.
- European buying groups are the ones to initiate contact with sellers 80% (80.4%) of the time (slightly down from 87% last year).
- European buyers choose the vendor they ultimately purchase from before ever speaking with sales roughly 75% of the time (slightly down from 79% of the time last year).
- Buyers bring extensive prior experience to the buying journey. The average individual buyer in Europe has been through 8.3 prior purchases in their product category.
- In Europe, 89% of buyers are using LLMs to aid their research of solutions, but this has not changed their reliance on vendor content or third-party experts.
- In fact, reliance on outside resources is growing. This year, 72% of European buyers reported hiring external support—such as analysts, consultants, investors, or distributors—up from 59% last year.
- Counter to the narrative that buyers are not visiting vendor websites, European buyers are interacting slightly more with vendor content than before — averaging 15 (15.3) interactions per person, per vendor, up from 14 last year. We address this seeming paradox later in the report.
| European Buying Journeys in 2025 | European Buying Journeys in 2024 | |
|---|---|---|
| Total Buying Cycle Length | 9.8 months | 9.1 months |
| Point of Fist Contact with Sellers (% of Journey) | 58% | 67% |
| Average Number of Vendors Evaluated | 4 ½ | 4 |
| Number of Interactions per Person, per Vendor | 15 | 14 |
| Buying Group Size (Number of Individuals) | 9 individuals | 9 individuals |
| Buyer-Initiated Contact | 80% | 87% |
| Contact with Winner First | 75% | 79% |
| Purchase Requirements Are Mostly or Fully Defined Before Seller Contact | 78% | 91% |
| Buyers Engaging External Resources (analysts, consultants) | 72% | 59% |
| Share of Buyers Using AI (LLMs) for Solution Research | 89% | — |
Buying Cycle Compression: Globally Yes, but Less Clearly in Europe
Globally, buying cycles are compressing. Buying groups were trimmed down slightly, from 10.4 to 10 people, yet evaluated more vendors — rising from four and a half to five (5.1) on average. In past years, adding just one vendor to the shortlist extended the buying cycle by more than two months. By that measure, an increase of half a vendor should have added about a month to the average buying cycle. Instead, global buying cycles moved over a month faster, shortening from 11.3 months in 2024 to 10.1 months in 2025.
In Europe, however, we see a different patter. Buying groups held steady at an average of nine people, while the number of vendors evaluated also rose by half — from four to four and a half, on average (compared to 4 ½ to 5.1 globally). Here, the cycle did move in the expected direction, running nearly a month longer. However, the difference was not statistically reliable, with too much variation in responses to conclude that European cycles are truly lengthening.
The global dynamics of buying cycle compression are explored in detail in the global report. In the sections below, we take a closer look at buying in Europe, focusing on how the number of vendors evaluated, buying group size, and cycle length compare across countries in the region.
European Buyers are Evaluating More Vendors
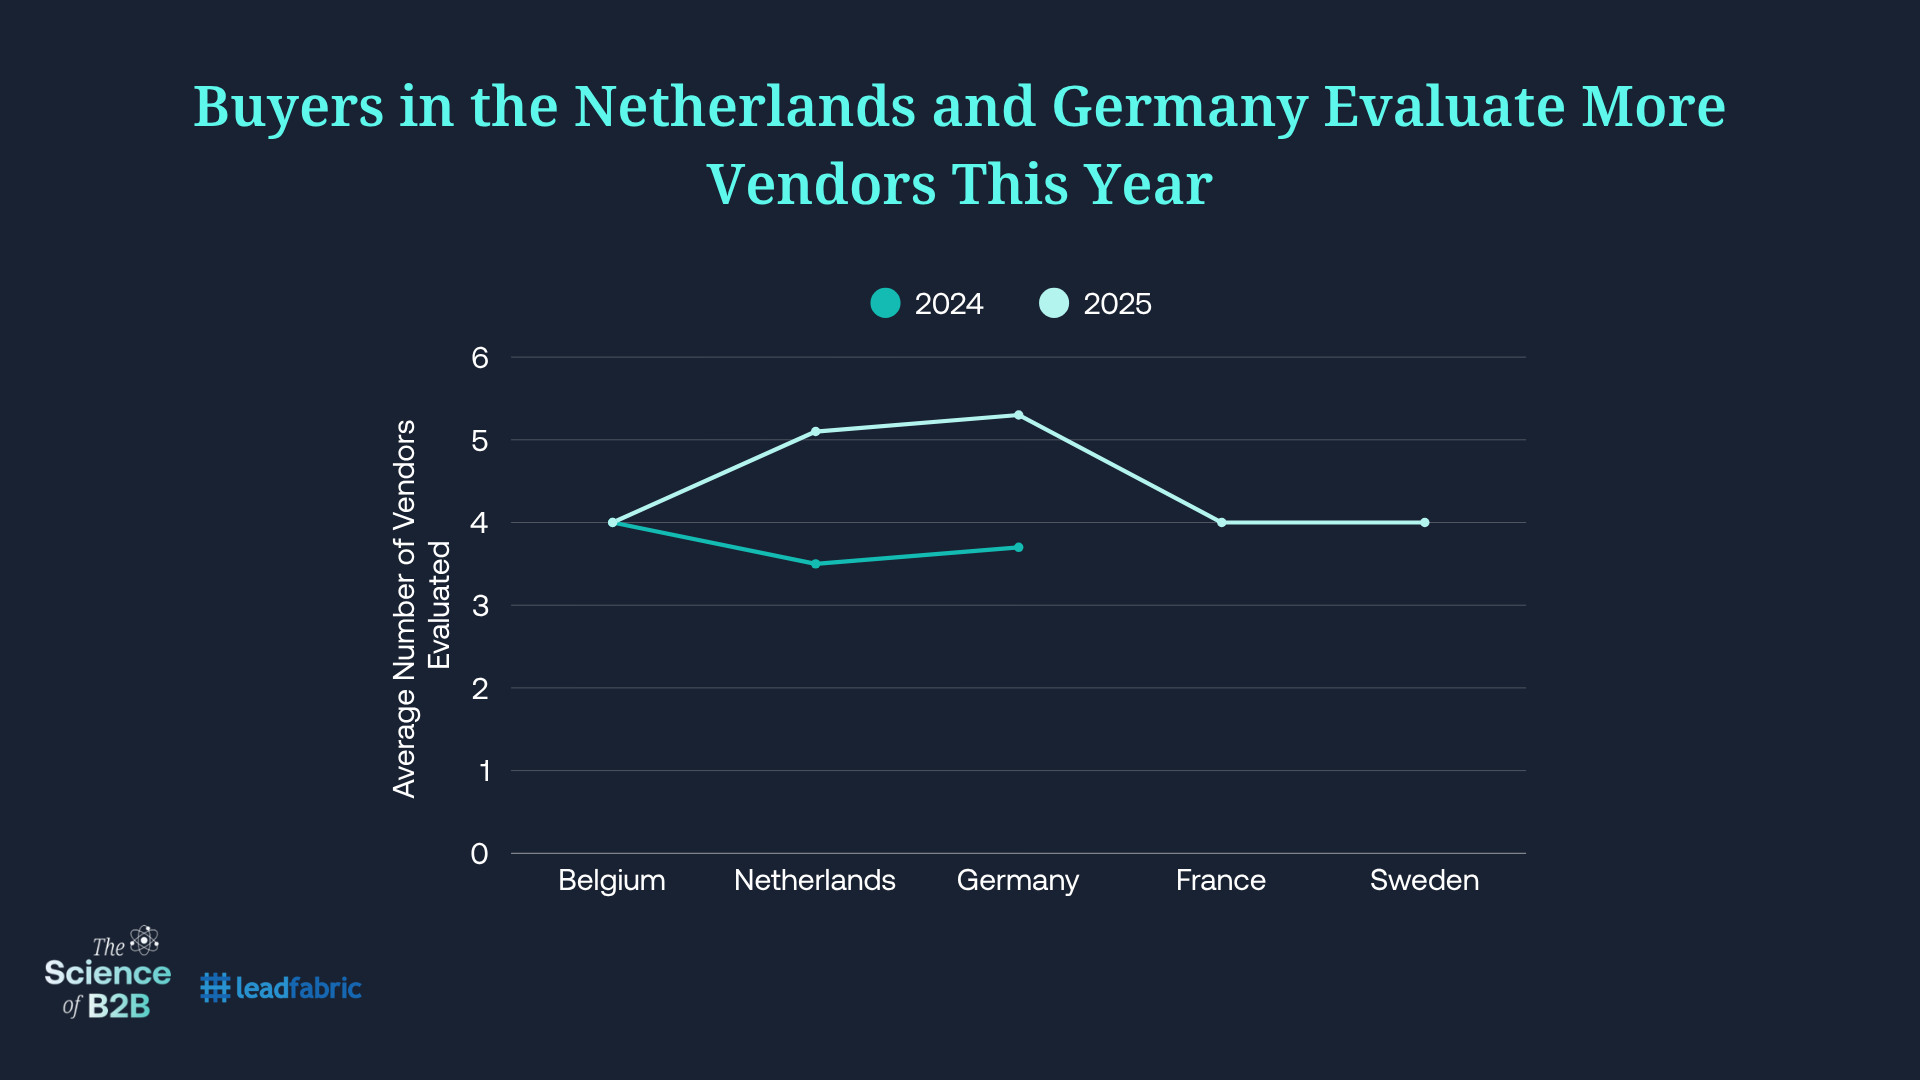
This year, German buying groups evaluated five (5.3) vendors on average compared to four (3.7) last year, while Dutch buyers also considered about five (5.1) after evaluating 3 ½ the year before. Belgium, on the other hand, did not show a reliable increase, with buyers evaluating about four vendors in both years.
One explanation for the rise in the number of vendors considered may be the increase in purchase cost. In Europe, average deal sizes rose from the mid-to-high $100,000s in 2024 to the mid-to-high $200,000s in 2025, a change partly driven by the increase in the minimum spend threshold for this year’s survey from $10,000 to $25,000 USD. While purchase cost does influence the number of vendors evaluated, it accounts for only about 12% of the variation in whether a buying group considers more or fewer vendors than average. On its own, it is a weak predictor, but it does contribute a small fraction to the increase.
Economic pressures also appear to be weighing on vendor selection at present. In our supplemental research on how economic uncertainty and AI are influencing the buying journey (n=766), 70% of buyers said concerns about economic conditions affected their vendor shortlist selections, often steering them toward more conservative options such as incumbents or familiar vendors. Of those, just over one-third (34.6%) said their choices were significantly impacted, while another 40% said they were somewhat impacted. Against that backdrop, the rise in vendors evaluated may reflect risk management, with buyers building in safeguards.
| Belgium | Netherlands | Germany | France | Sweden | |
|---|---|---|---|---|---|
| Number of Vendors Evaluated in 2025 | 4 | 5 | 5 | 4 | 4 |
Some European Markets Are Expanding Teams in Step with More Vendors Evaluated, as Seen in the Past
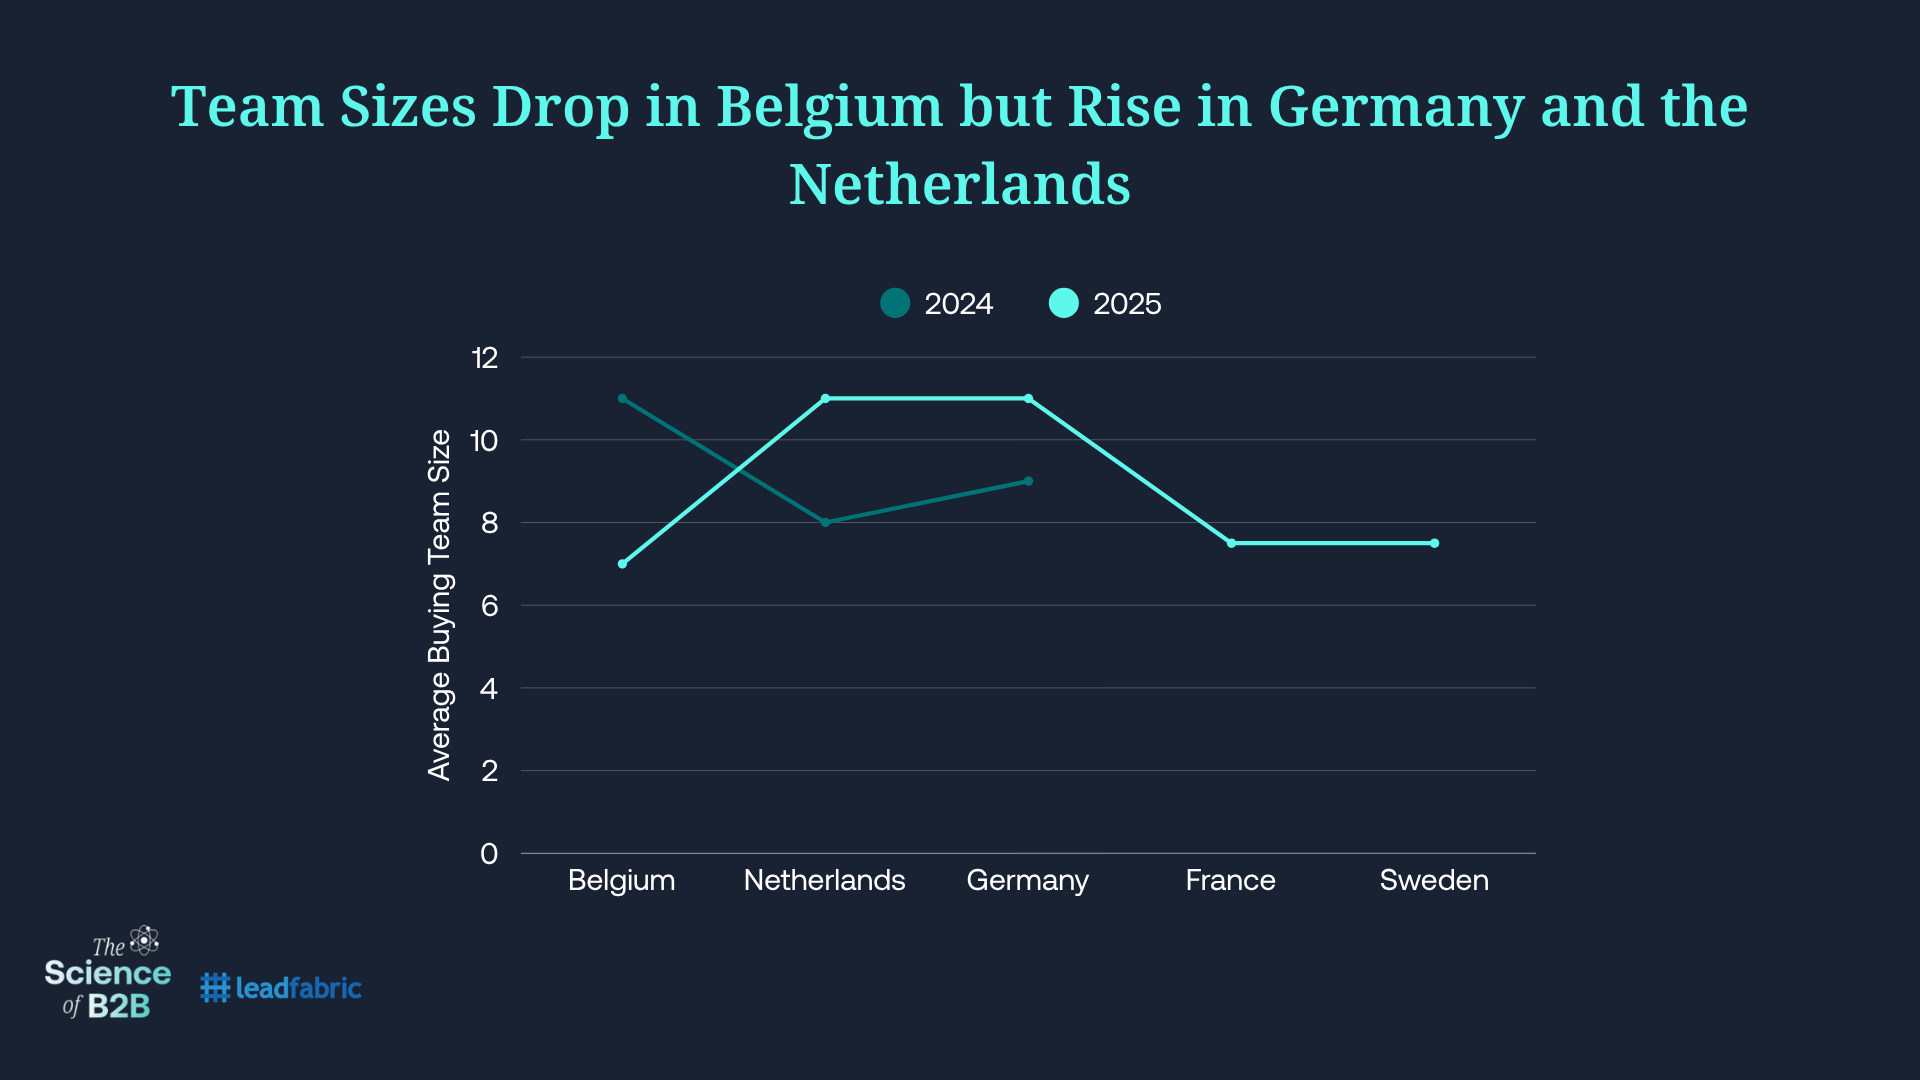
In previous years, purchase cost and the number of vendors evaluated explained more than half (54.4%) of the variation in buying group size. In this year’s survey, European buyers reported purchasing higher-cost solutions than last year and, in both Germany and the Netherlands, evaluating more vendors. In these countries, buying groups grew larger in line with what past statistical models would predict. In Germany, the average team size increased from nine people in 2024 to eleven in 2025, while in the Netherlands it grew from eight to eleven— both statistically reliable increases.
Belgian buying groups, however, evaluated the same number of vendors in both years, yet buying groups became smaller — dropping from an average of 11 people in 2024 to 7 in 2025. While we don’t have year-over-year comparisons for France and Sweden, their buying groups appear to be staffed in line with regional norms (see table below).
| Belgium | Netherlands | Germany | France | Sweden | |
|---|---|---|---|---|---|
| Number of Vendors Evaluated in 2025 | 4 | 5 | 5 | 4 | 4 |
| Buying Group Size | 7 people | 11 people | 11 people | 7 ½ people | 7 ½ people |
Buying Cycle Length Across Europe: German and Dutch Cycles Follow Historic Patterns
The length of the buying cycle moved in different directions across European markets, and the variation in responses left the regional average increase from 9 to 9.8 months short of statistical reliability. In other words, we don’t have enough evidence to say that the average buying cycle across Europe is truly lengthening — some markets are stretching while others are compressing.
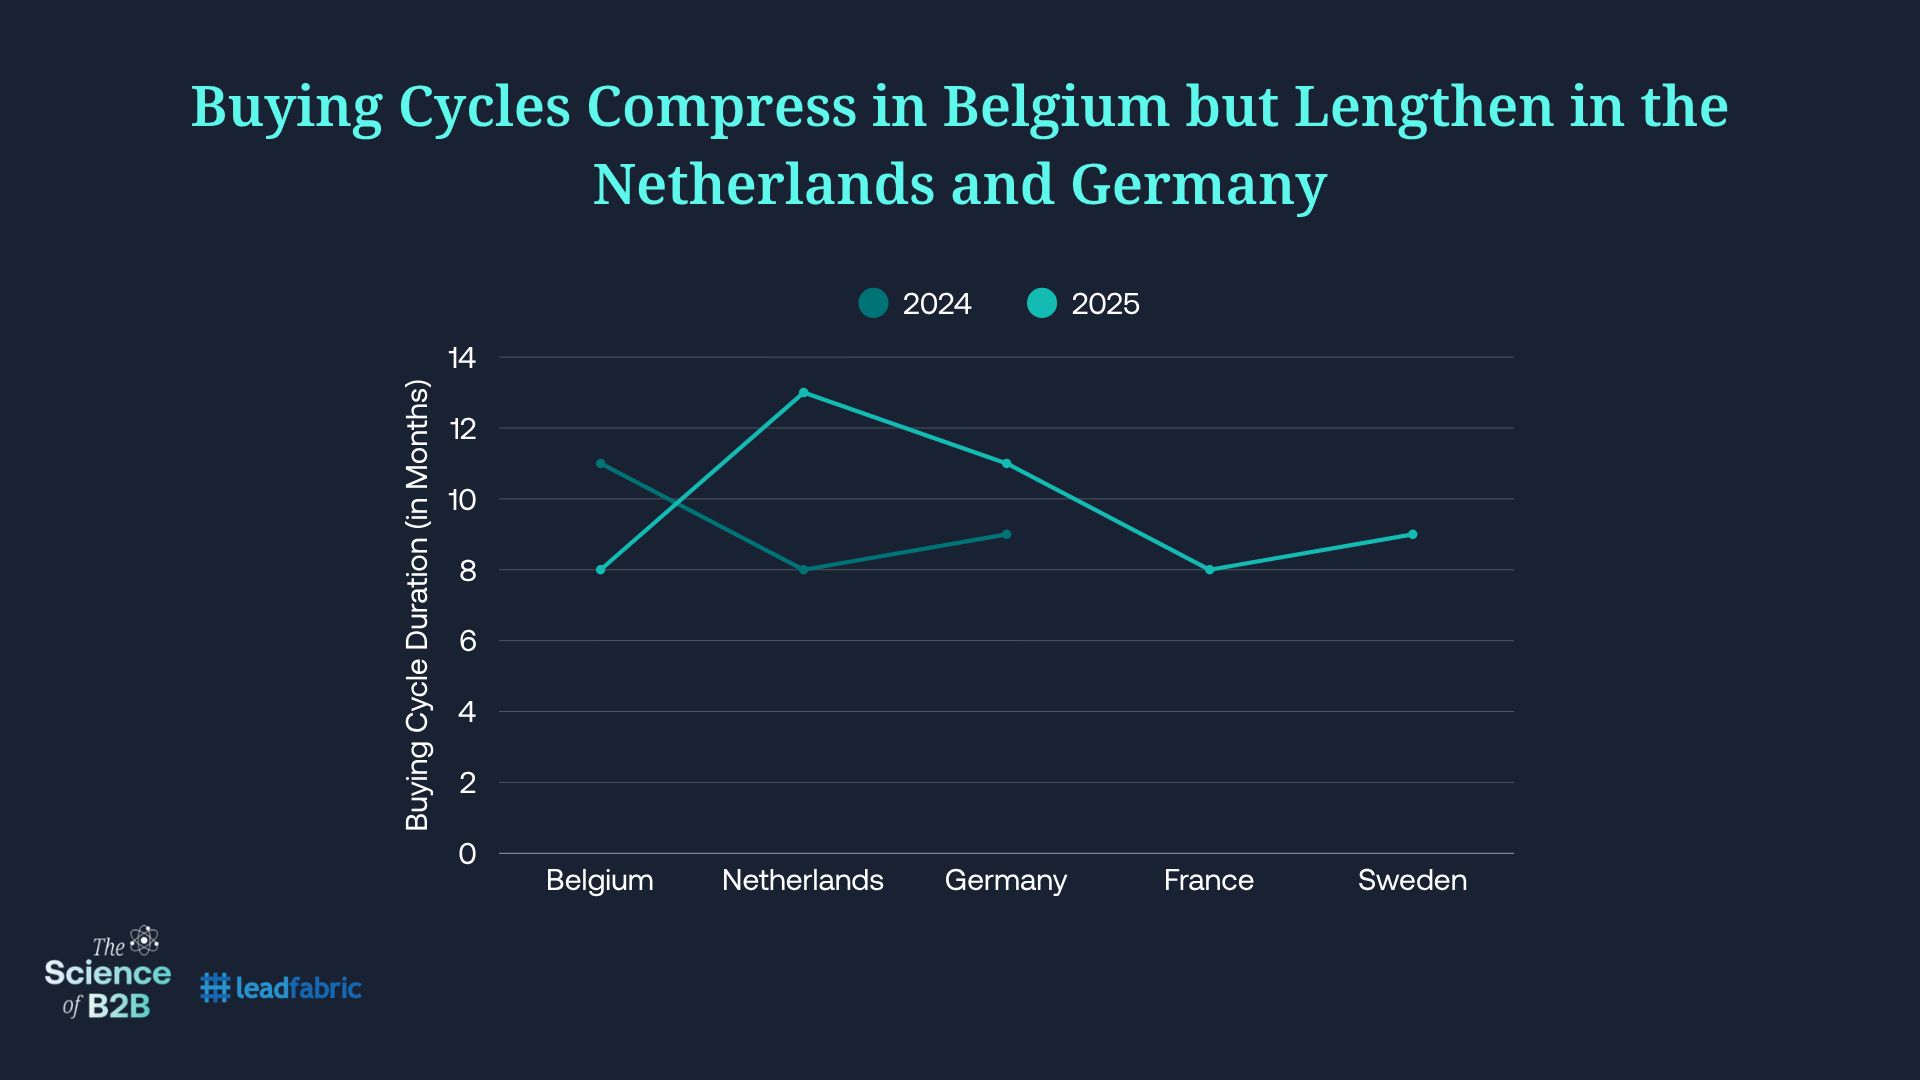
In Germany and the Netherlands, buying journeys lengthened in line with historic patterns in which evaluating more vendors leads to larger buying groups and longer cycles. German cycles extended from 9 months in 2024 to 11 in 2025, while Dutch cycles expanded from 8 to 13 months.
In Belgium, buyers evaluated the same number of vendors as last year but did so in smaller groups and over shorter cycles, with the average buying cycle falling from 11 months in 2024 to 8 months in 2025. This departs from the traditional “more vendors, bigger teams, longer cycles” pattern observed in Germany and the Netherlands and instead aligns more closely with the global trend of cycle compression, where fewer resources — in both time and team members — are devoted to each vendor.
| Belgium | Netherlands | Germany | France | Sweden | |
|---|---|---|---|---|---|
| Number of Vendors Evaluated in 2025 | 4 | 5 | 5 | 4 | 4 |
| Buying Group Size | 7 people | 11 people | 11 people | 7 ½ people | 7 ½ people |
| Buying Cycle Length | 7 ½ months | 13 months | 11 months | 8 months | 9 months |
Buyer-Seller contact Now Comes Sooner in All European Countries Sampled
This year, we observed two important shifts in buyer behavior.
The first: globally, the buying cycle has shortened despite more vendors appearing on evaluation lists. As noted earlier, Germany and the Netherlands saw cycles lengthen in step with the traditional pattern where more vendors lead to bigger buying groups and longer cycles, while in Belgium cycles reflected the new global trend of cycle compression.
The second — and perhaps the most surprising — is that buyers almost everywhere are reaching out to sellers sooner than in previous years. Last year, we described the 70/30 Buying Journey, which divides the buying process into two main phases: the Selection Phase and the Validation Phase. The Selection Phase, which accounted for the initial 70% of the journey, finds buyers researching, debating, and forming preliminary consensus on a preferred vendor. The Validation Phase, which follows, begins with buyers reaching out to sellers and culminates in the purchase. Globally, the point at which buyers reach out to sellers and begin the Validation Phase has moved from 70% of the journey (70/30) to 61% — what we now refer to as the 60/40 Buying Journey.
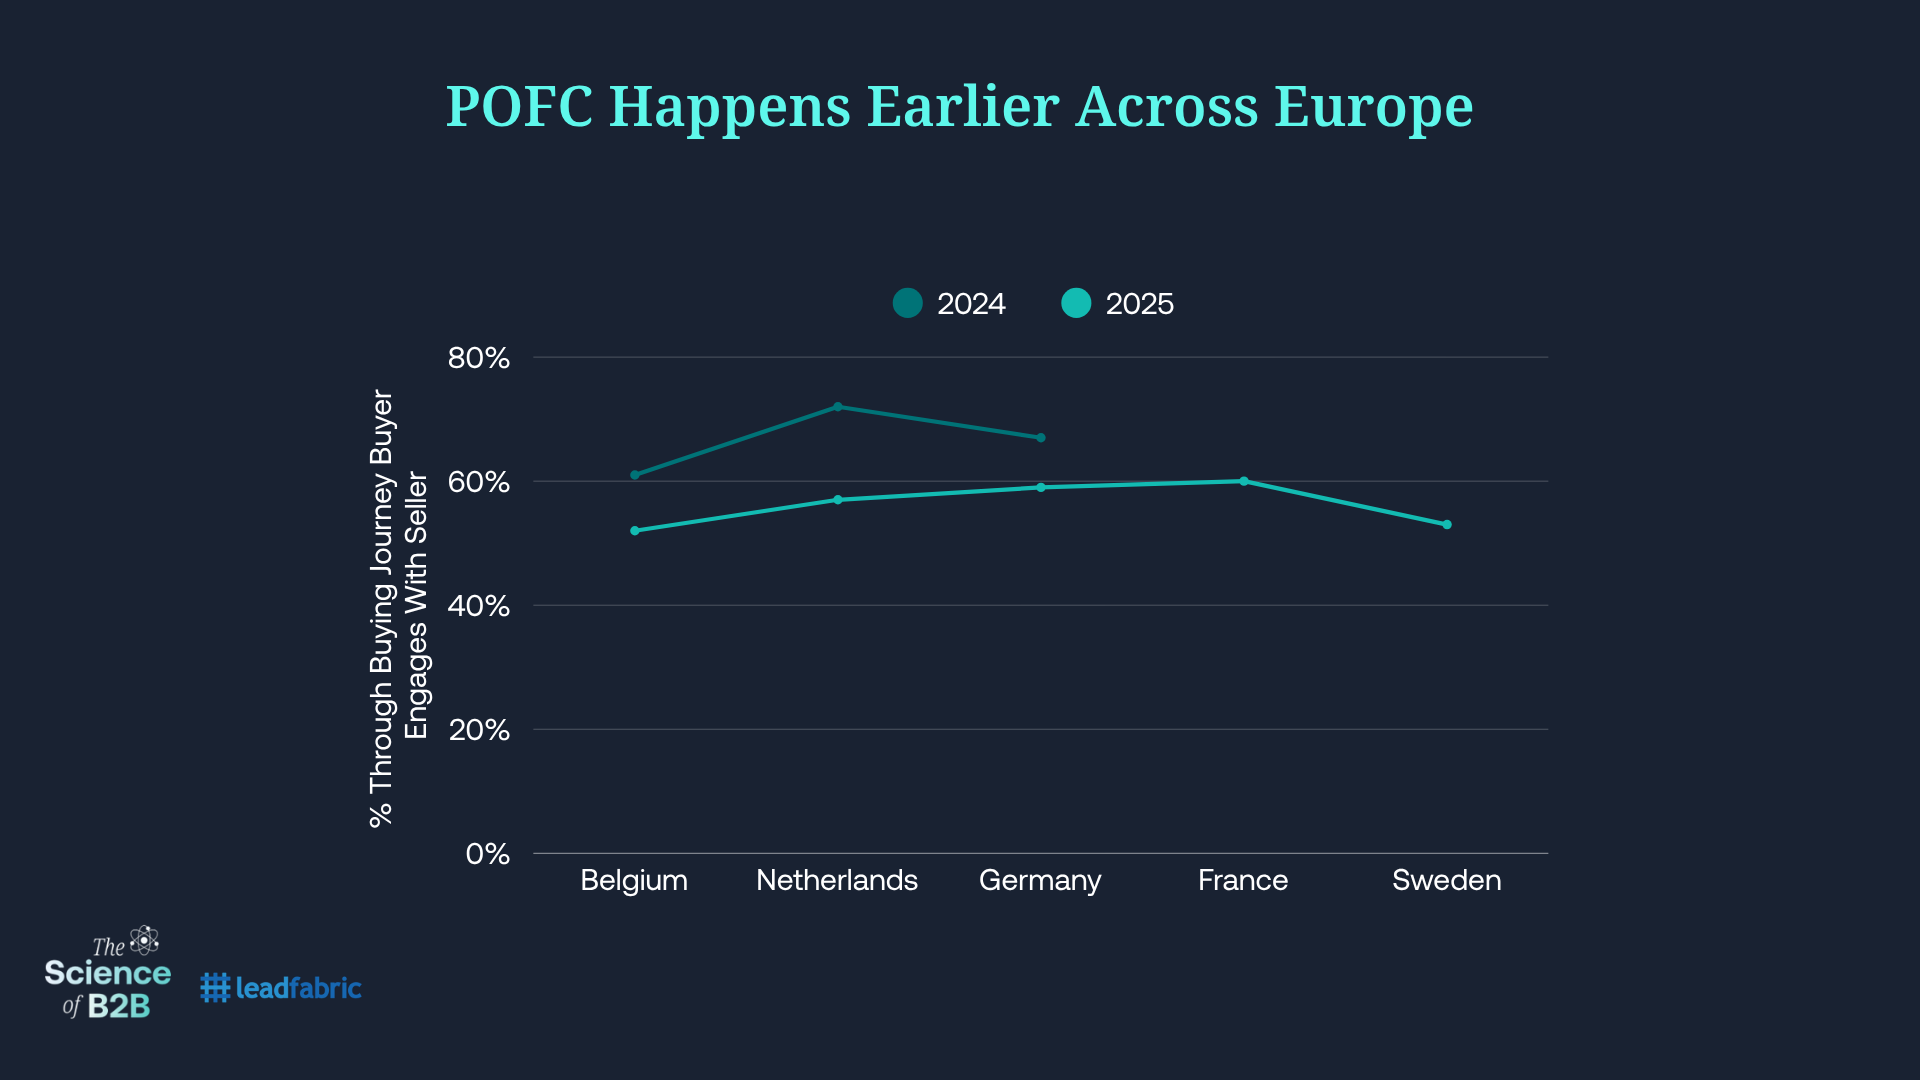
In Europe, the point of first contact between buyers and sellers shifted from 67% of the journey in 2024 to 58% in 2025. While France and Sweden were not included in last year’s study, the Netherlands, Belgium, and Germany each show earlier engagement. This year, Dutch buyers reach out a whopping 15% earlier (from 72% of the journey last year to 57% this year). In Belgium, the POFC moved from 61% of the buying journey to 52% in 2025, and in Germany from 67% to 59% — though neither difference is statistically reliable due to high variability in responses.
| Belgium | Netherlands | Germany | France | Sweden | |
|---|---|---|---|---|---|
| POFC (Fraction of the Journey) | 52% | 57% | 59% | 60% | 53% |
These findings begged the question: why now? Buyers have had the tools, experience, and confidence to conduct most of their evaluations independently for more than a decade. What could be prompting them to step into vendor conversations earlier in their buying journeys?
Based on our qualitative observations and conversations with B2B leaders, three plausible factors emerged:
- AI as a buying process tool – Much has been written over the past year about how buyers might or might not be using AI to aid in their buying journeys, noting a decline in web traffic on B2B vendor websites as an indication that buyers are using and stopping at LLMs in their evaluations.
- The need to evaluate AI inside solutions – not just GenAI’s use in the buying process, but how AI capabilities are being embedded into products and services.
- Persistent macroeconomic uncertainty – driving some organizations to move faster, either to secure budget before it disappears or to respond to shifting business conditions.
Are Buyers Substituting LLM Usage for Vendor Engagement?
No. Not yet, at least. When placed in a linear regression model, the use of AI as a research tool within the buying journey explains less than 2% of the variation in when buyers first engage sellers.
LLM Adoption
Globally, 94% of B2B buyers say they use LLMs as a tool within their buying journeys. Across Europe, 89% of buyers report using LLMs – like ChatGPT or Mistral AI – to aid in their solution research. Adoption in Germany (94%) is reliably higher than in France (85%), but no other country-level differences across Europe are statistically reliable, meaning we don’t have enough evidence to conclude that adoption rates are truly different across Sweden, the Netherlands, and Belgium.
| Belgium | Netherlands | Germany | France | Sweden | |
|---|---|---|---|---|---|
| Use of LLMs | 86% | 89% | 94% | 85% | 86% |
Despite high adoption and widespread use of LLMs as a research tool, buyers appear to be supplementing — not substituting — their traditional research with GenAI during their journeys.
Buyers are NOT:
- reducing the size of their buying groups because of AI,
- When placed in a linear regression model, the use of AI as a research tool within the buying journey explains less than 2% of the variation in buying group size.
- replacing their own fact-checking or vendor content review with LLM-based research,
- In Europe, buying groups averaged 15 interactions (including human and digital content) per person, per vendor (up from 14 last year)
- substituting external support such as analysts, consultants, VARs, distributors, or investors.
- This year, 72% of European buyers engaged external resources (up sharply from 59% last year)
LLM Timing and Use Cases
How, then, are buyers using LLMs?
European buyers, like their global peers, primarily deploy LLMs in the early and middle stages of the buying journey, though they are comparatively less likely than others to adopt them at the start of their research. This suggests that buyers are not using LLMs to identify vendors to evaluate. As we will see, buyers are deeply experienced and do not need to consult search engines or LLMs to identify vendors when buying within established categories.

Although overall adoption of LLMs is similarly high in Europe (89%) as it is elsewhere (94%), European buyers report lower usage across specific use cases (see below). This may suggest that LLM deployment in Europe is still in an exploratory phase — being workshopped widely and applied more generally, rather than embedded deeply into specific tasks across the buying journey.

Is the Potential Presence of AI Inside Solutions Impacting Vendor Engagement?
Yes.
To understand whether earlier engagement is connected to AI in the solutions being purchased, we surveyed B2B buyers in North America (n=557) and the UK (n=209). We first asked whether buyers expected or required the solutions they were evaluating to include AI. While expectations varied by product category, the vast majority said AI factored into their decision-making: about 95% said it was at least a consideration, and in many cases (62%) buyers were mandated or strongly encouraged to select solutions with AI features.
For example, machinery buyers were less likely than others to expect or require AI. Still, even in this category, a majority anticipated AI capabilities, and nearly 90% ultimately purchased solutions that included some form of AI feature.
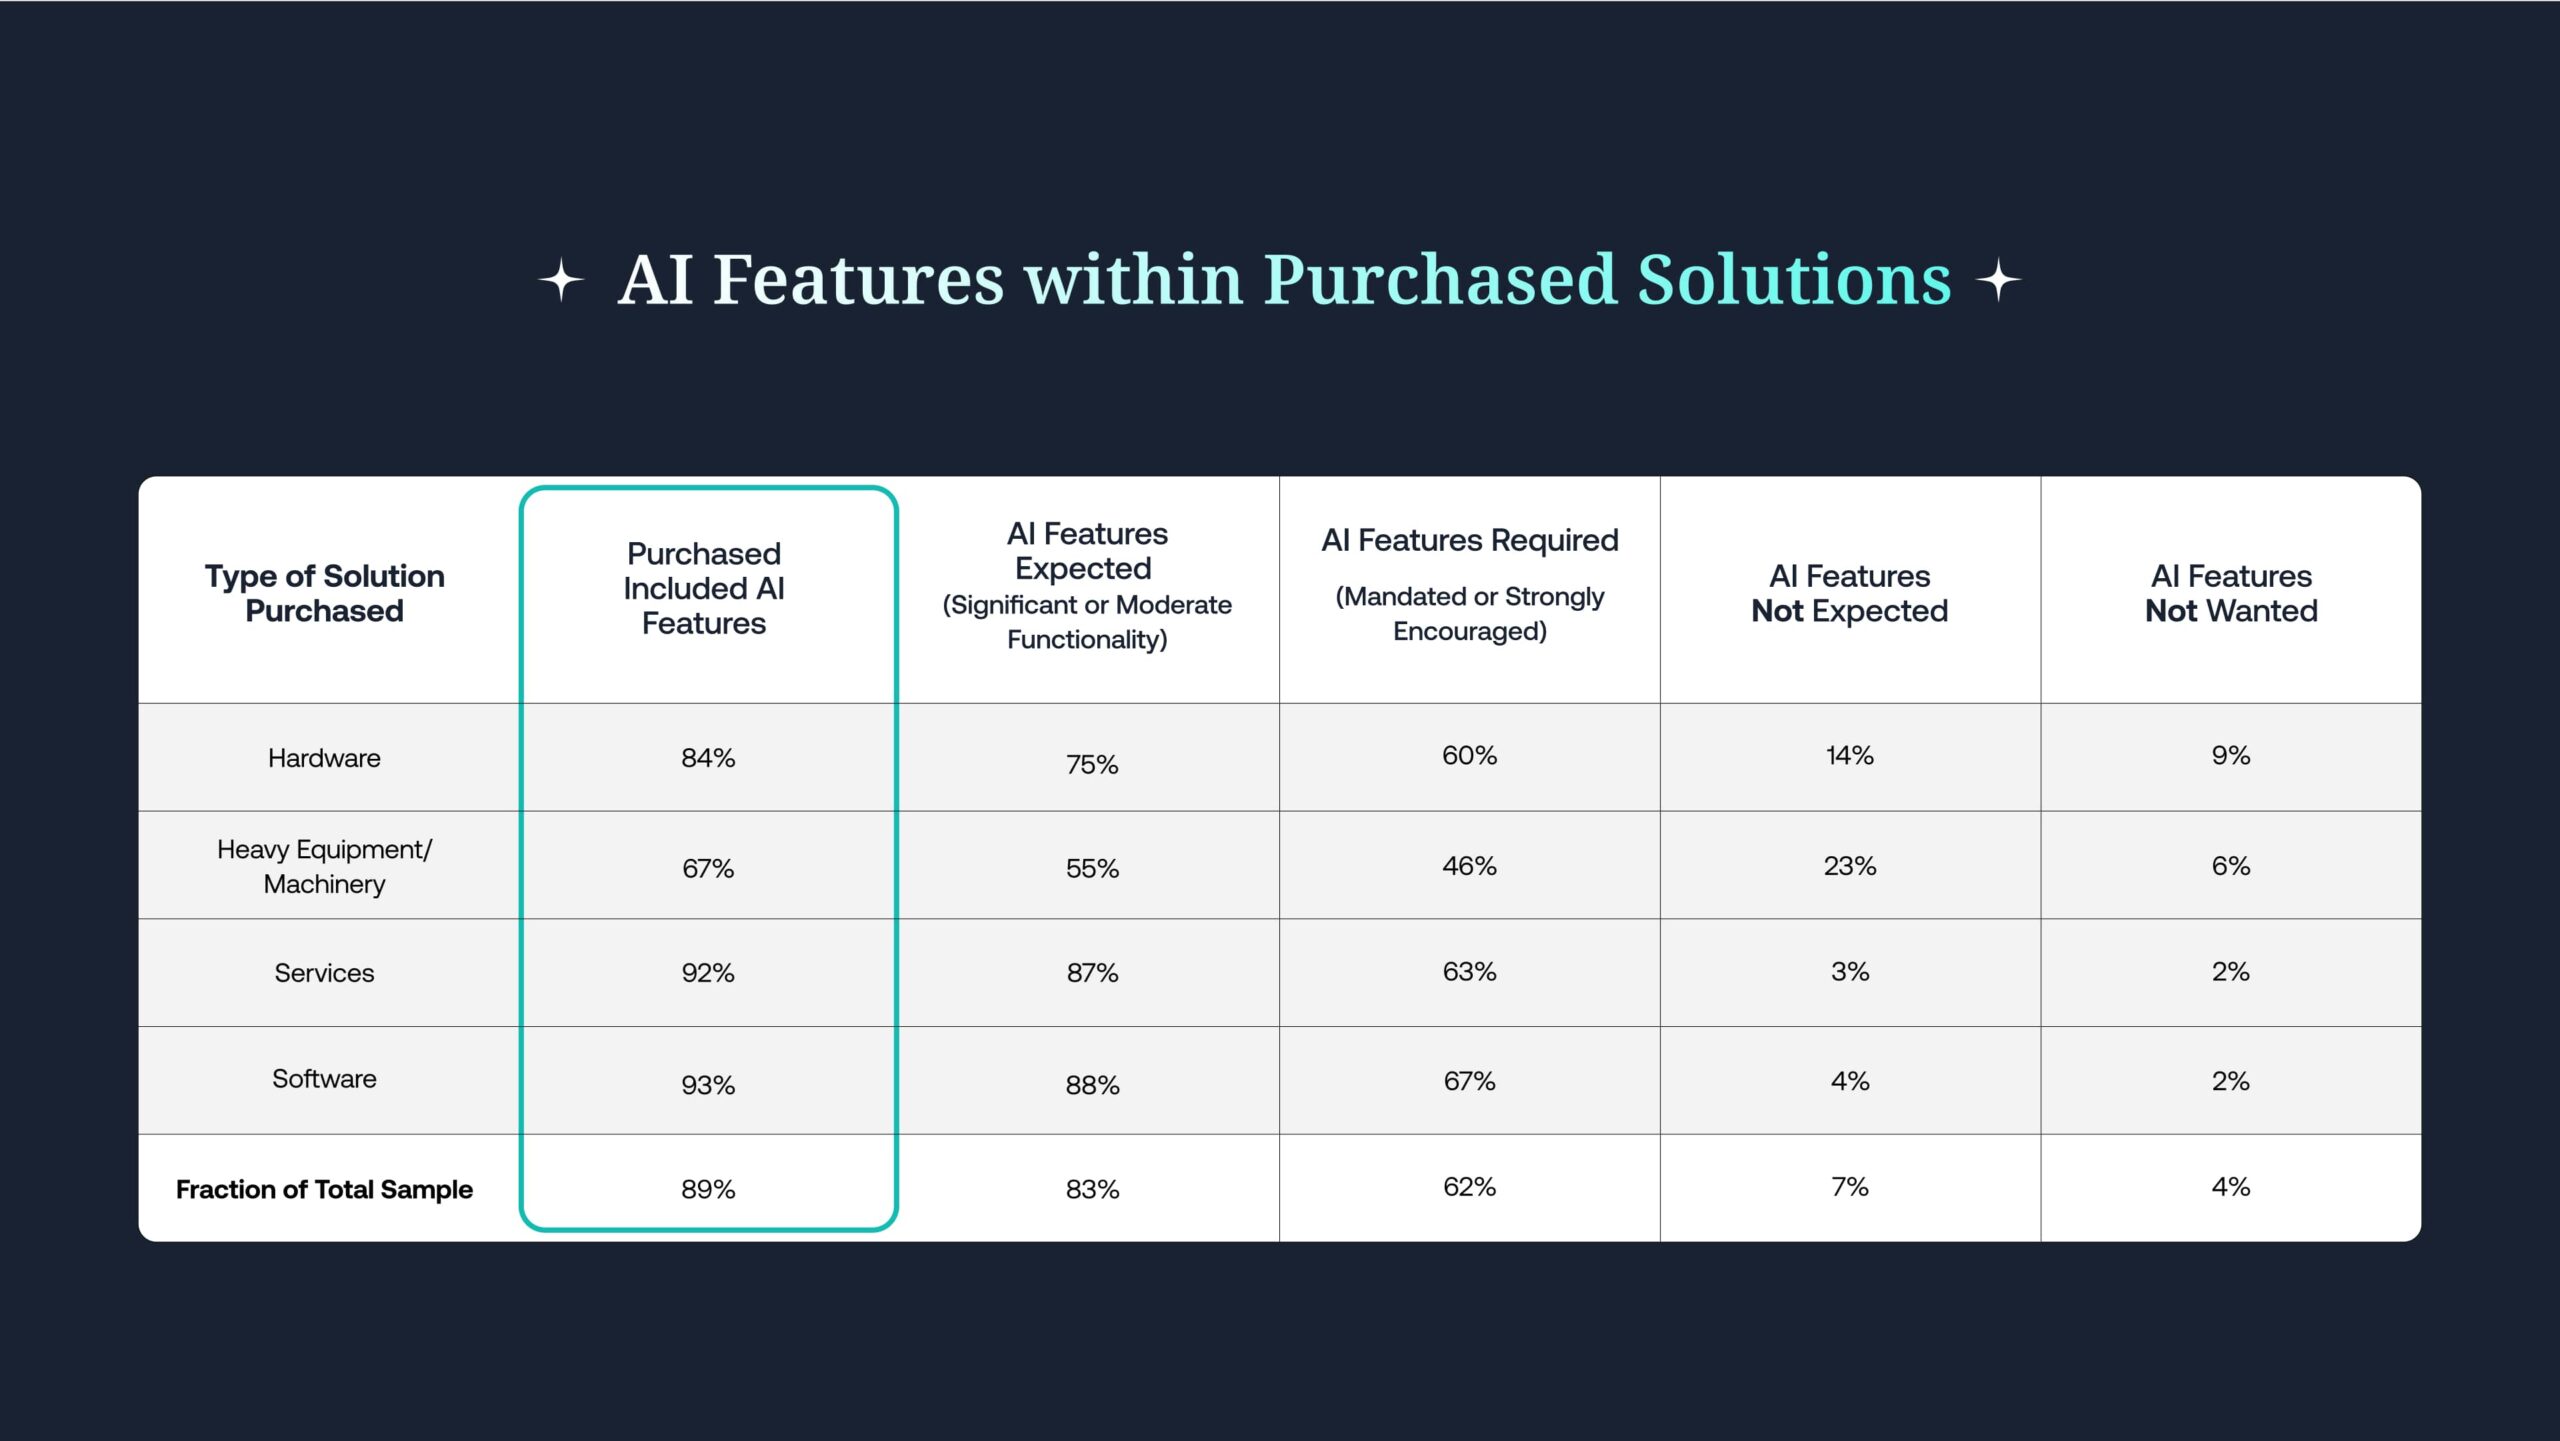
Not only was AI expected, but buyers had significant expectations for its performance. On average, they anticipated AI features would take on two to three distinct roles (e.g., automation, predictive analytics, personalization, etc.).
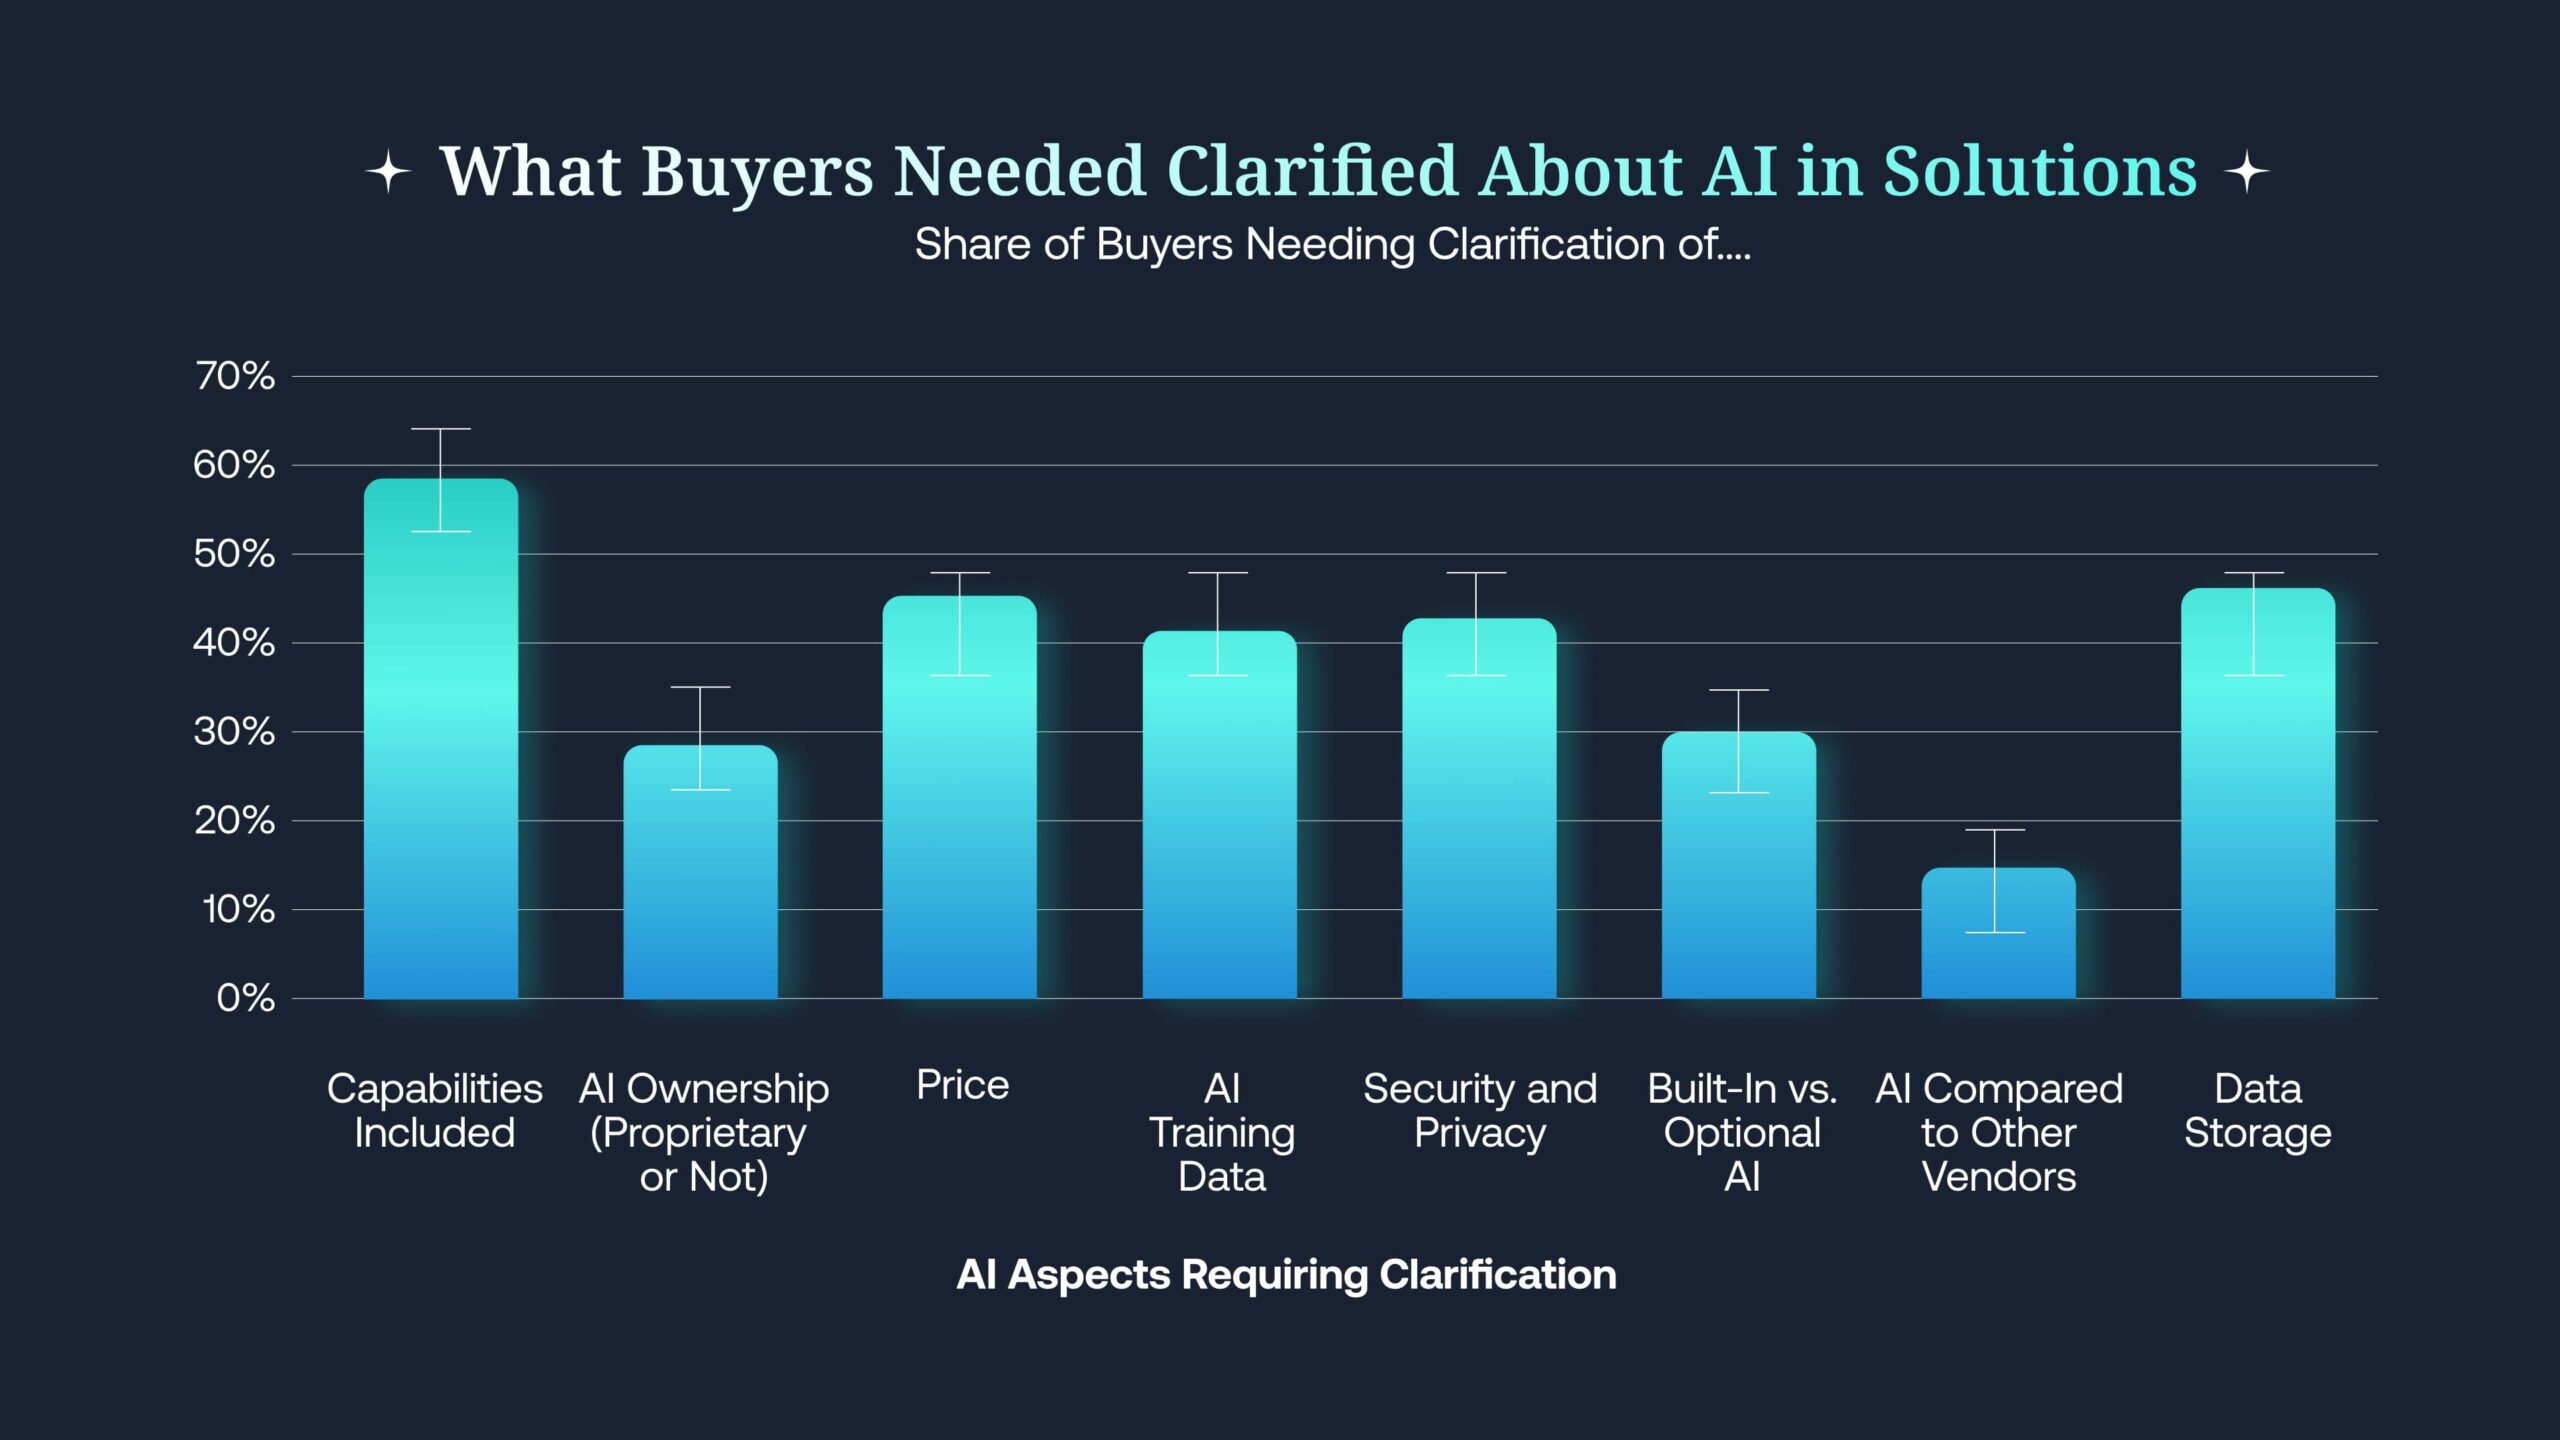
With nearly all buyers at least considering AI — and most showing a strong appetite for what they expected it to handle — we then examined whether buyers brought specific AI-related questions or concerns to vendors. Unsurprisingly, many (62%) did. Their concerns included the very basic question of what capabilities are included (55%) and how much, if anything, they would cost (46%). Nearly half of buyers also needed clarification on how models were trained, how data would be stored, and what privacy and security issues the AI capabilities introduced.
Fifty-Eight Percent of Buyers Engaged Earlier In Order to Evaluate AI Capabilities
Next, we examined whether the need to clarify how AI was implemented in the solutions they were evaluating caused buyers to engage differently than in prior years. To understand this, we asked buyers, “Did uncertainty about AI-related features or claims influence the timing of your team’s first engagement with vendor sellers or SDRs?”
The results here were unambiguous: 58% of buyers reported that they engaged with vendor representatives sooner than they would have otherwise in order to address their questions about how AI was implemented.
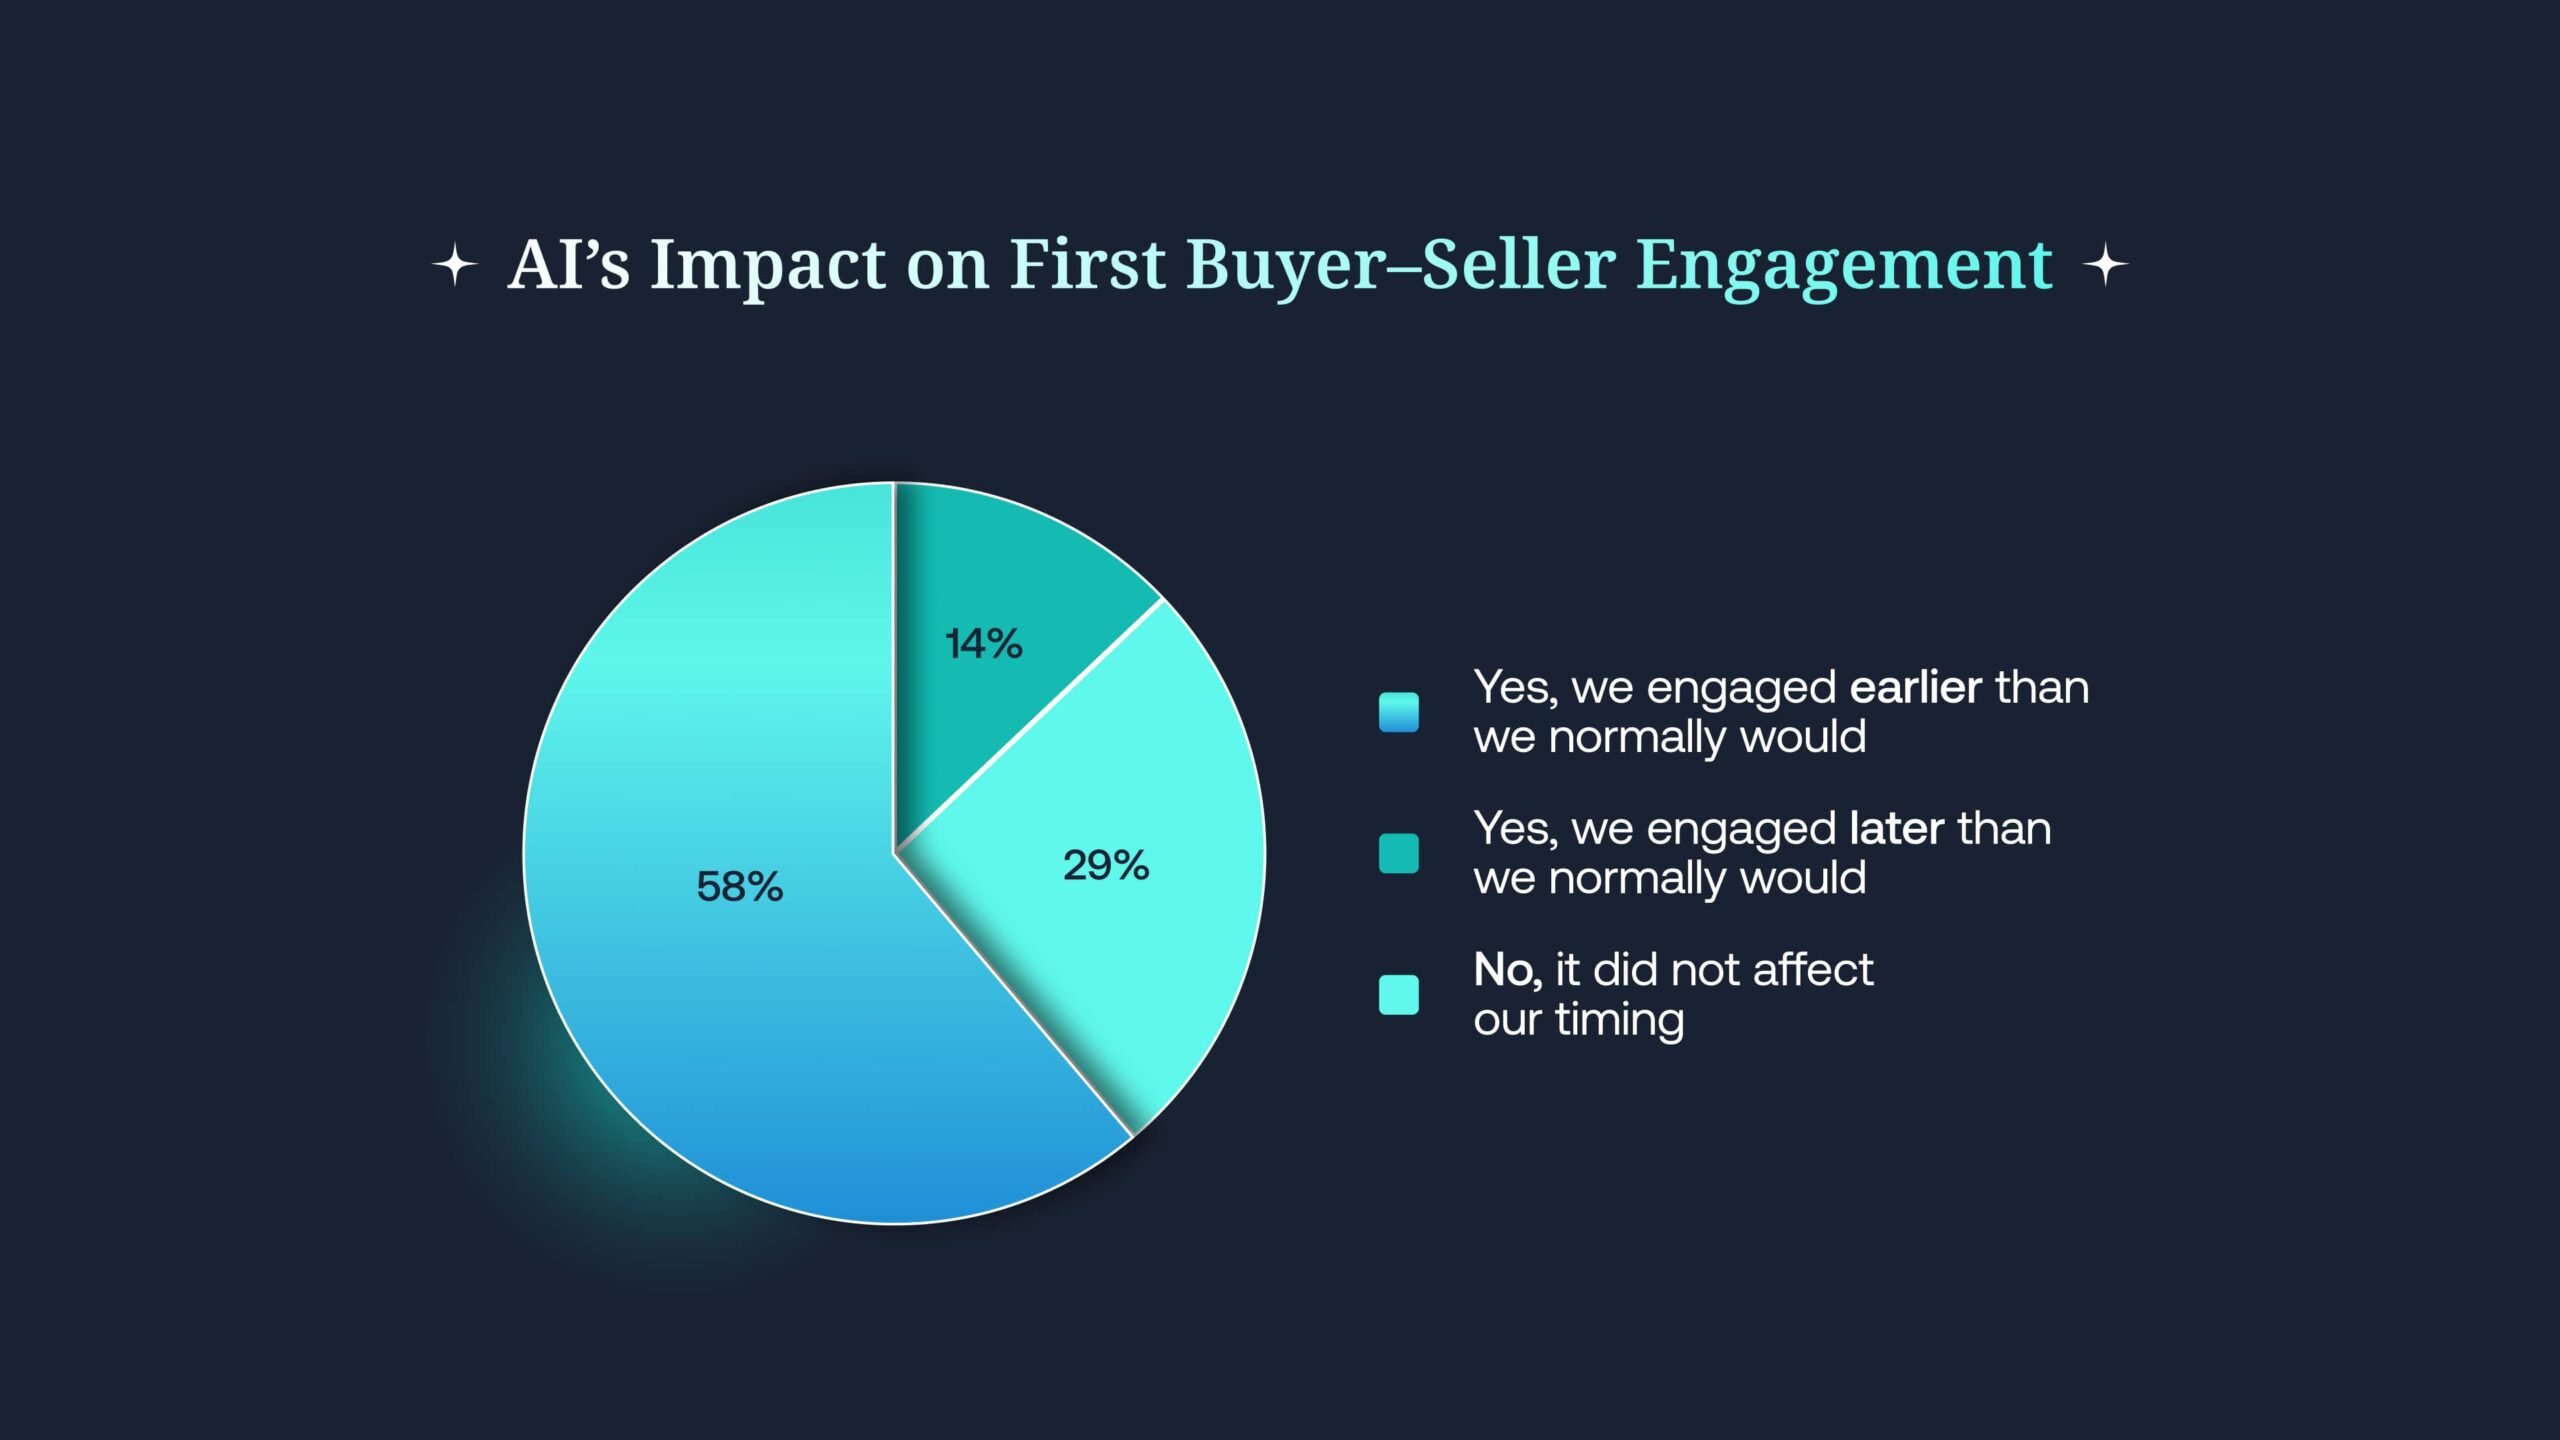

This uncertainty triggered the reversal of the two-decade trend toward greater buyer independence, and it reflects the fact that prior category experience (buyers bring a lot of it to the table) offers little guidance in evaluating AI’s impact on capabilities, particularly with respect to pricing, implementation, and security. Compounding the issue, most vendor websites do not yet provide the clarity buyers seek on these topics — leaving direct engagement as the only viable path for buyers.
Not Just AI Uncertainty, Economic Uncertainty
Economic conditions are also playing a role in compressing buying cycles and accelerating first contact with vendors. Nearly half of buyers (49%) said that economic uncertainty had led them to shorten their buying cycles. Organizations with approved budgets appeared eager to spend quickly, before potential pullbacks from tariffs, cost-cutting, or other macroeconomic risks.
Not only were cycles compressed, but 62% of buyers said they engaged with sellers earlier specifically because of economic uncertainty—further accelerating the buying process.
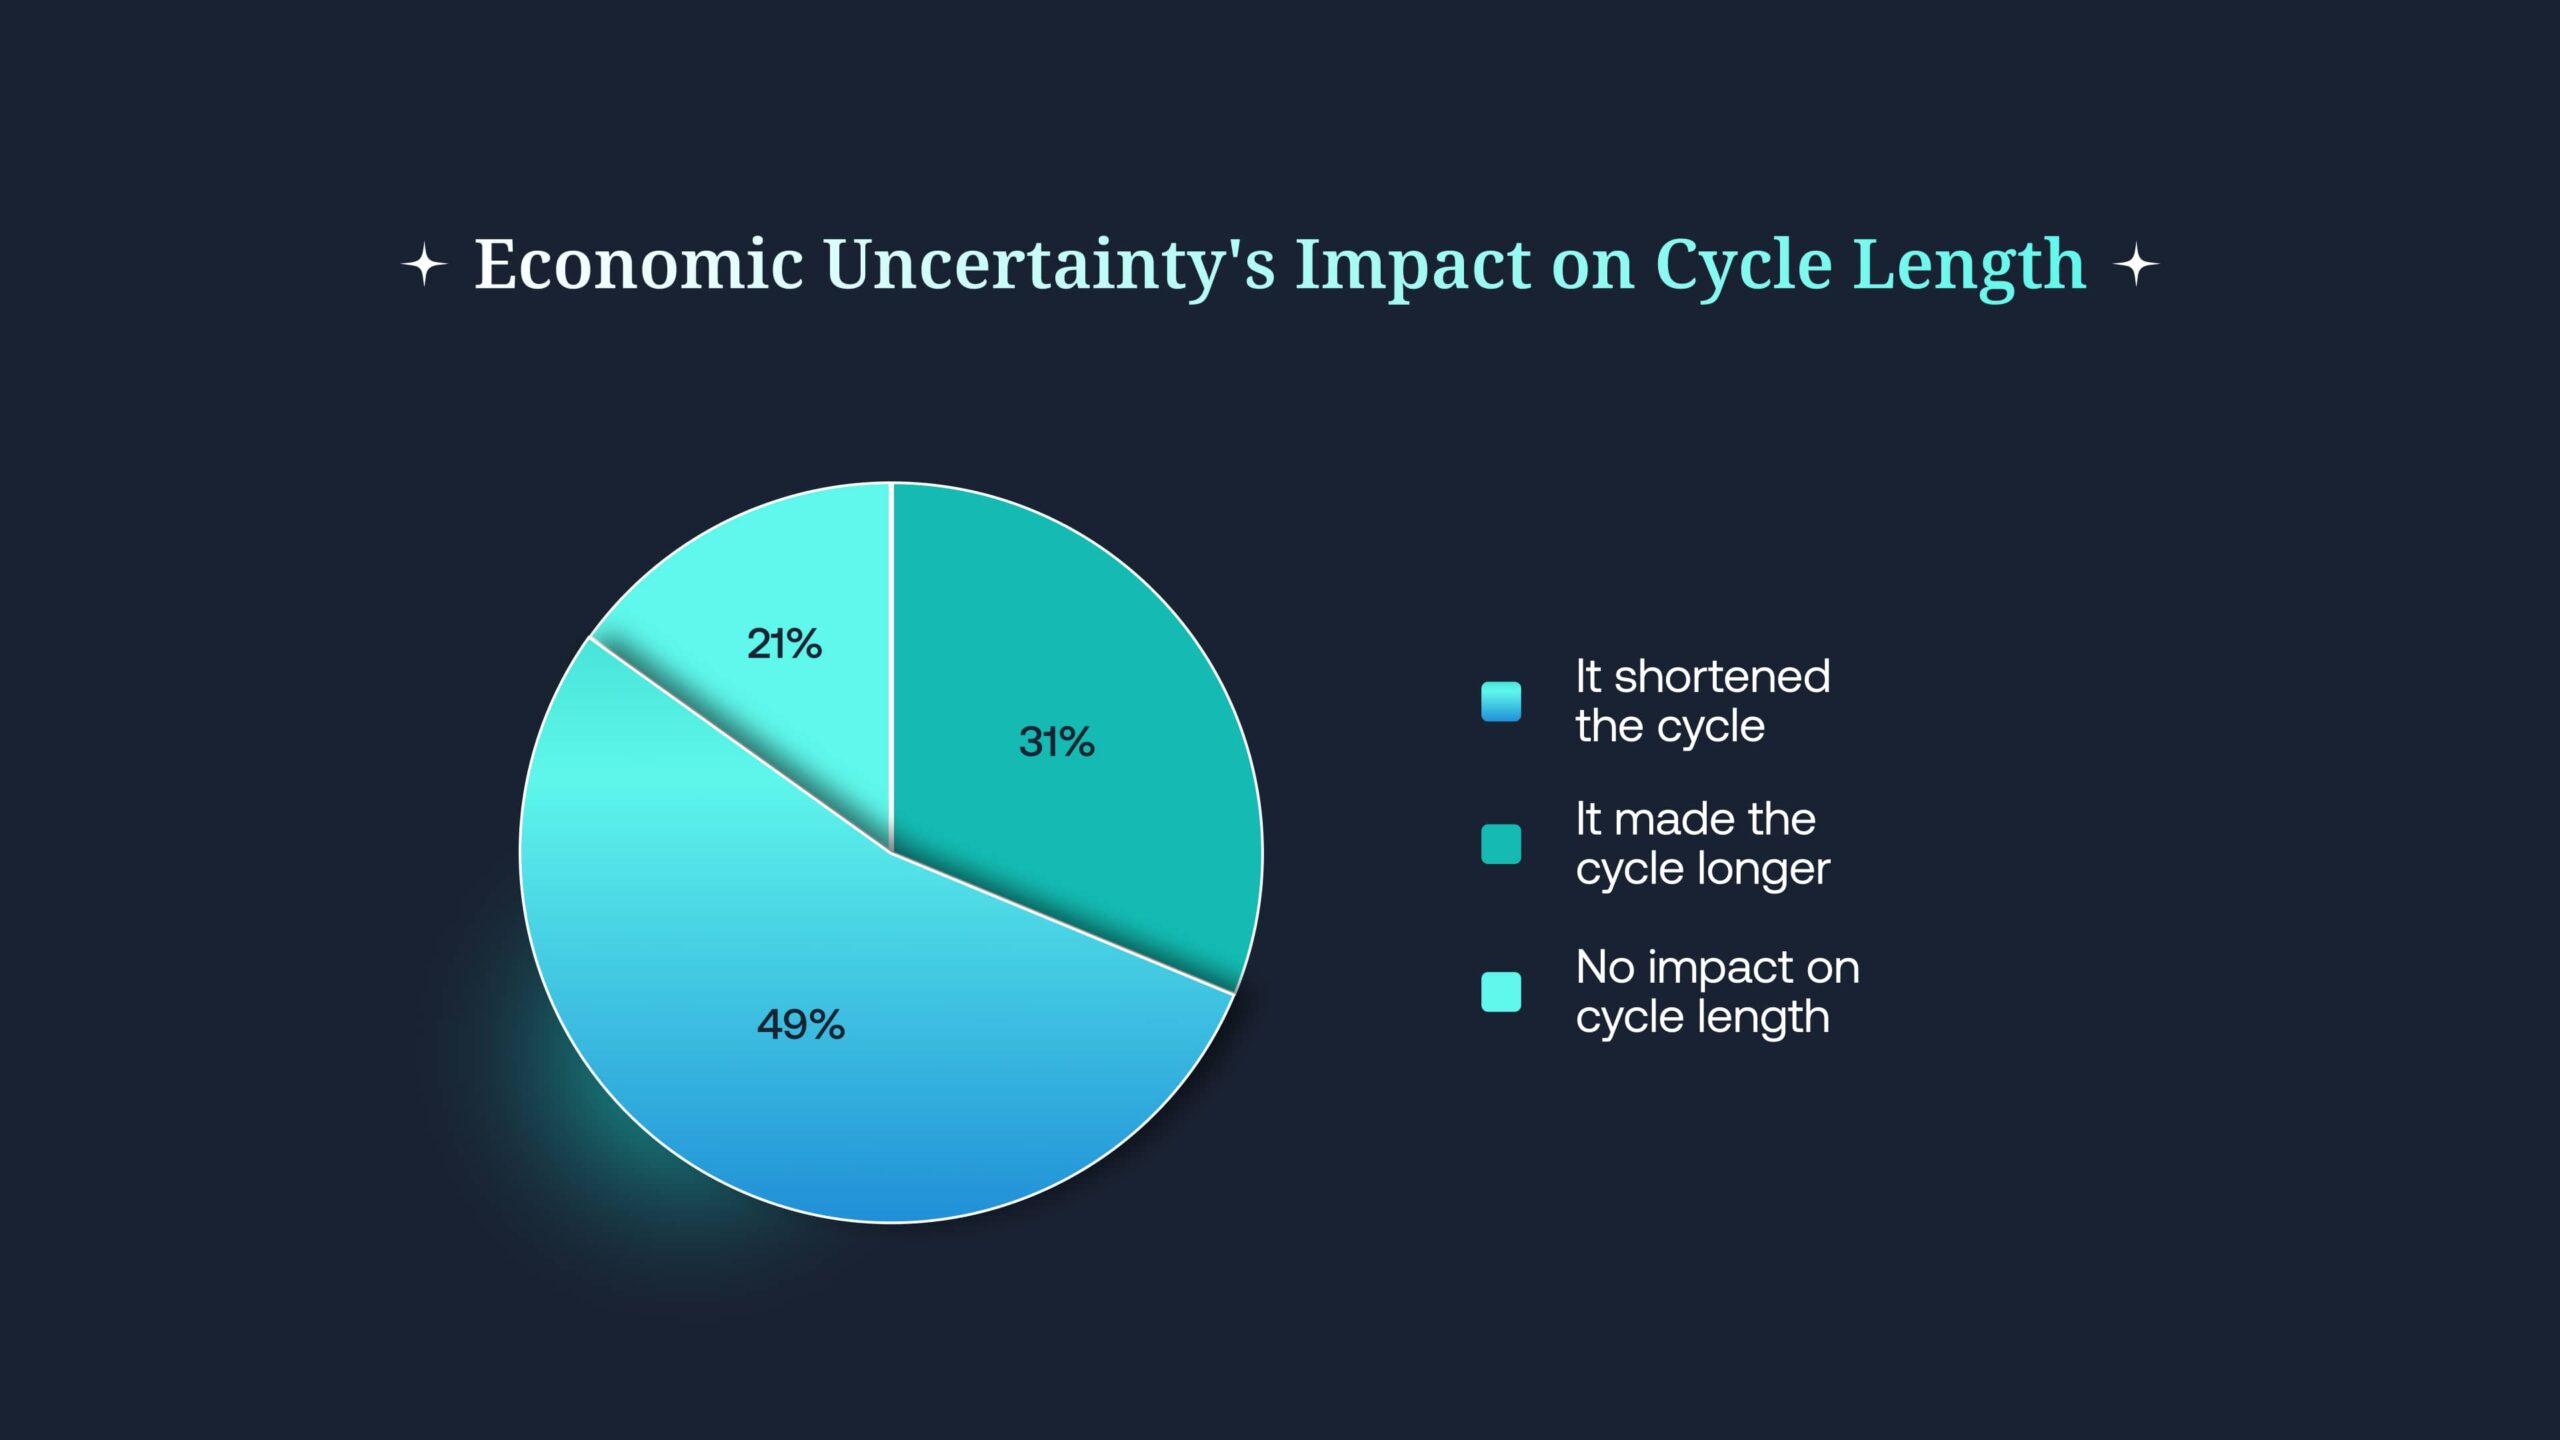
Our supplemental survey gave us not only an explanation for the changes we observed in the main study, but also a rare glimpse into how large-scale external forces can bend long-standing patterns in B2B buying. This also suggests that rather than a permanent realignment, changes may prove to be situational adjustments — though still adjustments that every revenue team must now recognize and adapt to.
Uncertain? Yes. Undecided? Not So Much: The ‘Plus ça Change’ of B2B Buying Today
As we’ve seen, buyers are reaching out to sellers sooner than they have in the past, largely to get answers about the AI capabilities inside the solutions they are evaluating. Economic uncertainty is also contributing, pushing buyers toward faster cycles while budgets are still within reach. These forces are shifting some mechanics of the journey — namely, when buyers make contact, how long cycles last, and how many vendors they evaluate.
What hasn’t changed is how decisions are made. Buyers still determine much of the outcome before sellers are ever contacted. In Europe, as elsewhere, earlier conversations with sellers rarely alter the initial preference for the vendor ranked first before contact.
In this section, we will examine country-level patterns in how buyers still set their preferences and make selections before seller contact.
Buyers in Europe Mostly or Fully Define Their Purchase Requirements Before Sellers Are Contacted
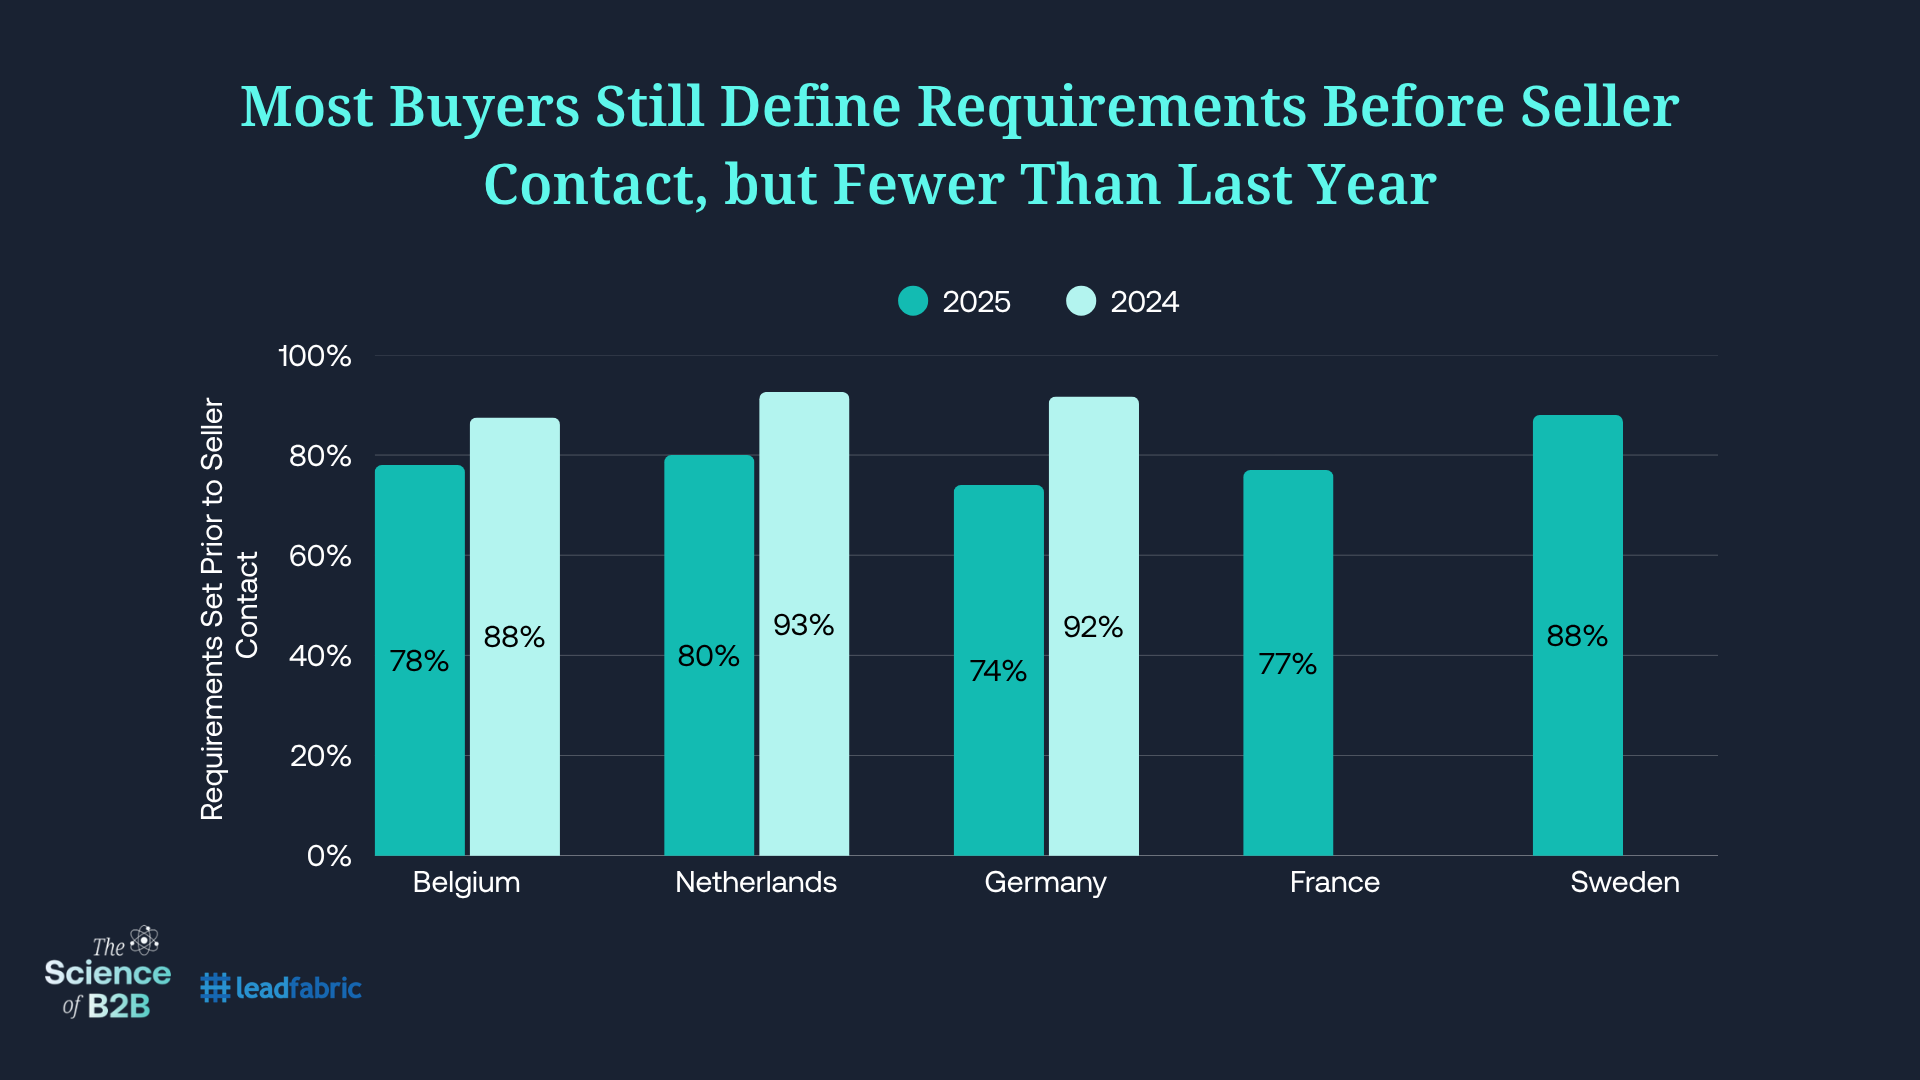
It is worth noting that the overall share of European buyers who mostly or fully define their purchase requirements before contacting sellers has declined since last year. In 2024, 91% reported doing so; this year that figure has dropped to 78%. While France and Sweden were not included in last year’s sample, the decline is evident across the countries measured in both years: Belgium fell from 87.5% to 78%, the Netherlands from 92.6% to 80%, and Germany from 91.7% to 74%. This tells us the change is not confined to a single market but seen more broadly across the region. Still, the overwhelming story remains the same: most European buyers continue to define their requirements in advance, ranging from 74% to 88% depending on the country (see figure below).
Buyers Are the Ones to Initiate Contact with Sellers
Most European buyers continue to take the lead in initiating contact with vendors. In 2025, 80% of engagements were buyer-initiated, down slightly from 87% last year. Germany and the Netherlands saw the largest declines—falling from 91% to 84% and from 85% to 74%, respectively—while buyers in Belgium initiated contact 85% of the time both years.

Despite Earlier Seller Engagement, Buyers Largely Choose a Winner Before Involving Sales
Given the heightened uncertainty buyers reported this year — and its substantial impact on the timing of first contact with sellers — one might reasonably expect buyers to be less certain about their vendor preferences before engaging in those conversations.
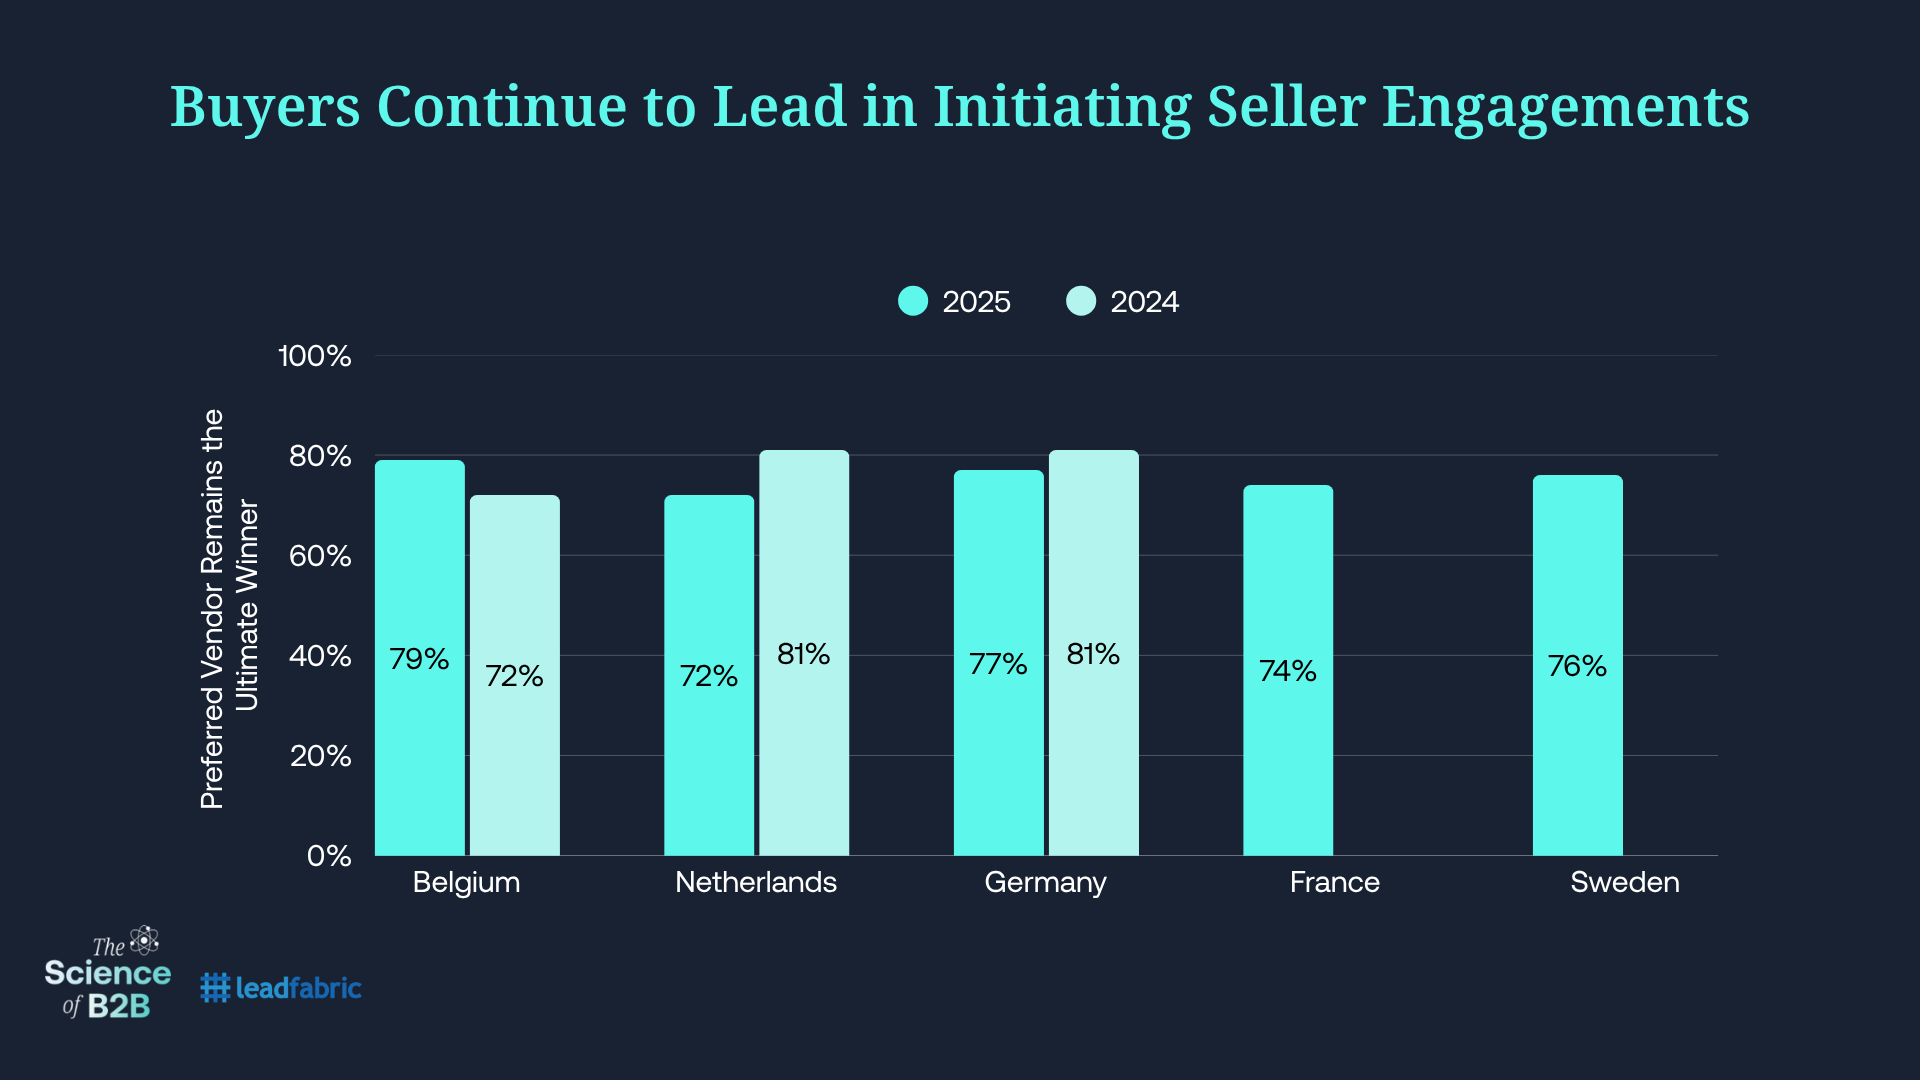
In reality, there has been little change in their certainty about vendor preference, if any at all. Across Europe, buyers stick with their top-ranked vendor 75% of the time, only slightly down from 79% last year. Belgium rose from 72% in 2024 to 79% in 2025, while Germany slipped modestly from 81% to 77%. The Netherlands showed the steepest decline—from 81% to 72%—yet even there, more than seven in ten buyers stayed with their first choice. As we see globally, being second place or lower at the time of first contact with European buyers leaves you facing an uphill battle.
In our supplemental study of North American and UK buyers, we found further evidence that teams identify and rank their top choice before engaging sellers. This year, we asked the most direct question yet: “Was your team able to put your shortlist in order of preference prior to engaging with sellers or SDRs?” A resounding 94% said yes. In other words, nearly every buying group enters first conversations with vendors already knowing who they prefer.
In the global study, close to 80% of buyers said they, not vendors, initiated the first interaction. It follows that they would also choose carefully the order of their first meetings. And with nearly 80% reporting that their first vendor conversation was indeed with the eventual winner, it seems clear that early meetings reflect months of prior research and established preferences, rather than persuasion in the moment.
To test this, we looked at the rare cases where buyers had not ordered their shortlist in advance. If early conversations were truly decisive, the first vendor should have won more than 80% of the time. Instead, when buyers had not ordered their shortlist before engaging with sellers, the first vendor contacted won just 57% of the time.
Buying groups spend months aligning on the ranking of their shortlist, and they most often do that before any seller interaction. Even when validation is still needed after first contact, the vendor ranked first at that moment goes on to win nearly 80% (75% in Europe) of the time. While preferences can shift, starting in second place or lower remains a steep disadvantage.
Why Buyers Can Fill Shortlists Early, Pick Winners On Their Own
In this year’s study, we asked buyers how many times in their careers they had been involved in a buying process for the category they were currently telling us about. We asked our participants to include both partial and completed buying journeys.
The global average was a staggering 8.7 partial or complete buying journeys across their careers. In Europe, that number is slightly, but not meaningfully lower at 8.3. Averages across the countries surveyed in Europe are listed below, with only Sweden displaying a markedly different pattern from others. Even in the case of Sweden, buyers must be considered extremely experienced in whichever category of solution they are considering in the present. This helps explain our findings that buyers are able to fill most of their shortlists on day one of the buying journey.
- Belgium – 8.8
- France – 8.1
- Germany – 8.9
- Netherlands – 8.2
- Sweden – 6.9
Implications
Similar to Global Trends, with Regional Variations
European buyers confirm the same core pattern observed globally: critical decisions are made before seller contact with Day One shortlists strongly predictive of final winners. In Europe, 92% of the time the winner is on that initial shortlist, and buyers stick with their top-ranked vendor roughly 75% of the time. The Selection and Validation Phases remain intact — buyers converge on a favorite first (Selection Phase), then validate that choice in vendor conversations (Validation Phase).
What’s different in Europe is the pace and shape of the journey. While the global cycle shortened by just over a month, Europe’s did not. The average journey trended slightly longer (from 9.0 to 9.8 months), with notable variation across markets. German and Dutch cycles expanded in line with the historic “more vendors = longer cycles” pattern, while Belgium broke from it, showing compressed cycles even as vendor counts held steady.
Earlier Contact, but Less Compression
Like their global peers, European buyers are reaching out to sellers sooner, with the Point of First Contact (POFC) moving from 67% to 58% of the journey. Yet earlier outreach has not translated into shorter cycles in Germany or the Netherlands. In Belgium, as we saw globally, buyers are doing “more” — evaluating more vendors — in shorter cycles.
AI Drives Earlier Conversations, But Not as a Research Tool
Nearly nine in ten European buyers use LLMs for research, but that hasn’t reduced reliance on traditional resources in the buying journey — such as viewing vendor content, speaking with sellers, or engaging trusted advisors. Buying groups in Europe averaged 15 interactions per person, per vendor this year (up from 14), and 72% engaged analysts or other consultants (up sharply from 59% last year).
Instead, what’s driving earlier engagement with sellers is the need to evaluate AI within the solutions buyers are acquiring. That is, buyers engage sellers earlier because they need clarity on AI inside the solutions themselves — capabilities, costs, security, and implementation. Prior experience offers little help here, and vendor websites often fall short, leaving direct conversations as the only option.
This distinction is important: in Europe, LLMs supplement traditional diligence rather than replace it. It is the presence of AI inside the solutions being purchased that compels buyers to reach out to sellers sooner.
Economic Pressures Reinforce Conservative Vendor Selection
Without question, economic uncertainty has prevented or prematurely ended countless buying cycles over the past year. However, our participants were describing recently completed buying cycles. When buying cycles were complete, they were completed quickly. Nearly half of buyers said economic conditions shortened cycles, and 62% said uncertainty accelerated seller contact. These pressures also influenced vendor selection: many buyers gravitated toward incumbents and known vendors.
Country-Level Nuances Matter
- Germany & Netherlands: The traditional “more vendors = bigger buying groups = longer cycles” pattern still holds. Both Germany and the Netherlands evaluated more vendors, had bigger buying groups and reliably longer cycles than last year.
- Belgium: Smaller groups, the same number of vendors, but shorter cycles — breaking from historic patterns and aligning more closely with the global trend of compression.
- France & Sweden: New to the sample this year, but broadly aligned with European averages — mid-sized groups, moderate cycles, and high levels of requirement definition before seller contact.
A Clear Mandate for B2B Revenue Teams
- Invest in capabilities to sense, interpret, and act on buying group signals early.
- Create and surface self-serve, high-value content that answers Selection Phase questions.
- Equip sellers and CSMs to build preference outside of active cycles.
- Measure success by shortlist placement and win rate — not raw lead counts.
In the modern B2B journey, the deal is most often won or lost before the first conversation — even more so in an AI-focused buying climate. The question for every revenue team is not whether to adapt, but how quickly and effectively they can do so.
Appendix
Methods
The European Buyer Experience Report is based on responses from 945 qualified B2B buyers across five countries: Belgium, France, Germany, the Netherlands, and Sweden. To qualify, respondents had to be directly involved in a purchase of at least $25,000 USD for their organization within the past two years.
Sample Composition
The European sample represents a cross-section of industries and solution types. While the mix of physical goods, software, and services purchases varied substantially between countries, the data are not intended to represent the population of purchases in each market. Rather, they reflect the categories of purchases captured by our sampling.
- Belgium: 38% purchased physical goods, 38% purchased services, and 24% purchased software.
- France: 32% purchased physical goods, 43% purchased services, and 25% purchased software.
- Germany: 33% purchased physical goods, 38% purchased services, 30% purchased software.
- Netherlands: 24% purchased physical goods, 54% purchased services, and 22% purchased software.
- Sweden: 36% purchased physical goods, 51% purchased services, and 13% purchased software.
Keep Reading
- “AI Inside” Is Catalyzing an Earlier Point of First Contact (POFC) for B2B Buyers and Sellers
- In It (Multiple Times) To Win It: Prior Evaluations Precede Most B2B Wins
- How Buyer Experience Offsets LLM-Induced Traffic Loss
- B2B Buyers Are Even Less of a Blank Slate Than We Thought
- Meet the B2B Buying Group: Who’s at the Table and What They Do
- Getting to Yes: Why Vendors Win & How Buying Groups Agree
- B2B Buying Under Economic Pressure in 2025
