

.
Table of Contents
Quick Read Summary
Despite the endless drip of LinkedIn posts announcing layoffs and budget cuts in B2B, BDRs are mostly thriving. BDRs told us that their organizations are either maintaining or expanding their BDR team and quotas – both indications that organizations are gearing up for growth.
And, despite aggressive targets, BDRs are maintaining and improving their goal attainment, while adhering to best practices. Eighty-five percent of BDRs report that they are building multiple relationships within each account they prospect into, a practice called multi-threading. This is true not only for Outbound BDRs, but also for Inbound BDRs who have not traditionally multi-threaded. We also found that nearly 40% of BDRs are already using one or more AI-based tools, with most BDRs finding these tools beneficial to their productivity.
However, for the second year in a row, BDRs feel less supported in their jobs. In particular, BDRs are less confident in two areas: 1) that leadership believes their role is important and 2) that they have the tools, training, and equipment to do what is expected of them. This finding requires action, as BDRs’ perception of support is highly correlated with their performance. Supported BDRs achieve higher quotas. Our report specifies solutions to the problem: BDRs want improved Contact and Intent Data.
Summary of Findings
- The majority (75%) of BDR organizations have either grown or maintained their size.
- Most BDRs (76%) report to the sales department, while the remaining report to Marketing.
- 85% of BDRs primarily or exclusively focus on outbound activities.
- While most companies maintained their quotas, a larger percentage (39%) raised them this year compared to last year’s 29%.
- Despite slightly higher quotas for 2024 compared to 2023, BDRs maintained their performance, achieving approximately 81% to 90% of their quota, similar to last year’s figures.
- BDRs engage in multithreading, with 83% reporting that they reach out to an average of 6.7 contacts for outbound prospecting and 4.8 contacts for inbound.
- There is no correlation between deal size and the number of contact attempts by BDRs, presenting an efficiency opportunity for organizations targeting smaller deals.
- 75% of BDRs indicate making the same or more attempts to engage with multithreaded contacts.
- BDRs typically make about 17 attempts per contact, with relatively equal distribution among social touches, calls, and emails.
- When BDRs have completed their work with a sales-ready prospect, approximately 69% are handing it over as an Opportunity to sales rather than a Lead or Account.
- BDRs’ reported sense of feeling supported has declined over the years, from 76% in 2022, 64% in 2023, to 58% in 2024.
- For the third consecutive year, BDRs who feel supported achieve higher quotas than those who do not.
- BDRs express a need for more encouragement from leadership and request contact and intent data to feel equipped to meet expectations.
- Among BDRs using AI, call transcription and email writing tools are the most utilized.
- A majority of BDRs (71.5%) receive minimal to moderate training on the AI tools they use.
- BDRs generally view AI tools positively, with 65% believing they enhance productivity, while less than 9% perceive them as a threat to their role’s future.
About the Report
This report is based on the survey responses of 280 BDRs and is organized into four main sections. First, we discuss the parameters of the job, including whether teams are growing or shrinking and where they report. Next, we report on BDR performance. Then we revisit how BDRs are being supported in their roles. Finally, we take on artificial intelligence (AI): how are BDRs using and feeling about AI-based tools?
Where appropriate, we compare what BDRs said about their roles this year to what they said last year.
Introduction
BDR productivity is often a bellwether for future company performance. While marketing can sometimes achieve its lead production goals even while buyer budgets are tightening, BDRs will struggle to convert those leads into sales-ready opportunities. This, more than marketing’s ability to generate interest, is a harbinger of future revenue shortfalls.
We are pleased to report that BDRs largely have good news to report about how the past year has gone. As we will see, however, there are notable exceptions.
Findings
The BDR Job
To begin, we set the context for the BDR role, looking at the growth of BDR teams, average tenure of BDRs, and where the organization reports.
A Majority of BDR Teams Grew (Again) in 2023

Source: 6sense
Given the volatility in B2B over the past two years, we wanted to know whether teams were shrinking, growing, or holding fast.
The answer is that teams are twice as likely to have grown over the past year than to have gotten smaller. Altogether, roughly three-quarters of teams have either grown or stayed the same size, indicating a healthy market for BDRs.
Job Tenure Remains Unchanged at About 18 Months in Current Role
Like last year, BDRs report that they’ve been in their current roles for just under 18 months. Their overall tenure in the position, around 24 months, suggests these are their second BDR positions.

Source: 6sense
Teams Largely Report to Sales
One of the most common questions organizations ask when strategizing about their BDR teams is, where should they report? As Figure 3 shows, 76% of BDRs surveyed report to sales. For last year’s respondents, 60% came from sales and 40% from marketing.
We cannot say for certain whether this change represents a shift in where BDRs report in the broader market, or simply a difference in our sample from this year.

Source: 6sense
BDRs Are Primarily Focused on Outbound Efforts, Even When Reporting to Marketing

Source: 6sense
Overall, 85% of BDRs are primarily or entirely focused on outbound activities. If they report to marketing, they are less likely to be focused primarily on outbound (71%). However, even BDRs reporting to marketing are primarily engaged in outreach that is not triggered by an inbound lead.

Source: 6sense
Quotas Are Largely Unchanged, but More Likely to Be Up Than Down
When a market experiences a slump, selling organizations operating in that market often lower or at least do not raise BDR quotas. This helps make goals more attainable for BDRs, buttressing BDR motivation. As with last year, we found that a majority of companies maintained their quotas, but a greater percentage of companies raised quotas this year compared to last. This statistically reliable difference suggests that companies had raised their expectations in 2023 compared 2022 (see Figure 6).

Source: 6sense
BDR Job Performance
Now that we have examined structural aspects of the BDR role, we turn our attention to what BDRs said about their performance over the past year. Here, as we shall see, the news is largely positive.
Quota Attainment Remained Steady, Despite Slightly Higher Quotas

Source: 6sense
A majority of BDRs reported higher quotas for the past year, but that did not hinder their quota attainment. Even though expectations were somewhat higher for 2023 than for 2022, those expectations were generally met.

Source: 6sense
We also noted that increased quotas were associated with a tendency toward higher quota attainment. In other words, increased expectations led to increased performance. Both BDRs with higher and those with lower quotas for 2023 reported quota attainment in the 71% to 80% range. However, those with decreased quotas came in at the very bottom of that range, while BDRs with increased quotas were near the top of that range.

Source: 6sense
This trend, as depicted in Figure 9, did not rise to statistical reliability, so we cannot conclude that this apparent trend would hold outside of our sample of BDRs. However, that appears to be due to the wide variability in BDRs’ reported quota attainment (the orange bars running through quota attainment averages indicates the substantial range of variability in BDR quota attainment).
Multi-threading Is the Norm
In B2B, the best practice for identifying sales-ready buying processes is to attempt to contact multiple individuals inside a prospect account before concluding that there is no opportunity present. This practice is commonly called multi-threading. Even when BDR activities are triggered by an inbound lead, follow-up on that lead should include reaching out to other individuals within the same account before concluding that there is no potential opportunity.

Source: 6sense
This year, 83% of the BDRs we surveyed reported that they multithread. Among BDRs that primarily follow-up on inbound leads, approximately half reported reaching out to two contacts, while the other half reach out to 3 or more.
Outbound-focused BDRs Multithread to More Contacts
Historically, outbound-focused BDRs have been much more likely to multithread than their inbound-focused counterparts. In fact, until recently, inbound-focused BDRs did not multithread at all. BDRs in our survey report that this has changed substantially. Inbound-focused BDRs are still not attempting as many contacts as their outbound peers, but the gap is relatively narrow (6.7 for outbound, 4.8 for inbound).

Source: 6sense
Deal Size Does Not Reliably Influence Contacts Attempted
Because we know that buying teams grow as deal sizes grow, we expected that deal size would also influence the number of contacts a BDR attempts. It also stands to reason that when the potential pay-off for diligent prospecting is greater, the investment would also be greater.
The data say otherwise, however. The number of contacts BDRs attempt varies randomly across the spectrum of deal sizes. This indicates that the number of contacts BDRs attempt is not related to how many contacts there are on a buying team or how big the potential deal is. This presents an opportunity for organizations pursuing smaller deal sizes to become more efficient.

Source: 6sense
We also asked BDRs whether they made the more, the same, or fewer attempts to each contact they tried. Seventy-five percent of BDRs said they made the same or more attempts to multithreaded contacts. While it is gratifying to find that BDRs are multithreading as a standard practice, it appears that BDRs are likely over-investing in multithreading to smaller buying teams.

Source: 6sense
Contact Attempts Are Distributed Evenly Across Three Channels
BDRs reported that they are making approximately 17 attempts per contact, with a relatively even spread among social touches, calls, and emails. The number of email attempts is reliably more than social attempts, though the difference is just two.

Source: 6sense
BDRs are reaching out to about 6 contacts when they work an account, which would mean that an account is getting 100 or more contact attempts to identify an opportunity. This is a significant investment.

Note: This data represents only BDRs who were inbound-focused.
Source: 6sense
BDRs Deliver Opportunities, Not Leads or Accounts, to Sales
When BDRs have completed their work with a sales-ready prospect, approximately 69% are handing over an opportunity to sales. This is true for both inbound- and outbound-focused BDRs. This matches last year’s figure. It is also highly consistent with the concept of multi-threading. When BDRs are identifying multiple buying team members, the opportunity object is the most appropriate CRM object to contain that intelligence.

Source: 6sense
BDRs Execute a Wide Array of Tactics When Contacting Prospects
While BDRs have been primarily focused on asking prospects for meetings, recent findings from our Buyer Experience Study suggest an alternative approach. That study found that buyers are extremely unlikely to accept meeting requests until they have already chosen a vendor.
Instead of pressuring buying group members for a demo or discovery call before they are ready, BDRs and sellers should focus on enabling buyers through education, insights, and experiences that will help buying groups progress in their buying journeys. Providers lose nothing, because buyers have made it clear that they will not interact directly until they are ready. At the same time, providers can establish themselves as value-adding partners.
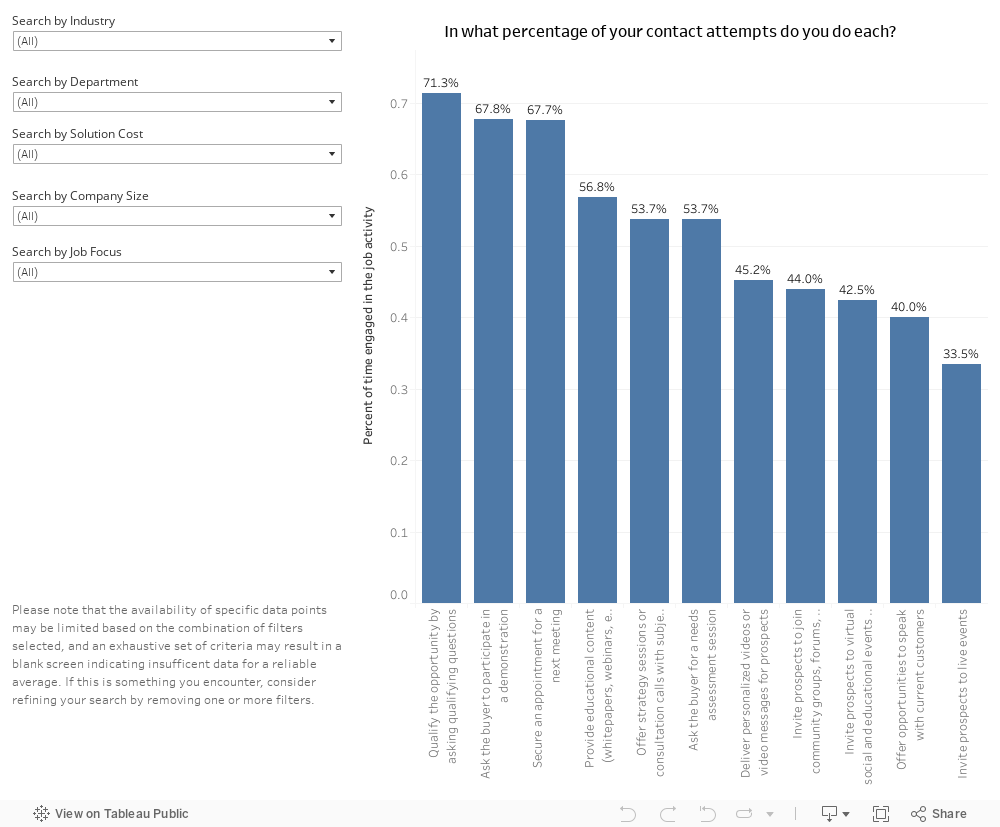
In the present study, we wanted to understand how often BDRs incorporate such activities into their processes. We found that BDRs still ask for meetings in about 70% of their contact attempts. However, relationship-building activities, such as providing educational content and inviting prospects to strategy sessions with subject-matter experts, aren’t far behind. These occur in slightly more than half of their calls. We encourage readers to explore the interactive table below to examine how factors such as the cost of the solution being sold, industry, and more impacts BDR contact strategies.
Interactive Table 1: Activities BDRs Engage In
BDRs Experience Decreased Support Once More: Tools and Leadership Drive The Drop
Each year that we survey BDRs we include four items from the acclaimed Gallup Employee Engagement Survey. The Gallup survey is often used in academic and professional research to assess employee engagement. Respondents rate the four items in our survey on a scale from Strongly Agree (7) to Strongly Disagree (1). When taken together, they form what we refer to as the Support Index, serving as an overall measure of how supported BDRs feel in their roles. Each item and their respective average scores are listed in the chart below.
| Survey Question | What the Item Measures | 2024 Average Score | 2023 Average Score | |
| 1 | I know what is expected of me in my role. | I know what to do. | 6.2 | 6.2 |
| 2 | I have the tools, training and equipment to do what is expected of me in my current role. | I believe I can do it. | 5.3 | 5.6 |
| 3 | Leadership of my company believes my role is highly valuable. | What I do matters to others/is important. | 5.6 | 5.9 |
| 4 | I believe my experience in this role will help me advance my career. | What I do matters to me. | 6.1 | 6.1 |
Note: The scores displayed above are out of a maximum possible score of 7, which represents “Strongly Agree”.
In 2022, 76% of BDRs responded that they Agree or Strongly Agree with the Support Index items. In 2023, this number dropped to 64%. In 2024, only 58% of BDRs Agree or Strongly Agree.

Source: 6sense
Not only are these scores indicative of how BDRs are feeling in their roles, but they are also highly correlated with BDR performance. BDRs who feel supported simply perform better than unsupported peers.

Source: 6sense
| 2022 Quota Attainment | 2023 Quota Attainment | 2024 Quota Attainment | |
| Supported | 4 | 3.7 | 4.1 |
| Not Supported | 2.6 | 3.1 | 3.3 |
Leadership Support and Adequate Tooling Weigh on Supported Scores
To better understand how the Supported Index impacts performance, we investigated each dimension of the Index. Here, we found that despite a troubling drop in the overall support score, BDRs report that they clearly understand what is expected of them, and that their current position will contribute to their career goals. This suggests that BDRs feel they are in the right role – one they can do, and one which serves their future goals.
However, when it comes to leadership support and the tools, training, and equipment to meet expectations, the story is different. To these items, BDRs only Somewhat Agree.
Lower Confidence In Tools Predicts Lower Quota Attainment
To test the impact of lower scores on Leadership Support and Tools on quota attainment, we compared the quota attainment of BDRs who answered Agree or Strongly Agree to either question with those who responded Somewhat Agree and below.
BDRs who reported lower scores on the Leadership Support dimension performed as well as their peers who felt better about leadership support.
However, BDRs who were not confident about their tooling performed significantly worse than their better-supported peers (see Figure 18 below). BDRs who feel they have the proper tools, training and equipment to meet expectations attain 6% to7% percentage points more than their unsupported peers.

Source: 6sense
The Tools BDRs Need to Feel Supported: Contact and Intent Data
To understand what BDRs thought was missing from the set of tools they had been provided, we asked all BDRs who indicated a response of Somewhat Agree or lower on the tools item of the Index to tell us what would help them feel better enabled.
Like last year, BDRs largely want better Contact and Intent Data. However, we saw a modest increase in demand for engagement and training tools, slightly narrowing the gap between these tools and the two most-requested tools.

Source: 6sense
Sales Engagement Platforms Foster Support; Support Fosters Quota Attainment
While using a Sales Engagement Platforms (SEP) does not directly lead to higher quota attainment, SEP’s still help indirectly. We found for the third year running that the use of Sales Engagement Platforms (SEP) is associated with higher scores on the Support Index. Higher scores on the support index – and specifically the tools item on the index – lead to greater quota attainment. Thus, SEPs serve as a means by which BDRs feel supported.

Source: 6sense
BDRs on Shrinking Teams Experience Shrinking Support
We saw above that teams tended to either be growing or staying the same size this year. Interestingly, we found that BDRs who said their teams had gotten smaller also had lower scores on the Support Index. It seems likely that teams in organizations that are not growing are less likely to be provided with the kinds of support that would lead to more success. This suggests an unfortunate downward cycle, where poor company performance in the present may foster worse performance in the future.

Source: 6sense
The Role of AI
Practical AI-based Tools Are Being Adopted Rapidly
AI-based tools are already broadly adopted by BDR teams. Thirty-nine percent of BDRs reported using an AI-based tool. BDRs that use AI tools at all tend to use more than one (average = 1.7). Approximately a quarter of BDRs we surveyed use AI-based call transcription in their jobs. A slightly lower percentage of respondents also use AI Email Writers, indicating that these two capabilities have caught on very quickly among BDRs. Other capabilities, such as Conversational Email and Call Coaching tools, were the next most used. Among other tools in use, BDRs cited AI-driven autodialers and ChatGPT-like tools.

Note: The teal bars indicate the percentage of BDRs using the AI tool. The dark blue bars indicate the percentage of usage of an AI tool among the BDRs that are using one. 24.6% of all BDRs reported using AI-based call transcription. Of the BDRs using an AI-based tool of some kind, 60% use call transcription.
Source: 6sense
BDRs Receive a Moderate Amount of Training AI-based Tools, And That Seems to Be Enough
BDRs that use at least one AI tool report that they have largely had a minimal (33.0%) or moderate (38.5%) amount of training on AI tools. For the tools considered here, this may be sufficient, and does not appear to have a substantial impact on attitudes toward AI usage.

Source: 6sense
BDRs Feel That AI-based Tools Will Help Their Productivity – Or At Least Do No Harm
Nearly two-thirds of BDRs have a positive attitude toward AI tools, believing that they make the role more productive. Of the 34.5% that do not believe they make the job more productive; most (25.7%) do not think they are a meaningful factor and a small minority (8.9%) feel they are a threat to the future of the role. Interestingly, whether a BDR is currently using AI tools or not has no impact on their attitudes toward AI tools.

Source: 6sense
Implications
BDRs are mostly thriving. Quotas are up, but BDRs are hitting them. Teams are more likely to be growing than to be shrinking. And, best practices, such as reaching out to multiple buying group members and delivering opportunities to sales, rather than leads, have become ubiquitous.
BDRs are no longer just mining for meetings. They are inviting buying team members to learning and networking experiences and delivering value-adding content – tactics that position their companies as partners rather than suppliers.
And BDRs are adopting AI-based solutions with gusto. Far from fearing AI, BDRs are embracing it.
That is the good news.
Our annual Support Index, however, issues a warning. The Support Index gauges how BDRs feel about their jobs. We understand that how BDRs feel may not merit much attention from BDR leaders on its own.
However, what matters about the BDR Support Index is that it predicts BDR performance. BDRs who feel supported outperform those who do not. That has been the case in all three years we have conducted the survey. Since 2021, the percentage of BDRs who report feeling supported has dropped from 75% to 58%.
So, while BDRs are still making their quotas, the collapsing Support Index suggests there is trouble ahead. The pin that let the air out of the Support Index is tools: BDRs do not feel that they have the right tools to meet expectations. Like last year, they want better contact and intent data above all.
There are ample resources available in the marketplace to augment BDR contact and intent data tools. It is the role of BDR leadership to end the downward trend in BDR support – not to make BDRs feel better, but to make them more productive.
We hope you enjoyed the report. If you’re a BDR, we would still love to hear from you about your experience. It’s never too late to add your voice. The survey just takes a few minutes and there’s a $10 Uber Eats in it for you.
Appendix
Survey Sample
6sense Research surveyed 280 pre-sales BDRs. BDRs were recruited across geographies and industries. However, most respondents represent technology and software companies in North America. For a detailed breakdown of respondent demo/firmographics, please refer to the charts below.


| Finding | Statistical Test | Statistic | Significance Level | Effect Size | Sample Size |
| As with last year, we found that most companies maintained their quotas, but a greater percentage of companies raised them this year than last. This statistically reliable difference suggests that companies had raised their expectations in 2023 compared 2022. | ANOVA | F=3.729 | P=.025 | N2=.013 | 592 |
| BDRs’ quota attainment this year is comparable to last year. | ANOVA | F=1.505 | P=.222 | N2=.003 | 962 |
| Increased quotas were associated with a tendency toward higher quota attainment. This trend did not rise to statistical reliability. | ANOVA | F=.728 | P=.484 | N2=.007 | 206 |
| BDRs reported making about 17 attempts per contact, with a relatively even spread among social touches, calls, and emails. The number of email attempts is reliably more than social attempts, though the difference is just two. | Repeated Measure ANOVA | F=5.28 | P=.007 | N2=.134 | 35 |
| It appears that BDRs are likely over-investing in multithreading to smaller buying teams | ANOVA | F=2.492 | P=.014 | N2=.10 | 189 |
| BDRs’ responses to the overall Support Index have declined since last year. | T-test | T=2.417 | P=.01 | Cohen’s d=.216 | 586 |
| BDRs’ responses to the statement “I have the tools, training and equipment to do what is expected of me in my role” have declined since last year. | T-test | T=2.07 | P=.03 | Cohen’s d=.18 | 572 |
| BDRs’ responses to the statement “Leadership of my company believes my role is highly valuable” have declined since last year. | T-test | T=2.15 | P=.03 | Cohen’s d=.19 | 573 |
| BDRs’ responses to the statement “I know what is expected of me in my role” reflect last year’s responses. | T-test | T=.470 | P=.63 | Cohen’s d=.04 | 583 |
| BDRs’ responses to the statement “I believe my experience in this role will help me advance my career.” | T-test | T=.430 | P=.66 | Cohen’s d=.03 | 577 |
| Once again, this year, we found that higher scores on the supported index are associated with higher quota attainment. | Correlation | R=.144 | P=.04 | Fisher’s z=.07 | 203 |
| Having a SEP is not associated directly with higher quota attainment. | T-test | T=-1.33 | P= .193 | Cohen’s d=-.31 | 193 |
| Having a SEP is associated with higher scores on the Support Index. | T-test | T=-3.13 | P=.004 | Cohen’s d=-.68 | 193 |
| Teams that have gotten smaller have reliably lower scores on the Support Index. | ANOVA | F=7.93 | P<.001 | N2=.07 | 203 |