
By Kerry Cunningham, 6sense Research & Thought Leadership
From the results of our 2022 State of the BDR survey (see this blog post from last year), we reported that it was a “golden age” for BDRs. Just a year later, that gold is still shining … but it’s a bit tarnished.
The 500 BDRs who recently responded to our 2023 survey tell us they’re still hitting their quotas for opportunities delivered to sales, but they’re also hinting that it’s getting harder and may not last.
Keep reading to understand what BDRs told us this year, and what it means for BDR leaders and their companies. (You can also find the full 2023 State of the BDR Report here.)
Findings Summary
- BDRs say they’re still making their goals
- But nearly half say hitting goals is harder now than it was last year
- BDRs also feel less supported than they did last year
- This drop in overall support is largely driven by a decreased sense that they have all they need to succeed in their jobs
- When asked, BDRs say that what would help them most is better contact and intent data, while better account data, training and engagement tools lag behind
The Survey
For this year’s survey, we asked 500 BDRs to tell us how their jobs were going. Of course, we asked whether they were hitting their goals, and — new for this year — whether attaining goals now was harder, easier, or about the same as a year ago.
Last year, we introduced the BDR Support Index, and this year we asked the same questions. This allows us to gauge whether the economic uncertainty we have all experienced might also be impacting how supported BDRs feel in their jobs.
The Results: A Golden Age In Decline… But First, the Good News
Making Their Numbers
Like sales roles, the BDR role is all about performance. So, are BDRs making their goals for producing qualified deals for sales to work?
Yes. But…
To understand whether BDRs are hitting quota, we asked them to report their quota attainment on a scale from 1 to 5, with 5 being 100% or better and 1 being 50% and below. Last year, BDRs reported a robust 3.7 out of 5 on the quota scale, equating to just under 80% quota attainment on average. This year, the trend is downward (3.5 out of 5), but that drop is not enough to be statistically reliable.
So far, so good.
But How Does That Make BDRs Feel?
Last year, we dubbed the time we are in now as the “golden age” for BDRs, based primarily on what BDRs told us about how supported they feel in their jobs.
To understand how supported they felt this year, we asked BDRs to rate their agreement with the following statements, from Strongly Agree (7) down to Strongly Disagree (1).
| Survey Question | Translation | |
|---|---|---|
| 1 | I know what is expected of me in my role. | I know what to do. |
| 2 | I have the tools, training and equipment to do what is expected of me in my current role. | I believe I can do it. |
| 3 | Leadership of my company believes my role is highly valuable. | What I do matters to others/is important. |
| 4 | I believe my experience in this role will help me advance my career. | What I do matters to me. |
If employees can’t say they Agree or Strongly Agree (at least a 6 on our scale) to the first two questions, you won’t get their best effort or results … and you probably won’t have them for long.
The next two questions probe whether BDRs think their work is meaningful. To be “meaningful,” we need to feel that our work matters to the people we work for and with. It also matters that the work we’re doing is consistent with our personal goals and values.
Taken together, these four questions correlate with BDR performance. Higher scores on the support index tend to be accompanied by better performance in hitting goals. Last year, a massive 76% of BDRs reported feeling supported (6 or higher on the Supported Index). Last year, these BDRs scored a 4 out of 5 on our quota scale, equating to hitting quota at 80% plus.
But BDRs who felt less supported only scored 2.7 out of 5 on the quota scale, amounting to quota attainment in the range of 61% to 70%. Clearly, feeling supported made a big, statistically reliable difference in performance last year.
This year, the story is different. Only 64% of BDRs reported feeling supported.
This is a substantial drop (see stats in Appendix x; x2 = 12.47, p<.001). So far, though, we have not seen a commensurate dip in quota attainment; lower support scores can be expected to lead to both weaker performance and higher attrition going forward. Feeling supported and attaining quota are still positively correlated, but the relationship has weakened, as the gap between the performance of supported and non-supported reps has closed.
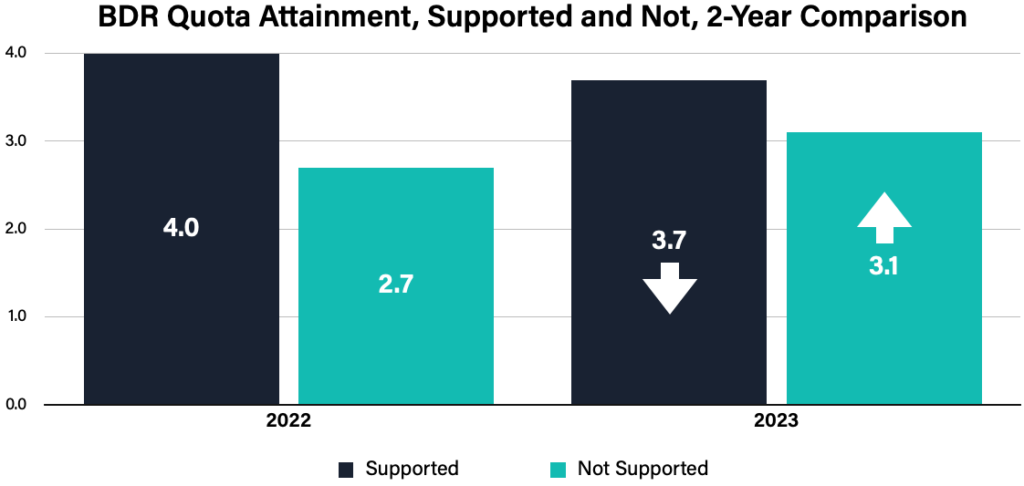
Note: Quota attainment for Supported reps from our 2022 and 2023 samples was not significantly different. However, the quota attainment for Not Supported reps was significantly different, with this year’s Not Supported reps outperforming last year’s.
BDRs Know What To Do — They’re Just Not As Sure They Can Do It
We can shed some light on why overall support index scores are down by examining the first two questions that make up the index.
Here, we find that BDRs are still clear about what is expected of them, but they’re much less likely to agree that they have the tools, training, and equipment to do what is expected of them.
Last year, BDRs told us that, on average, they felt as though they had what they needed to do their jobs (6.2 out of 7). This year, however, the average BDR is reliably less certain (5.7 out of 7) to feel that way. (Please refer to the Appendix for supporting statistics.) This puts BDRs somewhere below Agree on average. This is not an earth-shaking drop, but it is worrisome.
To understand what BDRs felt they needed, we asked BDRs to rank what they thought would help. Here:
- 71% of BDRs said that better contact data was their first or second choice to improve productivity
- 70% said the same about better intent data
- The other items we asked about (account data, engagement tools, training) trailed well behind contact and intent data
What Does It Mean?
The good news is that BDRs are still making their numbers. However, their responses to our survey suggest that making their numbers has gotten harder.
We know that it is not harder due to increased quotas, because we asked. Instead, the extra difficulty likely stems from recent weaker economic conditions. The tools a BDR could succeed with in early 2022 no longer feel sufficient.
Fortunately, BDRs were clear about what would help: Better contact and intent data. In some cases, it may be that their organizations have cut back on their spend in this area, hoping BDRs could get by with less. In others, it is probably the case that the contact and intent data were never great, but good enough when the market was going full steam.
Either way, organizations should listen to the clear message from BDRs before performance is further eroded.
We learned a lot more about how BDRs are doing and feeling about how they’re doing. You can learn even more in our 2023 State of the BDR Report.
Appendix: Statistics In This Report
| Finding | Statistical Test | Statistic | Significance Level | Effect Size | Sample size |
|---|---|---|---|---|---|
| This year, the trend is downward (3.5 out of 5), but that drop is not enough to be statistically reliable. | Welch’s T-test | T = 1.24 | P = .215, ns | n/a | 756 |
| BDRs feel somewhat less supported this year than last, 64% this year compared to 76% last year. | Chi-square test | X2 = 12.4 | p < .001 | Cramer’s V = .129 | 743 |
| In 2023, quota attainment for Supported reps trended down, while quota attainment for NotSupported reps was reliably better (m = 3.1) than NotSupported reps in 2022 (m = 2.7). | ANOVA | t = -2.87 | pTukey = .022 | Cohen’ d = -.305 | 740 |
| Last year, BDRs told us that on average they felt as though they had what they needed to do their jobs (6.2 out of 7). This year, however, the average BDR is reliably less certain (5.7 out of 7) to feel that way. | Welch’s T-test | T = 5.7 | P = <.001 | Cohen’s D = .42 | 726 |
| 48.3% of BDRs said that better contact data was their first or second choice to improve productivity, and 48.1% said the same about better intent data. Other items had percentages of 38% or lower. | Averages derived by counting instances where an item was ranked 1 or 2 for importance. | Contact data = 48.3Intent data = 46.1Account data = 32.5Training = 39.5Engagement tools = 33.8 |