More
Template is not defined.
2023 Annual Report

How Much Are Marketers Making?

2023 Compensation Report for B2B Marketing Roles 6sense Research

Introduction

Last year, 6sense Research surveyed hundreds of CMOs — in collaboration with hyper-growth CMO advisor Carilu Dietrich — to understand how senior-level B2B marketing leaders were monetarily compensated for their work. We asked about respondents’ exact earnings and looked for trends in pay based on factors such as gender, company financing, tenure, and more.

  • LAST YEAR'S STUDY:

  • Male and female marketing leaders received equal pay

  • The least-tenured CMOs made the highest total compensation, on average

  • CMOs employed among venture capital-backed, private equity-backed, and publicly traded companies earned equal pay, on average

  • Privately financed companies offered the least in total compensation

  • Company size didn't play a significant role in compensation

This year, we expanded our study to include B2B marketers of all seniority levels, aiming to provide a comprehensive view of the industry’s compensation landscape. We also added more questions to the survey, enabling us to analyze compensation from a wider array of perspectives and angles that might influence marketers’ earnings. These include factors such as education level, remote work arrangements, hybrid setups, company financial performance, and more.

We also asked respondents to tell us how important the components of their total compensation were and how satisfied they were with each. Furthermore, we asked them to report how often they discussed their pay with friends, family, and colleagues.

This enhanced approach allows us to offer marketing professionals a robust benchmark and a valuable resource for understanding pay trends and the intricate nuances of compensation in the field.

Chapter 1

Methods

656 RESPONDENTS

Sample and Participants

656 respondents participated in this survey. The respondents consisted of B2B marketing professionals spanning a variety of industries, marketing disciplines, and organizational levels — from individual contributors to Chief Marketing Officers (CMOs).

Industries

Our sample included participants from Technology and Software, Manufacturing, Business Services, Professional Services, and Financial Services industries. It is important to note that most of the respondents were based in North America.

Individual Contributor Manager Director VP & Above Total
Business Services 38 32 23 18 111
Financial Services 10 18 16 16 60
Manufacturing 20 48 36 19 123
Other 41 19 9 16 85
Professional Services 28 24 26 20 98
Tech & Software 36 46 33 64 179
Total 173 187 143 153 656

Demographics

In our survey, 64% of respondents identified as women, while 36% identified as men. Regarding marketing experience, 43% of the participants reported having four to five years of experience. The remaining portion of our sample was fairly evenly distributed among marketers with less than a year of experience, one to two years, two to three years, and three to four years.

Education

The sample represented a range of education levels, with 8% holding a high school diploma, 11% having an associate’s degree, 55% holding a bachelor’s degree, and 26% having a master’s degree.

Work Modalities

Among the respondents, 35% were remote workers, 20% worked in-person, and 45% had a hybrid work arrangement.

Company Funding

The sample included respondents from companies with diverse funding types. About 21% of the companies were private equity (PE)-backed, 20% were venture capital (VC)-backed, 36% were privately funded, and 22% were publicly funded.

Total Compensation Calculation

Throughout this report, we’ll make frequent references to the term total annual compensation. Below is a description of this measure and how it is calculated.

To provide a comprehensive understanding of our respondents’ earnings, we collected information on their base salaries, annual bonus percentages, and whether they received equity (shares of ownership) as a part of their compensation. For participants who receive equity, we asked them to disclose the total value of their equity and the vesting period — the expected time it will take for it to become realized.

To calculate the annualized value of equity, we divided the total expected value of their equity by the length in years of the vesting period. This annualized equity value was then included in the calculation of their total annual compensation, along with annual base salary and annual bonus percentage.

It’s important to note that the actual realization of equity varies widely for reasons that are largely beyond an employee’s control. However, for the purpose of reporting “total annual compensation,” we treated the equity as if it became realized at a consistent rate on an annual basis. This approach allows us to present a comprehensive measure of earnings that incorporates the potential value of equity over time.

Chapter 2

Findings

Several factors come into play when determining how much an individual earns. In our study, we measured 10 factors that might be expected to influence compensation. (Mouse over each term to discover how we defined each term for our survey.)

  • Position Level
    Job rank in organization (manager, director, etc.).
  • Tenure
    Years of experience in marketing.
  • Industry
    Tech, Manufacturing, etc.
  • Company Financial Backing
    Private equity, venture capital, publicly traded, etc.
  • Work Modality
    Remote, Hybrid, or In-Person.
  • Gender
    Self-identified gender.
  • Education Level
    Highest level of education obtained.
  • Marketing Discipline
    Customer Marketing, Digital Marketing, Brand, etc.
  • Company Fiscal Health
    Whether the company met financial expectations in the past year.
  • Company Annual Revenue
    Yearly income generated by the company.

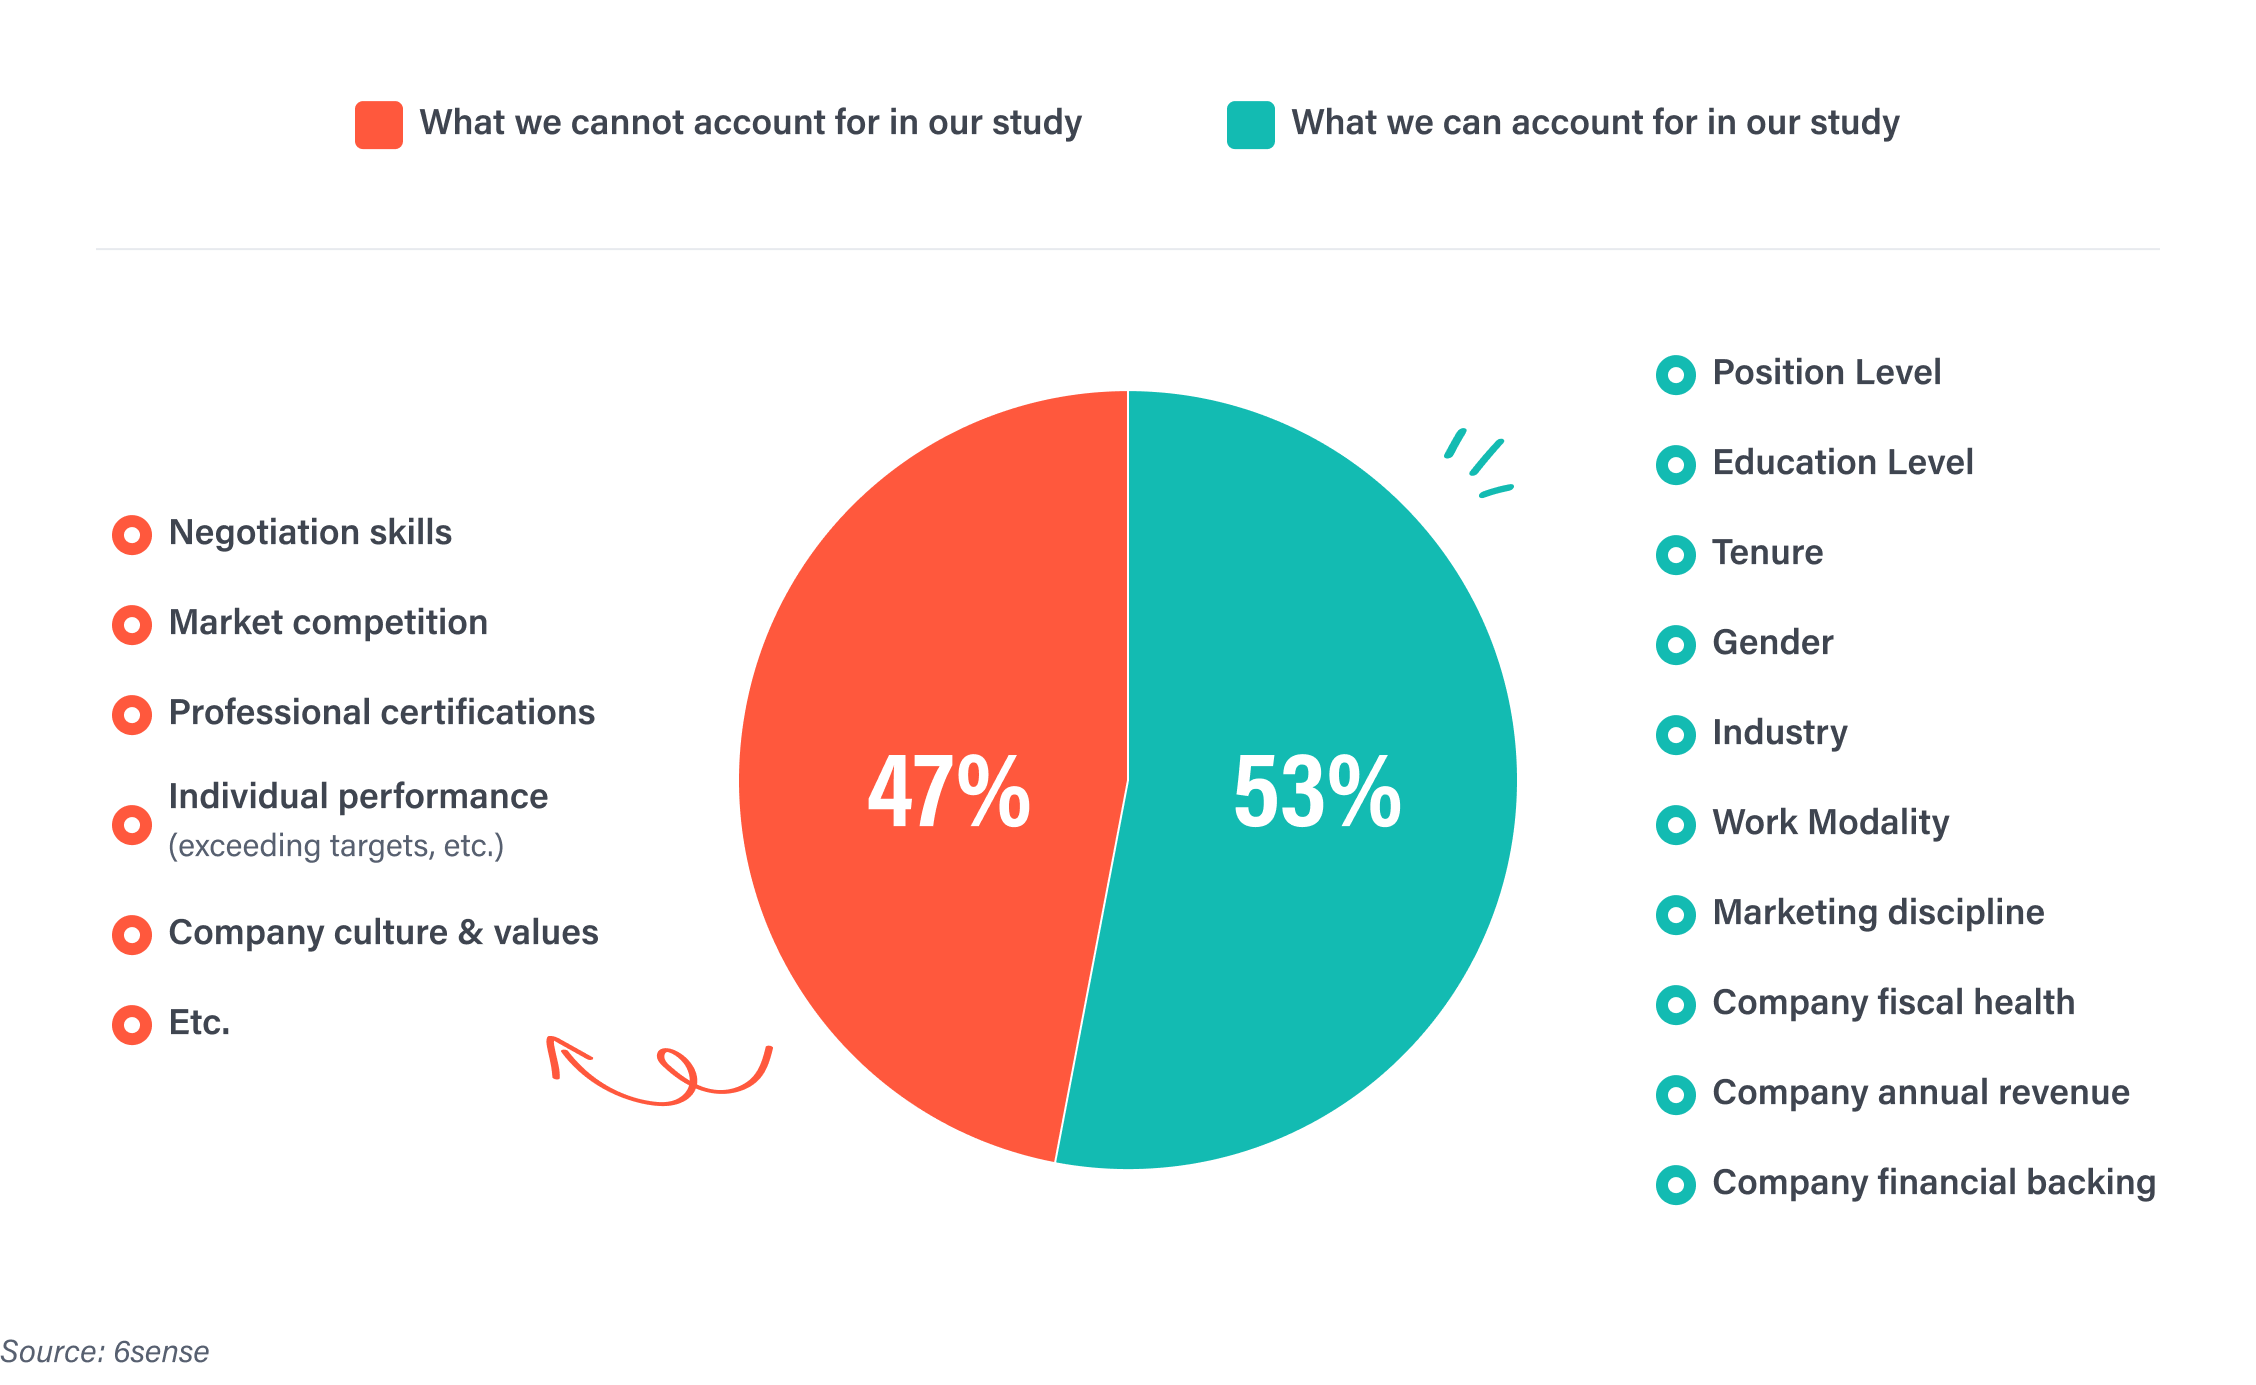
Our analysis revealed that these 10 factors collectively account for more than half (53%) of the variation, or differences, observed in marketers’ compensation.

While some variables can be easily defined and studied, others are less so, such as negotiation skills, past performance, and achievements in previous roles (see chart below). These additional elements contribute to the 47% of the variation in compensation left unexplained by our study. Thus, when interpreting our findings for individual cases, it’s important to consider the influence of these additional factors that shape compensation dynamics.

Despite the unexplained variability in earnings, understanding more than half of the reason why marketers are paid differently is truly remarkable. Throughout this report, we will measure and compare the specific impact that each of the ten factors has on compensation.

Below, highlighted in dark blue, are the factors that reliably influence marketers’ pay. Click to jump to that section.

Gender Pay Equity

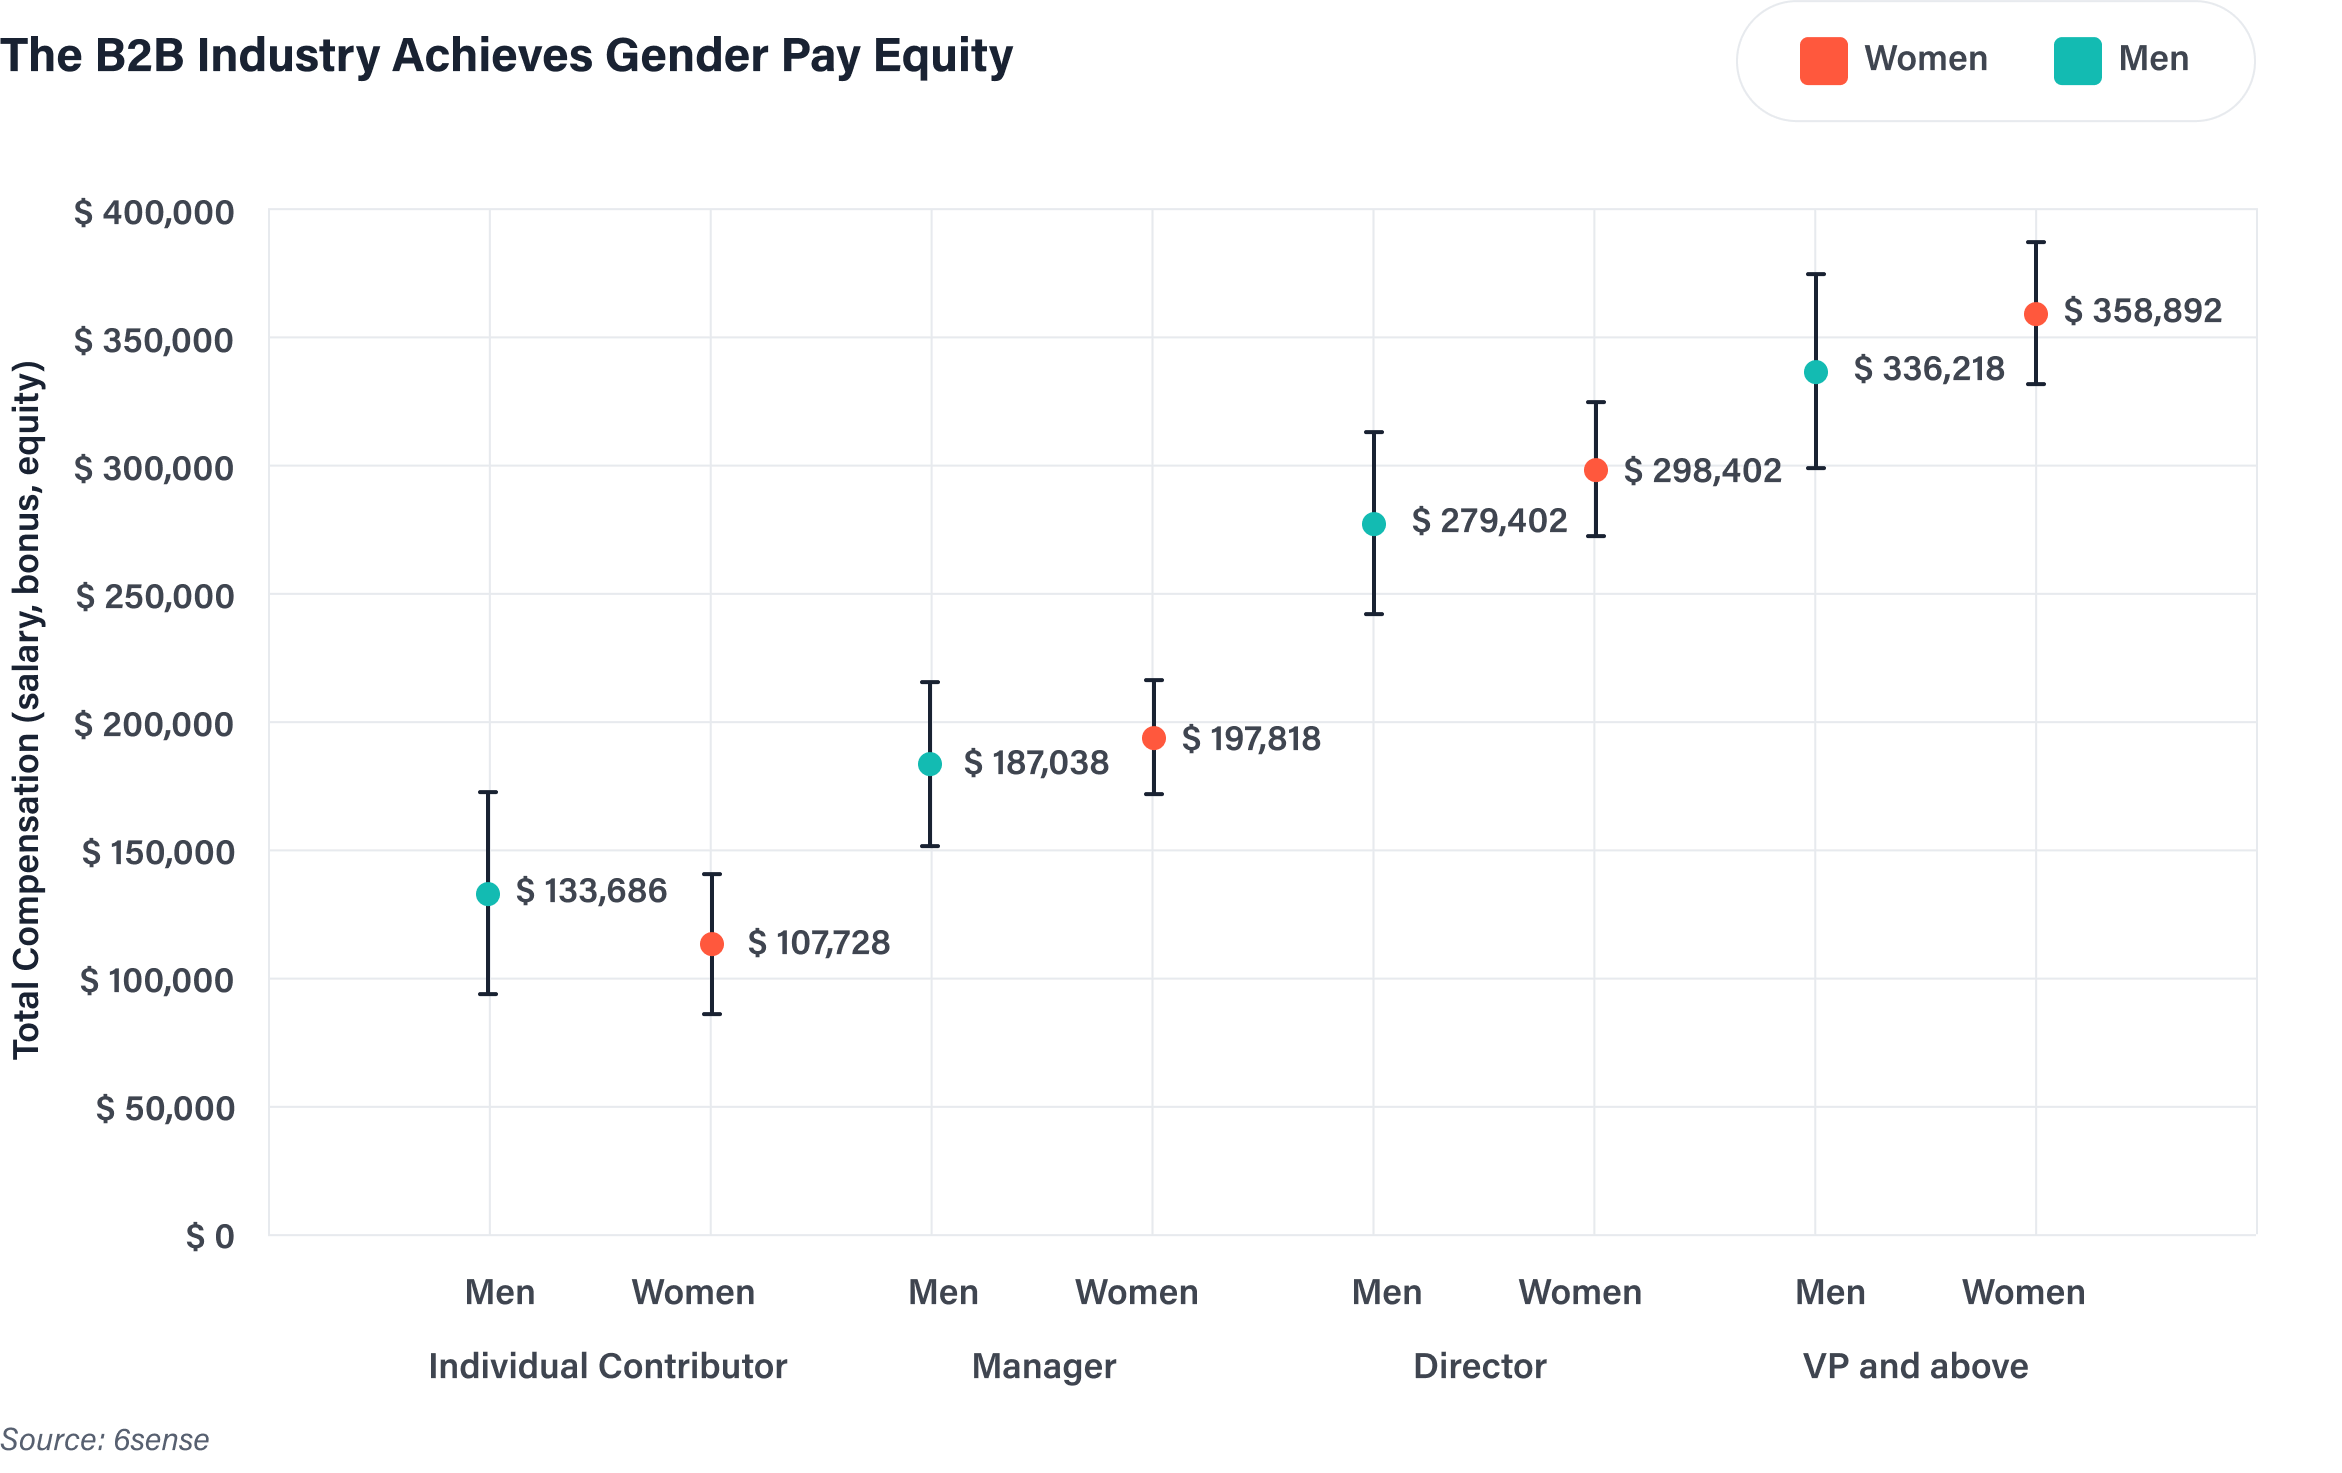
Perhaps the most encouraging finding of our research is that men and women B2B marketers are paid equally. That is, no statistically reliable differences were found in the salaries, bonuses, or equity awarded between male and female respondents (see the graph below). This finding is consistent with our previous research conducted last year at the CMO level.


  • Note 1:

    The orange and blue dots within each level indicate the average for women and men we found in our survey. The vertical lines running through them indicate the range of responses we would expect to find 95% of the time if we were to survey a new but similar set of marketers.

  • Note 2:

    While the average compensation levels of Individual Contributors averages may appear to be different, statistically, we cannot conclude that they are. This means that we would not expect to see these differences persist if we surveyed a similar audience. Thus, a non-statistically reliable result tells us that no real differences exist among the broader population of B2B men and women marketers.

  • Note 3:

    Within the responses for Individual Contributors, there is substantial variation. This is likely because the Individual Contributor category includes marketers just starting their career, but also much more senior and highly paid individuals who are nonetheless individual contributors. This wide range of responses makes finding statistically reliable differences very difficult.

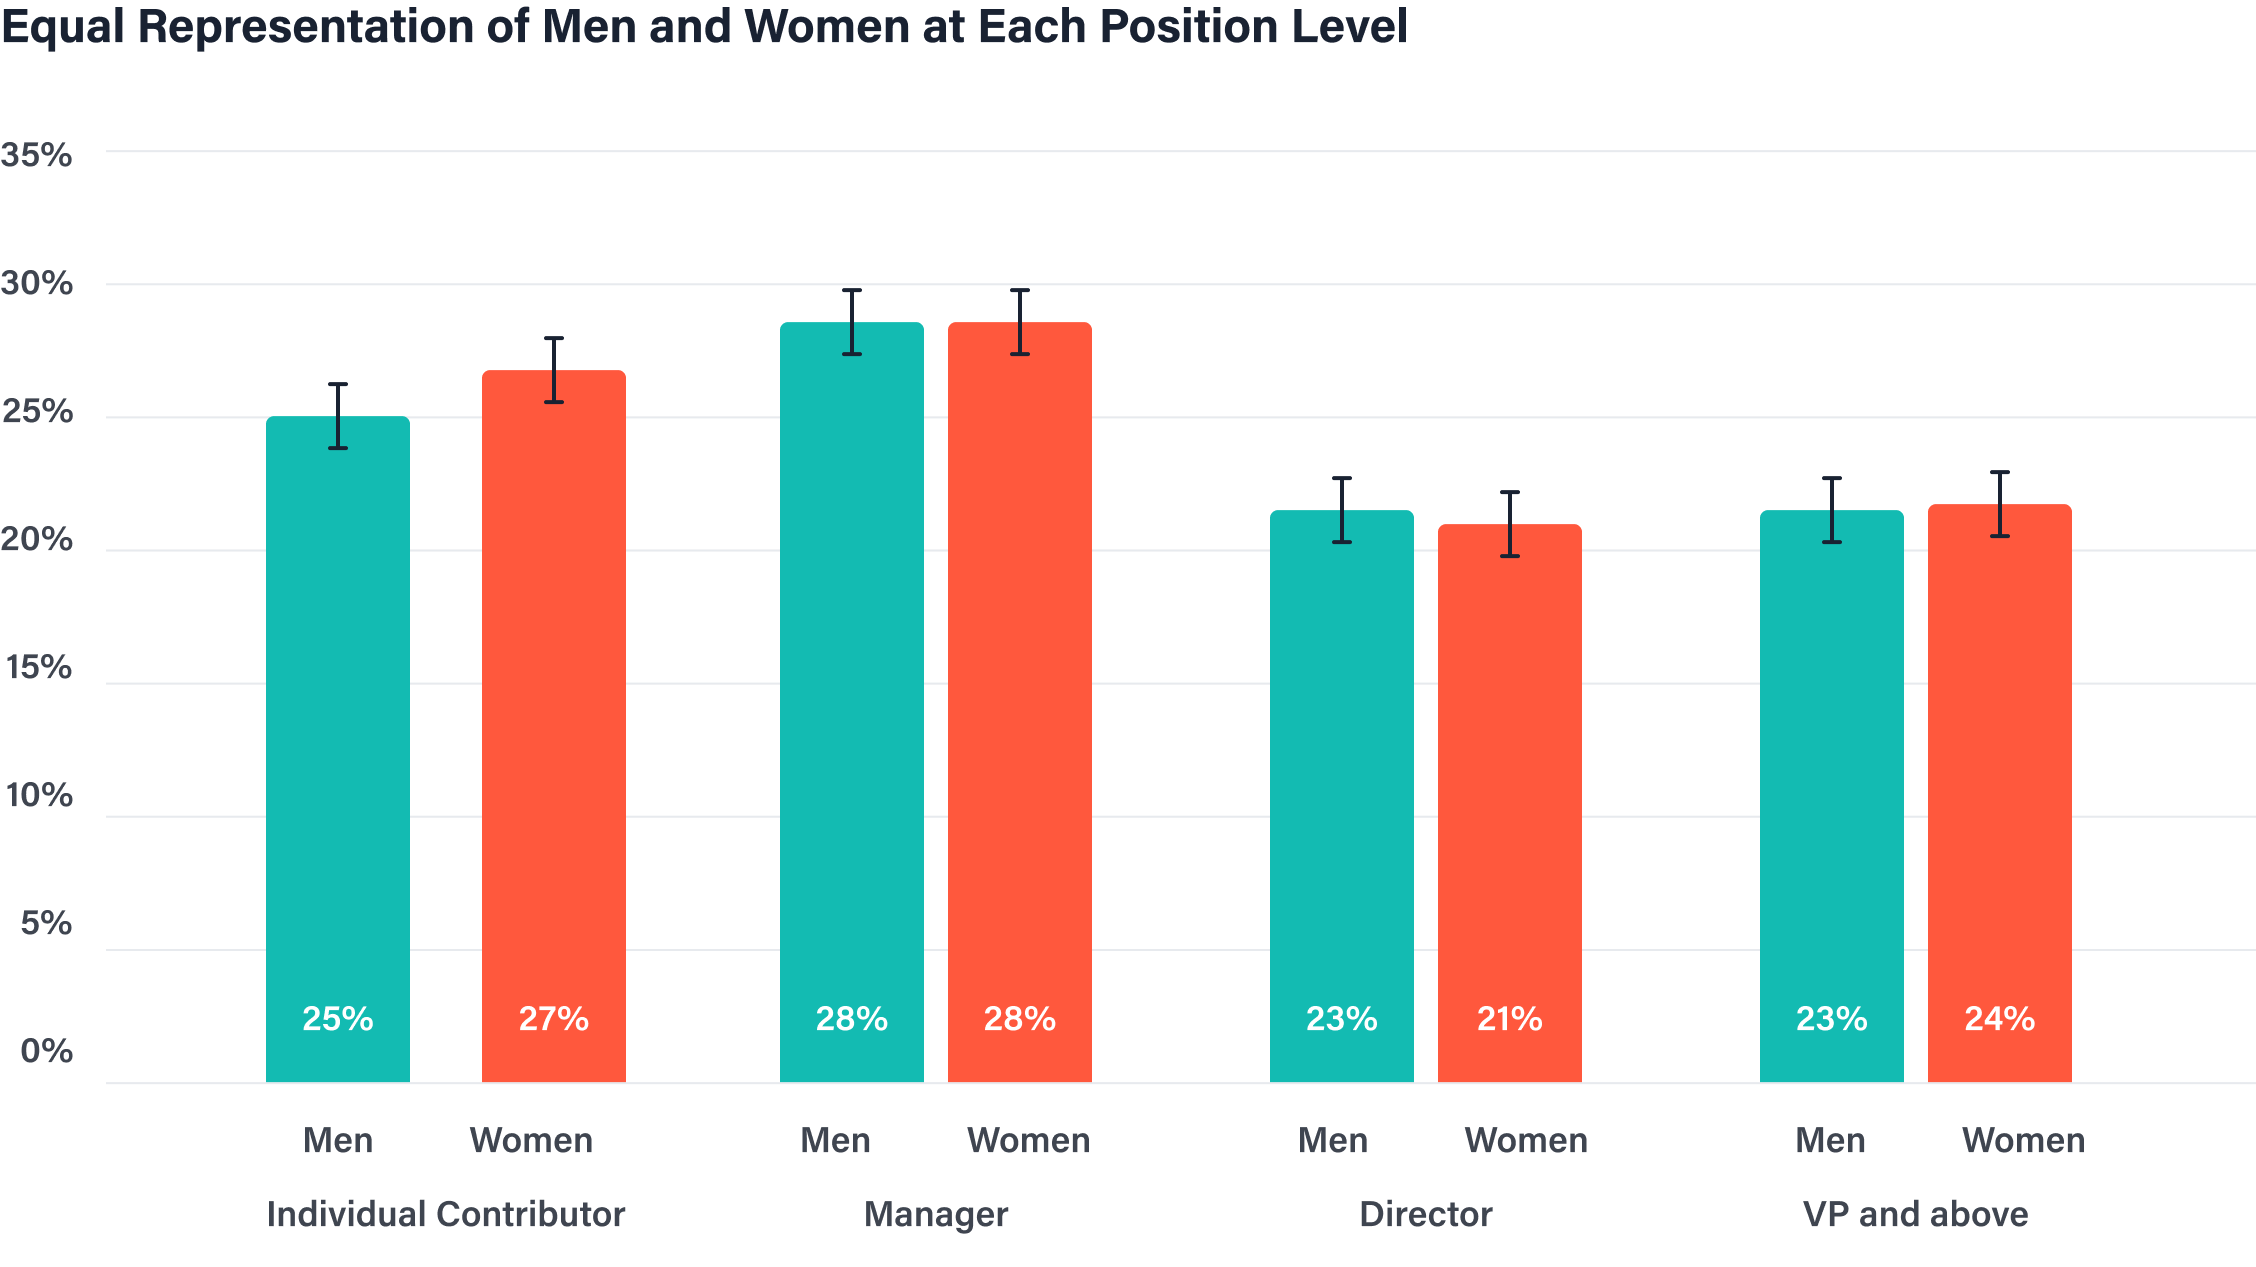
Furthermore, we found that men and women are equally likely to achieve the upper strata of B2B organizations (see graph below). Together with pay level compensation, we conclude that men and women were equally likely to be in senior levels within marketing, and are paid the same in those levels.

Note:

There are no statistically reliable differences between the percentage of men and women within each position level in the graph above. This means that we would not expect to see these differences persist if we surveyed a similar audience. Thus, a non-statistically reliable result tells us that no real differences exist among the broader population of B2B men and women marketers.

Climbing the Organizational Ladder: Pay By Level

$67,000

Each step on the organizational ladder is an opportunity to learn, grow… and make more money. Our analysis reveals that each advancement in title is associated with a considerable average pay increase. After accounting for the nine other factors that we measured in our study, the average jump in pay from one title level to another was approximately $67,000.

Additionally, many organizations have more specific leveling structures. For example, there may be multiple levels within the individual contributor role, manager role, and so on (e.g., Manager, Senior Manager, etc.). Our survey reflects more generalized position levels, with respondents only selecting between four categories: individual contributor, manager, director, and VP or above. As a result, the average pay increase of $67,000 may be larger than what people actually experience when climbing from one title to the next.

It’s important to note, however, that this average pay increase is undoubtedly influenced by a variety of factors beyond the scope of our study. Factors such as the accumulation of skills, expertise, and experience over time play a significant role in determining one’s earning potential and their suitability for higher positions within an organization.

Furthermore, economic conditions, geographic location, and a wide variety of other factors specific to an individual’s circumstances can lead to fluctuations in how they are compensated and therefore in the average pay increase they may receive upon promotion to a higher position.

Note:

The chart reveals a decline in annual total compensation for individual contributors, managers, and directors after 5 years of tenure. A potential reason for this could be that professionals who stay in their positions longer may receive only standard annual salary raises (typically around 3% per year), whereas those who switch companies more frequently may negotiate larger pay increases when transitioning to new roles. As a result, the latter group may earn more on average than those who remain with the same company for extended periods. However, this perspective is speculative as the reasons behind this trend were not considered in this study and require further research.

Compensation by Level: Breaking It Down

What does it take to ascend to a higher title? Much more than what we can study. However, our research highlights two trends that align with conventional expectations:

  • Those in higher positions are slightly more likely to have higher education.
  • Those in higher positions have slightly longer tenure in the field of marketing.

From Degree to Dollars:
A Look at Pay by Education Level

The correlation between education and position level is relatively modest, with educational achievement accounting for approximately 8% of the reason that marketers attain higher organizational levels. This suggests that while education may have some influence on career progression within the field of B2B marketing, its impact is limited.

To gain a clearer understanding of the monetary association between education and compensation, we isolated the impact of education to determine the dollar increase in compensation associated with each level of education completed.

Correlation

Correlations measure whether changes in one factor are reliably associated with changes in another. The easiest correlations to think about are those where one measurement increases, and then a second one also consistently increases. For example, in our research on B2B buying processes, we found that when buyer’s increase the number of vendors they evaluate, their buying process takes longer. That is a positive correlation. In contrast, we found a weak but reliable negative correlation between how important a buyer rates a solution and the length of the buying cycle. More important solutions have reliably shorter buying cycles .

Pay by Tenure +4% Total annual compensation

All In Good Time? Pay by Tenure

Last year, a CMO’s tenure in the field was not meaningfully associated with their base salary or annual bonus. However, when equity was considered as a part of their total annual compensation, CMOs with less than six months on the job earned more than CMOs who had been in the role for over four years. This finding likely indicated that CMOs who had just taken new jobs were doing so within the context of a hot job market and were therefore able to negotiate substantial increases in total compensation.

This year, with the inclusion of all position levels, we find a more conventional, albeit modest, relationship between a marketer’s tenure and their total annual compensation, with tenure accounting for only about 4% of the reason that one marketer is paid more than another. This closely aligns with standard annual pay raises commonly observed in the job market.

Significance is not importance

Statistical significance is a measure of how reliably a finding represents the population or real-world condition of interest. However, the word "significance" can be misleading. It can make people think that a statistically significant finding is also important or meaningful. But this is not always the case. In fact, many findings that are statistically significant are not really significant in any way that we would care about. When we encounter findings that are statistically “significant” but not important, we describe them as "not meaningful.”

Business Services and Manufacturing Lead in Compensation for Senior Marketers

In our study, we examined compensation across six sectors: Manufacturing, Business Services, Financial Services, Professional Services, Technology and Software, and a category labeled “Other,” which allowed respondents to provide their own industry descriptions.

The “Other” category consists of sectors such as Transportation, Insurance, Hospitality, Food Services, Publishing, Media and Entertainment, Energy, and others.

We observed that the Manufacturing and Business Services industries generally offer higher compensation packages for those with VP-level positions and above, even after controlling for company size. This trend is statistically reliable, indicating that Manufacturing and Business Services can be considered attractive options for senior marketers seeking competitive compensation within the broader population.

  • Note 1:

    The only statistically reliable differences depicted in the graph above are observed in the average total compensations of individuals holding VP positions and above within the Manufacturing and Business Services sectors, as compared to those in similar positions within Financial Services, Professional Services, Tech, and the "Other" industry category. Specifically, it can be inferred that the Manufacturing and Business Services industries tend to provide more lucrative compensation packages for individuals at VP levels and above, in contrast to their counterparts in the latter four industries. Any variations in average compensation within Financial Services, Professional Services, Tech, and the "Other" industry category, although present in the graph, lack statistical reliability and are unlikely to hold true for the broader population of B2B marketers

  • Note 2:

    The vertical lines running through the dots in the chart above indicate the range of responses we would expect to find 95% of the time if we were to survey a new but similar set of marketers.

Statistical significance is reliability

Statistical significance is a measure of how reliable a survey statistic is. It tells us how likely it is that the result we found represents the real world. For survey research, the standard for determining statistical significance is that we would expect to find the same result 95% of the time we replicate the survey with a sample drawn from the same population. We use the word "reliable" instead of "significant," because we think it is a more accurate description of this concept. The word “significant” is often taken to mean “important” or “large”, but there are many cases in which findings that are statistically significant are not meaningful or important.

Financial Performance is Overcast in Tech, Sunny Everywhere Else


To understand if compensation is influenced by the financial performance of companies within each industry, we asked respondents to report on their organization’s overall fiscal health in the past year.

On a 5-point scale from “well below expectations” to “well above expectations”, respondents from each industry — with the exception of Technology and Software — answered that their organization, on average, exceeded financial expectations. In contrast, those in Technology and Software indicated that their organizations generally “met financial expectations.”

A modest but statistically reliable correlation was found between the reported financial performance of organizations and the total annual compensation they offer. On its own, a one-point difference in the financial performance of an organization (e.g., from “met expectations” to “exceeded expectations”) is associated with an average $13,000 boost in compensation per reported level of financial performance.

A part of this compensation boost can likely be attributed to larger average bonuses, as companies tend to pay out more bonus when they are performing well financially. While our survey measured bonuses as a percentage of salary, it didn’t measure how much of that potential bonus had been awarded in a specific year.

There, of course, is variability in this finding as the industry category “Other” was rated higher in fiscal health than Technology and Software, yet on average offers a lower total annual compensation. This suggests that while company financial performance plays a role, it is simply one of numerous factors influencing compensation decisions.

Understanding the Impact of Company Revenue on Compensation

In further support of the notion that better financial performance typically leads to higher take-home earnings for marketers, our analysis also revealed that employers’ annual revenue tends to play a role in how much money they offer their employees.

To measure this, we looked across the following three categories of companies: those measuring their annual revenue in thousands of dollars, millions, and billions. Independent of the influence of an additional nine factors (such as tenure, education, and so forth), each threshold of annual revenue was positively associated with an average compensation increase of roughly $55,000.

That is, for example, those working for organizations that measure their revenue in millions of dollars may experience a higher total annual compensation that is about $55,000 more than those who work for organizations that measure their annual revenue in thousands of dollars.

Pay By Marketing Discipline

In our sample, we observed that Customer Marketing takes the lead when considering total annual compensation by marketing discipline. This difference is statistically reliable, suggesting that this trend is likely to exist among the broader population of marketers who share similar characteristics to our sample.

For these folks, the strategic importance of retaining and expanding customer relationships in today’s competitive landscape may contribute to the elevated compensation levels observed within this marketing discipline. However, further research is required to draw specific conclusions regarding the underlying factors influencing these differences in compensation.

Higher Pay for In-Person and Hybrid Roles

Considering the dynamic shifts in work arrangements following the COVID-19 pandemic, we asked respondents to disclose whether they work in-person, remote, or had a hybrid arrangement. Within our sample, we found that marketers — at the VP level and above — who work hybrid or in-person jobs typically earned more than those in remote positions. This disparity was statistically reliable, suggesting this trend is likely present for the broader population of marketers who share similar characteristics to our sample.

In the chart below, being either fully in-person or hybrid appears to yield more compensation for respondents at vice president and higher levels. However, these averages encompass all marketers within each work modality, including individuals from various industries and much more.

Upon statistically controlling for the influence of various factors, the statistical significance in the compensation disparity originally observed across hybrid, in-person, and remote work vanished. This result suggests that these three types of work modalities aren’t on their own responsible for the differences in pay we observed for marketers like the ones in our sample. In the next section, we explore a possible contributing factor as to why our sample, and marketers like them, might experience lower compensation being a remote-worker.

Note:

Ignoring other factors that influence compensation, a statistically reliable pay gap exists between in-person and remote workers at the VP level and above, and this trend can be inferred to apply to the broader population of VP marketers beyond those we surveyed.

Controlling

Controlling for a variable means accounting for other factors that might be affecting the relationship you're interested in. For example, imagine you're a marketing manager trying to figure out if there's a relationship between the amount of money spent on advertising and sales. However, it’s possible that companies that spend more money on advertising also tend to have better products or services. This means that the relationship between money spent on advertising and sales might be caused by the quality of the products or services, rather than the advertising itself. By using statistical techniques, we can control for product quality to allow us to examine the relationship between money spent on advertising and sales without the influence of product quality.

Weaker Fiscal Health for Remote Organizations

We then looked to see whether a company’s financial performance influenced whether their employees worked remotely or not. Illustrated in the graph below, in-person and hybrid employees generally reported better company financial performance than their remote counterparts.

As stated earlier, there is a modest, but statistically reliable correlation between fiscal health and total annual compensation, with better financial health typically associated with higher pay. Thus, one possible contribution to the relationship between lower total annual compensation for remote employees may be the state of their organizations’ financial performance.

However, it’s important to note that this suggestion doesn’t imply a causal relationship between remote work arrangements and poorer company financial performance. We didn’t capture data on whether organizations exclusively employed remote, in-person, or hybrid employees. Instead, this preliminary finding suggests that reduced pay among remote employees may, to some extent, be associated with the current financial challenges faced by their respective organizations rather than the nature of remote roles itself.

Price of Defection

As a part of this year’s survey, we asked respondents to disclose the specific percentage increase in their total compensation that a new company would need to offer to entice them to leave their current company. We call this a person’s “defection price.”

Note:

Above, where dashed lines intersect the range for two levels, those levels are statistically equivalent. Hence, average defection price for individual contributors is not different from that for VP and above. Likewise, managers are not distinct from VPs, but are distinct from individual contributors and directors.

Rising Up The Corporate Ladder Increases Defection Price — Until It Doesn’t

The results above suggest that director-level marketers are more expensive to lure away from the existing roles than are individuals in other organizational levels. Manager levels are also more expensive than individual contributors, but equivalent to VP levels. VP and individual contributor levels are statistically equivalent.

41%

A Defection Price of approximately 41% suggests that luring vice presidents away from their current jobs is expensive, but less so than their more junior peers, who feel that their next best career move lies within their current organizations. The same may be true to a somewhat lesser extent for managers.

Note:

This chart reveals that marketers who have been granted equity as part of their compensation packages have substantially higher defection prices than their peers who do not have equity. However, that pattern is reversed for vice president-level marketers and above, whose Defection Price is lower, not higher than others.

Categories that Influence Defection Price

In a forthcoming report on Defection Price, we will explore in depth the impact of a wide variety of factors on how much money is required to lure marketers out of their current jobs. For now, we can report that a number of factors appear to be influential:

  • First, we observed that marketers in publicly traded companies have substantially lower Defection Prices (35%) than the rest (46%)
  • Similarly, Tech & Software company marketers had much lower Defection Prices (34%) than marketers in other industries (47%)
  • Remote marketers also had lower Defection Prices (38%) than their hybrid or office-bound peers (46%)
  • The 19 respondents who were remote workers in publicly traded tech and software companies had a dramatically lower Defection Price (26%) than did their peers (44%).

There’s No Success Like Success

Finally, one factor that seemed likely to impact Defection Price was simply how well a respondent thought their company was performing financially. Indeed, a higher rating of the company’s financial performance over the past month was reliably and meaningfully associated with a higher Defection Price.

Whether from a sense of safety, opportunity, or both, marketers in organizations that performed well reported being more expensive to lure away to new jobs.

Talk Isn’t Cheap

Compensation is clearly important to B2B marketers. So, how often are they discussing compensation with coworkers? Or with friends and family? As a part of this year’s survey, we asked respondents to share the frequency with which they engage in discussions about their pay. Respondents’ average responses are detailed in the chart below.

Discuss with… Never Several times per year Quarterly Monthly Weekly Daily
Coworkers 44% 15% 11% 11% 11% 8%
Family & Friends 21% 27% 16% 17% 17% 2%
Source: 6sense

We then asked whether there was a relationship between total compensation and how often individuals talked about their compensation with others. Interestingly, we found a statistically reliable correlation wherein more chattiness was associated with higher pay.

More Money → More Talk or More Talk → More Money?

It may be that employees are simply interested in understanding where they stand relative to their peers. If that were true, we’d expect to see a consistent likelihood to discuss compensation across all compensation levels. However, the results observed here indicate that people who make more tend to talk about it more.

This suggests that people are more likely to discuss their compensation when it’s more likely that they compare favorably to their peers.

Further evidence for this conclusion was found when we considered whether compensation was important to respondents and whether they were satisfied with their compensation. For each component of monetary compensation (salary, bonus, and equity), we asked participants to rate the importance of — and their satisfaction with — their compensation. Each was rated on a 5-point scale with higher ratings signifying more importance and more satisfaction.

In a multiple regression analysis, we found that both factors influence the likelihood of talking about compensation, such the more importance individuals attach to their compensation, and the more satisfied they are with it, the more likely they are to talk about it with coworkers and with people outside of work.

Salary Satisfaction and Importance

As mentioned above, we asked marketers to tell us how satisfied they were with their compensation. For the ratings indicated below, we included satisfaction ratings with salary, bonus, equity and their health insurance benefit. As detailed in the chart below, marketers are generally satisfied with these elements of their total compensation, although satisfaction with the equity component lags behind the others.

Compensation Satisfaction

Dissatisfied Neutral Satisfied
Salary 15% 10% 75%
Bonus 15% 15% 70%
Equity 20% 25% 55%
Health Insurance 10% 15% 75%
Source: 6sense

In addition to measuring respondents’ sentiment regarding their pay, we also asked them to report on the importance they assign to each component of their pay.

Upon comparing respondents’ satisfaction scores with their importance scores, we observed a relatively strong alignment between the two. For example, 90% of marketers noted their base salary as being important to them and 75% are satisfied with the salary they currently earn (see graphic below).

Compensation Alignment: Importance and Satisfaction Correspondence

Find Important Are Satisfied
Salary
90% 75%
Bonuses
70% 70%
Equity
55% 55%
Health Insurance
80% 75%
Source: 6sense

What predicts if an employee is satisfied with their compensation? From our data, we can only account for about 5% of the reasons some are satisfied with their pay and others aren’t. Across all components of compensation, the financial performance of one’s organization is a predictor of satisfaction. This likely reflects the tendency for organizations that are doing well financially to offer higher levels of pay.

For base salary, bonus, and equity, being a director or above leads to higher satisfaction than for manager or below. For those who place importance on equity, marketers in PE- and VC-backed firms reported the highest levels of satisfaction with their equity offerings.

Additionally, the manufacturing industry demonstrated the highest levels of employee satisfaction of health insurance, bonuses, and equity.

Predictors of Satisfaction With…

  • Salary

    • Company Funding
    • Position level
    • The financial performance of your organization
  • Bonus

    • Company Funding
    • Position level
    • The financial performance of your organization
  • Equity

    • Company Funding
    • Position level
    • The financial performance of your organization
  • Health Insurance

    • Company Funding
    • Position level
    • The financial performance of your organization
Source: 6sense

Multiple Regression Analysis

Multiple regression (more formally, Multiple Linear Regression) is a statistical method used to predict an outcome (such as buying cycle length) from various factors that might impact it (such as solution price, number of competitors, and how important the solution is to buyers). Multiple regression also provides a measure of how important each factor is to the model’s prediction. In this example, the analysis determines how much of the total variability in buying cycle length can be accounted for by these three factors. The model also provides measures of the relative importance of each factor in the prediction of buying cycle length.

Chapter 3

Summary of Findings

  • As expected, compensation increases as employees climb the organizational ladder.

  • Gender parity reigns at all organizational levels.

  • Manufacturing and Business Services offer a larger payout for senior executives than other industries.

  • Each additional level of education is associated with a $15,000 increase in earnings.

    $15,000
  • Each year of tenure is associated with a 4% increase in earnings.

    4% increase
  • Financial backing no longer impacts pay.

  • Unlike last year, more tenure is associated with higher pay.

  • For those with similar characteristics to our sample, remote work may be associated with less pay for those at the vice president level and above. However, when controlling for influential factors, there is no difference in how people are paid across in-person, hybrid, and remote roles.

  • For those with similar characteristics to our sample, Customer Marketing tends to have a higher payout than Digital Marketing, Brand, ABM/X, and General marketing roles.

  • Defection price is influenced by whether organizations offer equity, company funding, position level, and tenure in marketing.

Chapter 4

Implications

$350,000

Marketers today, on average, are earning competitive salaries that are often complemented by annual bonuses and equity compensation. Those in individual contributor positions are already commanding six figures in total annual compensation, while those in VP positions and above are achieving approximately $350,000.

Perhaps contrary to expectations, the marketers we surveyed generally expressed satisfaction with their total compensation and with each of the main components of it. Perhaps even more surprisingly, ‌marketers who are motivated to discuss their compensation with family, friends and coworkers tend to be the ones who are making more and are more satisfied with their compensation, rather than the reverse. If anything, they are bragging, not complaining.

Perhaps one of the most encouraging findings of the present study is that equal pay for men and women exists at all levels in B2B marketing. This replicates and extends our observation last year wherein there was also gender parity in compensation among CMOs. Men and women are also just as likely to hold senior level titles, demonstrating gender equity in both compensation and career progression within the B2B marketing industry.

As with gender, whether marketers work in hybrid, in-person, or remote positions did not, on its own, play a role in compensation differentials. As expected, one’s level within the organization had the largest impact on compensation. Next, companies with larger annual revenues tended to pay more.

In conclusion, the overall landscape of pay and benefits appears promising. It’s our hope that marketers use this research as a valuable resource to stay informed, leverage it during salary negotiations, and foster discussions around fair and equitable compensation practices.

Chapter 5

Appendix

Table 1: Statistical Reporting

Finding Statistical Test Statistiс Significance Level Effect Size Sample Size
Industry, marketing discipline, tenure, education level, position level, work modality, company financial performance, company annual revenue, and type of company funding account for 53% of the variability in marketers’ compensation. Regression analysis F = 15.178 p<.001 0.531 432
Each advance in position level corresponds to an average pay increase of roughly $67,000. Regression analysis F = 15.178 p<.001 0.531 432
Each increase in educational level (eg., from bachelor’s degree to master’s degree) is associated with an approximate $15,000 increase. Regression analysis F = 15.178 p<.001 0.531 432
Each year of tenure in a role is associated with a 4% increase in total compensation. Regression analysis F = 15.178 p<.001 0.531 432
When we isolate the impact of industry, the individual effect of working in Manufacturing versus Technology and Software is approximately $45,000. Regression analysis F = 15.178 p<.001 0.531 432
The disparity between the average compensation offered in the industries labeled “Other” and Technology and Software is roughly $43,000. Regression analysis F = 15.178 p<.001 0.531 432
On its own, an organization’s fiscal health is generally associated with an average $13,000 boost in compensation per reported level of financial performance. Regression analysis F = 15.178 p<.001 0.531 432
Each threshold of annual revenue is positively associated with an average compensation increase of roughly $55,000. Regression analysis F = 15.178 p<.001 0.531 432
Independent from other factors that may influence defection, each reported level of fiscal health was found to be associated with an average 3% increase in defection price. Regression analysis F = 15.178 p<.001 0.531 432
In isolation – without other factors that may influence defection – the presence of equity in one’s compensation package raised the average defection price by 6%. Regression analysis F = 15.178 p<.001 0.531 432
Independent of other factors that might influence defection price, those who work for public companies reported, on average, a 3% lower percentage increase needed to consider switching companies compared to their counterparts in PE-backed, VC-backed, and private organizations. Regression analysis F = 15.178 p<.001 0.531 432
The likelihood of engaging in such conversations is not driven by how important marketers view compensation in general, but rather is fueled by larger salaries and if their organization is doing well financially. Regression analysis F = 15.178 p<.001 0.531 432
There is no difference in base salary between men and women. Regression analysis F = 15.178 p<.001 0.531 432
There is no difference in total compensation between men and women. Regression analysis F = 15.178 p<.001 0.531 432
Financial Services and Manufacturing offer higher base salaries on average than Tech & Software, Professional Services, and Business Services. Regression analysis F = 15.178 p<.001 0.531 432
Financial Services and Manufacturing offer higher total compensation (salary, bonus, and equity) on average than Tech & Software, Professional Services, and Business Services. Regression analysis F = 15.178 p<.001 0.531 432
For marketers of the same position level, there are no statistically reliable differences in total annual compensation across PE-backed, VC-backed, public, or privately financed companies. Regression analysis F = 15.178 p<.001 0.531 432
Base salary fluctuates by the financial performance of employing organizations. Regression analysis F = 15.178 p<.001 0.531 432
Base salary tends to increase with education level. Regression analysis F = 15.178 p<.001 0.531 432
Base salary tends to increase with job titles. Regression analysis F = 15.178 p<.001 0.531 432
Those working hybrid or in-person jobs tend to make more in base salary than those who work from home. Regression analysis F = 15.178 p<.001 0.531 432
Those who earn higher wages tend to be more satisfied with their total compensation. Regression analysis F = 15.178 p<.001 0.531 432
Those with higher salaries tend to have more frequent discussions with their friends and family about their earnings. Regression analysis F = 15.178 p<.001 0.531 432
Those with higher salaries tend to have more frequent discussions with their colleagues about their earnings. Regression analysis F = 15.178 p<.001 0.531 432
Those who are satisfied with their bonuses tend to speak about it more with friends, family, and colleagues. Regression analysis F = 15.178 p<.001 0.531 432
There is no correlation between satisfaction with salary and how much a person speaks about it with their friends, family, and colleagues. Regression analysis F = 15.178 p<.001 0.531 432
There is a modest correlation between base salary and tenure in that more tenured marketers tend to make more in compensation. Regression analysis F = 15.178 p<.001 0.531 432
There is a modest correlation between job title and tenure in that those in higher positions tend to have been in the field for longer. Regression analysis F = 15.178 p<.001 0.531 432
One’s tenure in the field is not related to how much more money a company would have to offer them to get them to leave their current company. Regression analysis F = 15.178 p<.001 0.531 432
One’s tenure in the field is not related to how important their salary is to them. Regression analysis F = 15.178 p<.001 0.531 432
One’s tenure in the field is not related to how they view their company’s financial performance. Regression analysis F = 15.178 p<.001 0.531 432
One’s tenure in the field is not related to how much they chat with friends, family, and coworkers about their earnings. Regression analysis F = 15.178 p<.001 0.531 432
There is a modest correlation between job title and education level in that those in higher positions tend to have a higher level of education. Regression analysis F = 15.178 p<.001 0.531 432
Those who work remote jobs report that their companies had lower financial performance over the past year than those who work in-person or hybrid jobs. Regression analysis F = 15.178 p<.001 0.531 432
Those who work in-person jobs tend to be in lower organizational strata than those who work remote positions. Regression analysis F = 15.178 p<.001 0.531 432
In our sample, respondents with higher titles tend to be in Tech & Software. Regression analysis F = 15.178 p<.001 0.531 432
Those in more senior-level positions tend to think their company has had worse financial performance than those in lower levels. Regression analysis F = 15.178 p<.001 0.531 432
There was a significant positive correlation between "Level in org" and "Education Level." Regression analysis F = 15.178 p<.001 0.531 432
"Level in org" was positively correlated with "Tenure all companies." Regression analysis F = 15.178 p<.001 0.531 432
Good company financial performance has a positive correlation with an increase in defection price. Regression analysis F = 15.178 p<.001 0.531 432
Source: 6sense