
• What is Revenue Forecasting?, about 3 minutes
• Revenue Forecasting Process, about 8 minutes
• How to Calculate Revenue Forecasting, about 3 minutes
• How to Overcome Forecasting Obstacles Due to The Dark Funnel™, 2 minutes
• Final Thoughts, 1 minute
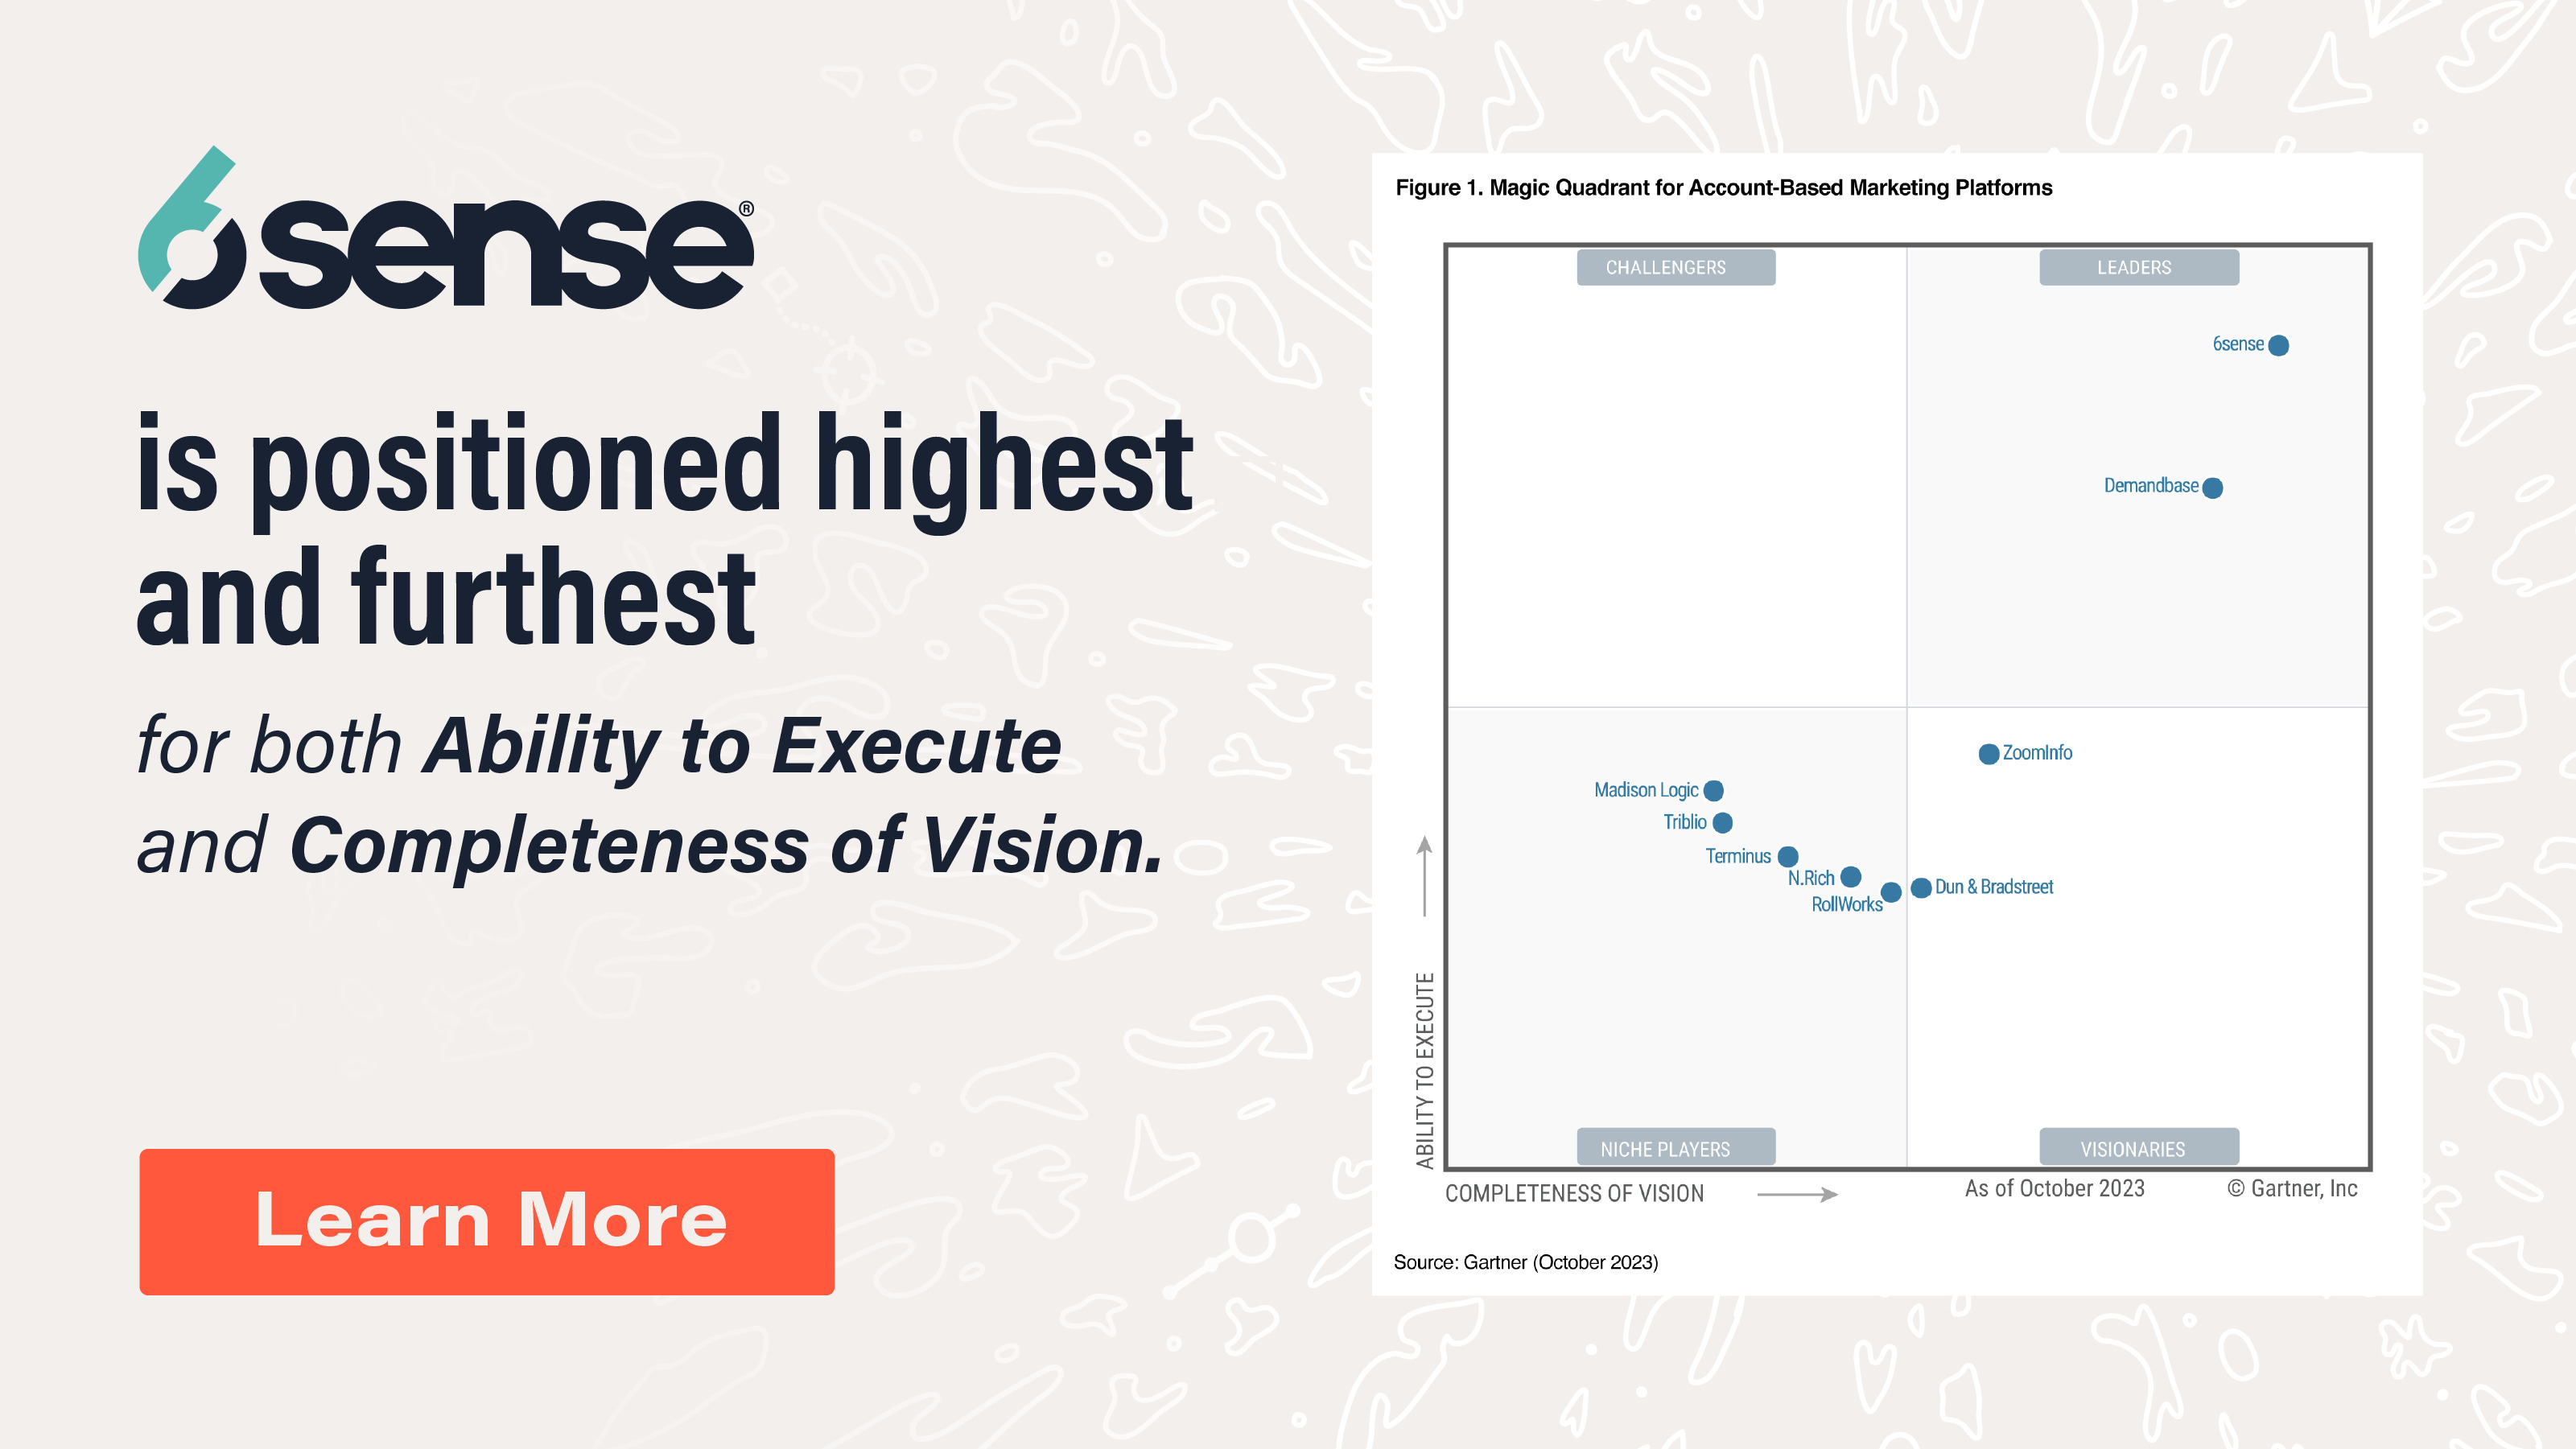
Today’s B2B buyers spend 70% of the buyer’s journey in The Dark Funnel™, which means there’s a good chance you don’t know how many potential customers you truly have. Without that information, it can be challenging to forecast revenue accurately.
That may explain why one study found that less than a quarter of sales organizations believe their forecasts are even 75% accurate. So, what should you do?
In this complete guide to revenue forecasting, we’ll help you learn:
- Why revenue forecasting is essential for business planning and strategy
- A simple step-by-step process for conducting revenue forecasts
- An overview of several forecasting models
- How to build a revenue forecasting model tailored to your business
- How to overcome obstacles with accurate forecasting due to The Dark Funnel™
What Is Revenue Forecasting?
Revenue forecasting is the process of estimating how much revenue your business will generate over a specific time period — typically monthly, quarterly, or annually.
Revenue teams make these projections using a company’s historical performance, sales pipeline, market trends, and economic indicators.
Unlike sales forecasting, which focuses on predicting the quantity of products or services sold, revenue forecasting is more comprehensive. It considers not only sales but also factors like:
- Pricing strategies
- Customer retention
- Upselling, and
- Market conditions
By having a clear picture of your expected revenue, you can proactively address any financial challenges, optimize resource allocation, make data-driven decisions, seize growth opportunities, and set realistic, achievable goals for your organization.
Basics of Revenue Forecasting
There are a few fundamental concepts to address before breaking down the process of forecasting revenue.
Sales Projections and Revenue Goals
Sales projections estimate the quantity of products or services your business expects to sell during a specific period. These projections are a key component of revenue forecasting, as they directly influence your revenue.
Revenue goals, on the other hand, are the financial targets you set for your business. They encompass the total revenue generation within a particular time frame and serve as a guiding metric to assess your performance.
Timeframes for Forecasting
Revenue forecasting can occur over different timeframes, depending on your business needs.
Short-term forecasting typically covers the immediate months or quarters ahead, allowing for more precise predictions.
Long-term forecasting extends over a more extended period, often spanning years. It provides a strategic view of your business’s financial trajectory, aiding in long-term planning, investment decisions, and setting overarching objectives.
The Relationship Between Historical Data and Future Projections
By analyzing past sales, revenue, and market trends, you gain valuable insights into your business’s performance.
Future projections build upon this historical data, incorporating adjustments based on changes in your business, market conditions, and internal factors. The goal is to create a more accurate picture of what lies ahead, considering lessons learned from the past.
Why Revenue Forecasting Is Important
Having a reliable method to forecast revenue for your business allows you to realize several critical benefits.
Effectively Allocate Resources
By knowing how much revenue you expect to generate, you can determine where to invest your capital, staffing, and time.
Identify Growth Opportunities
By analyzing your projected revenue alongside market trends and customer behavior, you can pinpoint areas with the potential for expansion.
Manage Cash Flow and Expenses
Effective forecasting lets you anticipate when revenue will come in, helping you plan for necessary expenditures. It also enables you to set a realistic budget, ensuring you don’t overspend or overcommit when revenue falls short of expectations.
Provide Investor and Stakeholder Confidence
Reliable revenue forecasting gives investors and stakeholders the confidence that your business is being managed responsibly. It demonstrates that you have a clear strategy in place and are committed to achieving your financial goals.
Adapt to Market Changes and Uncertainties
By monitoring your forecasts and adjusting them as needed, you can react swiftly to changing market conditions, ensuring your business remains agile and competitive.
Revenue Forecasting Process
There are several revenue forecasting models, each with pros and cons depending on your business model.
However, let’s first review the general process you’ll use to forecast revenue. This process will mostly be the same, regardless of the model you use.
Step 1 – Gathering Historical Data and Sales Information
Begin by gathering data on your company’s past performance, including sales figures, revenue, and any other relevant financial metrics.
Step 2 – Choosing the Appropriate Forecasting Model
Once you have historical data in hand, the next crucial step is to select the most suitable forecasting model.
Your choice will depend on factors such as data availability, the complexity of your business model, and the industry you operate in.
Step 3 – Calculating Revenue Forecasts
Once you’ve chosen a forecasting model, you can then calculate revenue projections for your specified time period.
This involves applying the selected forecasting model to your historical data and adjusting it to account for relevant variables like market trends, seasonality, and external factors affecting your industry.
Step 4 – Validating and Refining Forecasts
Ensure the accuracy of your forecasts by comparing your forecasts with actual results over time, making adjustments as needed. Continuous refinement is essential as your business evolves and market dynamics change.
Step 5 – Communicating Results to Stakeholders
Finally, it’s crucial to communicate the results of your revenue forecasts to stakeholders, including your internal teams, investors, and other relevant parties.
When everyone understands the forecasted revenue and the assumptions behind it, it becomes easier to make informed decisions and collectively steer the business in the right direction.
Types of Revenue Forecasting Models
Now, let’s explore several forecasting models. For each model, we provide a definition, why you might consider the model for your business, the pros and cons, and an example that illustrates the model in practice.
Linear Regression Model
Linear regression is a statistical technique used to model the relationship between one or more independent variables (e.g., marketing return on investment, product pricing) and a dependent variable (revenue). It calculates a linear equation to predict revenue based on the values of these independent variables.
When You Might Consider Using This Model
Companies should consider using the linear regression model when they have a dataset with historical revenue and related variables, and they want to understand how changes in these variables impact revenue.
Pros
- Quantitative Insights. Provides a quantitative view of the relationship between variables and revenue, enabling data-driven decision-making.
- Ability to Predict. Helps companies anticipate the impact of changes in marketing spend, pricing, or other factors.
- Identifying Significant Factors. Reveals which independent variables significantly influence revenue, helping prioritize business strategies.
Cons
- Linear Assumption. Assumes a linear relationship between variables, which may not accurately represent complex real-world scenarios.
- Limited to Available Data. Relies on the data available and may not account for unmeasured or external factors affecting revenue.
- Data Requirements. Requires a sufficiently large and high-quality dataset, which may be a limitation for some businesses.
Example of Linear Regression Model
Let’s consider a B2B manufacturing company, XYZ Manufacturing, that wants to predict its quarterly revenue based on changes in marketing spend.
They have collected historical data, and their linear regression model indicates that, on average, every $10,000 increase in marketing spend leads to a $25,000 increase in quarterly revenue.
If XYZ Manufacturing plans to increase their marketing spend by $30,000 in the next quarter, the linear regression model suggests the following revenue projection:
- Increase in Marketing Spend: $30,000
- Expected Increase in Quarterly Revenue: ($30,000 / $10,000) × $25,000 = $75,000
Straight-Line Model
The straight-line forecasting model assumes a constant rate of revenue growth or decline over time. It’s a straightforward method to quickly estimate future revenue based on historical data.
When You Might Consider Using This Model
Companies should consider using the straight-line model for basic, short-term revenue projections, especially when they have a simple or linear growth trend and limited data.
Pros
- Simplicity. It’s easy to understand and implement, making it suitable for quick estimates.
- Quick Projections. Provides a rapid, rule-of-thumb estimate for future revenue based on historical trends.
- Clarity. Offers a clear, linear path for revenue growth or decline.
Cons
- Oversimplification. May not capture complex or non-linear revenue trends.
- Inflexibility. Does not adapt to changing market conditions or factors influencing revenue.
- Lack of Precision. May not accurately account for variations in growth rates.
Example of Straight-Line Model
Consider a B2B consulting firm, Alpha Consultants, with a steady annual revenue increase of $50,000 over the past five years.
If Alpha Consultants continues this consistent trend, their projected revenue for the upcoming year would be as follows:
- Current Annual Revenue: $1,000,000
- Expected Annual Increase: $50,000 (based on past trends)
- Projected Annual Revenue: $1,000,000 + $50,000 = $1,050,000
Backlog Revenue Model
The backlog revenue forecasting model estimates revenue based on existing orders or contracts in the pipeline. It’s valuable for businesses with long sales cycles, such as construction or manufacturing companies.
When You Might Consider Using This Model
Companies with significant contract-based revenue should consider using the backlog model, especially when they want to ensure reliable revenue estimates.
Pros
- Contractual Certainty. Provides a reliable outlook on revenue as it accounts for contracted sales.
- Stability. Offers a consistent view of expected revenue based on known commitments.
- Useful for Project-Based Businesses. Particularly valuable for businesses with long project cycles, where contracts determine revenue.
Cons
- Limited to Contracted Work. May not account for potential fluctuations in new orders or unforeseen cancellations.
- Lack of Market Dynamics. Does not consider external factors that may affect revenue.
- May Not Reflect Future Growth. Does not project revenue growth beyond existing contracts.
Backlog Revenue Model Example
Imagine a B2B construction company, BuildIt Constructions, with a substantial backlog of construction contracts. The total value of existing contracts is $5 million.
BuildIt Constructions can project their revenue for the next year based on the backlog of existing contracts:
- Existing Contract Value: $5,000,000
So, assuming all contracted work gets completed, their expected revenue for the upcoming year would be $5,000,000.
Pipeline Revenue Forecasting Model
The pipeline revenue forecasting model estimates future revenue by examining the sales pipeline. It considers potential deals in various stages of the sales process and their likelihood of closing.
When You Might Consider Using This Model
Companies with complex, multi-stage sales cycles and diverse product or service portfolios should use the pipeline model to estimate revenue based on sales opportunities within their pipeline.
Pros
- Detailed View. Offers a clear outlook of potential revenue, allowing for proactive sales and resource allocation.
- Opportunity Prioritization. Helps prioritize sales efforts by focusing on deals closer to closing.
- Sales Strategy. Aids in refining sales strategies and identifying areas for sales velocity improvement.
Cons
- Dependent on Sales Team Estimates. Relies on the accuracy of sales team estimations, which can be subjective.
- Market Changes. May not account for external market changes that affect the likelihood of deal closures.
- Deal Slippage. Deals may take longer to close than anticipated, impacting forecast accuracy.
Pipeline Revenue Model Example
Consider a B2B software company, SoftTech Solutions, with a diverse product portfolio. They have a detailed sales pipeline with opportunities at various stages.
SoftTech Solutions can project their revenue for the next quarter based on the opportunities likely to convert within their sales pipeline. Different parts of the portfolio will have their own pipeline revenue forecast calculations, based on:
- Purchase value
- Pipeline stage
- Deal conversion rate for that offering from the specific pipeline stage
To keep it simple, we’ll look at just a couple of variables. Let’s say SoftTech sells an accounting product with an average contract value of $50,000 and a security product with an average ACV of $20,000. There are 175 accounting qualified opportunities in the pipeline, and they convert from the Opportunity stage to a deal at a 25% rate. Meanwhile, there are 200 security accounts at the qualified opportunity stage, and they convert to deals at a 40% rate.
- Total Potential Pipeline Revenue:
$8,750,000 ($50,000 x 175 from accounting)
+ $4,000,000 ($20,000 x 200 from security)
= $12,750,000 - Total Projected Pipeline Revenue:
$2,187,500 ($50,000 x 175 x 25%)
+ $1,600,000 ($20,000 x 200 x 40%)
= $3,787,500
Top-down Model
The top-down forecasting model is a strategic approach that starts with an overall revenue target and allocates it to different departments, regions, or product lines based on historical performance, market demand, and other factors.
When You Might Consider Using This Model
Companies with a centralized decision-making process and a need for high-level, quick revenue estimates should consider using the top-down model. It’s especially valuable when detailed data at the department or product line level is limited or when speed is of the essence, such as revenue teams working on wealth management marketing strategies.
Pros
- Efficiency. Provides a quick, high-level revenue estimate, making it suitable for businesses that need to make rapid decisions or have limited resources for detailed data collection and analysis.
- Simplicity. Provides a consolidated view, helping to streamline the allocation of revenue targets.
- Alignment. Ensures revenue targets align with overall business objectives and targets, making it easier to implement company-wide strategies.
Cons
- Lack of Detail. Doesn’t provide granular insights into individual product lines, departments, or regions, which may be necessary for more detailed decision-making.
- Risk of Inaccurate Allocation. May not accurately reflect market dynamics or the potential of different segments, which can lead to suboptimal resource allocation.
- Limited Transparency. Department-level or region-level revenue targets may lack transparency into how they were determined.
Top-Down Forecasting Model Example
Let’s consider a B2B automotive company, AutoMotive Corp, that aims to forecast its annual revenue using the top-down model. They have a centralized planning process and want to quickly estimate revenue for the upcoming year.
AutoMotive Corp can use the top-down forecasting model to allocate revenue targets to their different product lines:
- Passenger Cars Division: $12,000,000
- Commercial Vehicles Division: $8,000,000
- Parts and Accessories Division: $5,000,000
The model provides a consolidated revenue forecast:
- Total Forecasted Revenue: $12,000,000 + $8,000,000 + $5,000,000 = $25,000,000
How to Calculate Revenue Forecasting
You can approach revenue forecasting using various methods. Additionally, leveraging sales intelligence software tools and spreadsheets can streamline the process.
Here’s a breakdown of how to calculate revenue forecasting, including the consideration of seasonality and trend analysis.
Using Simple Arithmetic Methods
You can calculate revenue forecasts based on a percentage increase or decrease in sales. For example, if your business has been growing at a consistent rate of 5% per quarter, you can apply this percentage to your current revenue to project future revenue.
You can also calculate an average of past revenue data over a specified period, like a 3-month or 12-month moving average. This can help smooth out short-term fluctuations and provide a more stable projection.
Leveraging Software Tools and Spreadsheets
Microsoft Excel is a powerful tool for revenue forecasting. You can create custom models and use built-in functions like AVERAGE, TREND, and FORECAST.
Excel also allows you to visualize data trends through charts and graphs, making it easier to understand and communicate your forecasts.
Incorporating Seasonality and Trend Analysis
To account for seasonality, examine historical data for recurring patterns, such as higher sales during the holiday season or lower sales in certain months. Adjust your forecasts accordingly to reflect these cyclical trends.
Trend analysis involves identifying long-term growth or decline patterns in your historical data. By recognizing these trends, you can project future revenue based on the direction in which your business is headed.
How to Build a Custom Revenue Forecasting Model
Standard forecasting models may not capture the intricate nuances of your business. With a custom model, you can pinpoint the precise factors that drive your revenue, providing more accurate forecasts.
Creating and maintaining a custom forecasting model may sound complex, but it’s well within reach with the right approach.
Step 1 – Define Your Objectives and Scope
What specific aspects of revenue do you aim to predict? This could be focused on product lines, customer segments, sales channels, or a combination. The key is to define the scope to match your specific business needs.
Step 2 – Gather High-Quality Data
Collect historical revenue data and any relevant variables that impact revenue. Your data must be accurate and consistent because your model’s reliability hinges on the data’s quality.
Step 3 – Choose the Right Methodology
Select a forecasting approach that aligns with your objectives and the nature of your data. This could involve pipeline analysis, regression models, or a blend of techniques.
Step 4 – Preprocess and Clean Data
Before applying the methodology, your data may need some tidying up. Address missing values, identify and handle outliers, and transform the data into a format suitable for analysis.
Step 5 – Validate the Model
Use techniques like cross-validation and out-of-sample testing to assess how well your model performs. Adjust the model based on validation results to ensure its accuracy.
Step 6 – Monitor and Update
Your custom model is not a one-time project. Continuously collect new data, validate the model’s performance, and make adjustments as needed to ensure it remains accurate and aligned with changing market conditions.
How to Overcome Forecasting Obstacles Due to The Dark Funnel™
The Dark Funnel™ — where B2B buyers conduct their research and decision-making processes, hidden from traditional tracking — poses significant challenges for revenue forecasting.
Here are a few ways to bring clarity to this otherwise elusive forecasting landscape.
Embrace AI-Powered Solutions
AI-powered revenue growth platforms are transformative in shedding light on The Dark Funnel™.
These AI marketing platforms leverage advanced algorithms to analyze and interpret anonymous buyer signals, bringing previously hidden insights to the surface. For example, using 6sense, you can access data that helps you discover:
- How many buyers are currently in the marketplace
- How deep they are in their buying process
- How much they are likely to spend on a solution
- The impact of your team’s efforts to reach and influence them toward a buying decision
Leverage Behavioral Patterns
Prospects are exhibiting the behavioral patterns that led to previously signed contracts right now, even if they’re invisible to your sales team.
For example, suppose historical data indicates that a particular combination of buyer actions often leads to a successful deal. In that case, you can actively monitor and target those actions in the present during the various stages of the B2B marketing funnel.
This approach can help you make more precise revenue predictions and craft growth marketing strategies tailored to what works best for your target audience.
Monitor Third-Party Platforms
B2B buyers frequently turn to review sites, engage on social media, and analyze news reports as part of their decision-making process, often far from the watchful eye of your revenue team.
You can gain valuable perspectives on buyer behaviors and preferences by actively monitoring these third-party platforms and staying attuned to the conversations and insights they offer.
This awareness allows you to adapt your strategies to align with the information and influences your potential clients encounter, ultimately contributing to more informed forecasting and decision-making.
Final Thoughts
Revenue forecasting isn’t just a tool. It helps you navigate resource allocation, spot opportunities, manage cash flow, boost investor confidence, and adapt to market changes.
To ensure your forecasts take your prospects’ buying behaviors in The Dark Funnel™, book a demo of 6Sense. See how AI technology can shed light on hidden data, providing a competitive edge in your revenue forecasts.