

Few roles within B2B organizations have transformed so dramatically within the past five years as the Chief Marketing Officer’s. CMOs must now comprehensively understand the market for their solutions, build differentiated brands through bespoke customer experiences, and optimize revenue generation … while being increasingly asked to do more with less.
And they’re under intense pressure to deliver results. In 2020, the average CMO tenure in the U.S. was a mere 3.3 years, its shortest since 2009. This tenure remained the same throughout 2021 and there’s little evidence that the trend will soon change.
Within this high-stakes, disruptive environment, particularly in the midst of the Great Resignation and Great Reset, CMOs are seeking insights into their ever-evolving roles such as salary and compensation. What is a fair salary for B2B CMOs? Are CMOs paid fairly among their peers?
To answer these and other questions, 6sense — in collaboration with hypergrowth CMO advisor Carilu Dietrich — recently surveyed 338 CMOs and senior-level B2B marketing leaders regarding their current compensation. Our ambition was to:
- Understand how companies perceive the value CMOs bring to their organizations, and
- Provide CMOs with compensation information to use in conversations and negotiations
The CMOs provided information about their base salaries, equity, bonuses, and other benefits. Some key finding from our respondents, many of whom work in the technology sector, include:
- Among the tech CMOs surveyed, male and female CMOs receive equal pay
- CMOs employed by privately-funded companies are likely to make less in overall compensation than those who work for VC-backed, PE-backed, or publicly traded companies
- CMOs employed among VC-backed, PE-backed, or publicly traded companies earn an equal average pay
- However, the way in which these CMOs reach that value is proportionately different in respect to base salary, equity, and annual bonuses
Let’s take a closer look.
Key Findings: Average Compensation for B2B CMOs
So what does the average senior marketing leader currently receive in salary and other compensation?
Average Compensation of Tech Marketing Leaders
Marketing leaders in the technology sector make an average cash compensation (salary + annual bonus) of approximately $240,000 to $325,000.
| Average Base Salary | $200,000 to $250,000 |
| Average Bonus (based on salary) | 20% to 30% |
| Average Equity (based on company’s value at start date) | .25% to .49% or $1 million to $2 million (gross value) |
| Average Annual Cash Compensation (salary + bonus) | $240,000 to $325,000 |
| Average Total Compensation
(salary + bonus + fully vested equity) |
$1.2 million to $2.3 million |
Note: Data is based on survey results of 338 B2B marketing leaders.
Source: 6sense
Download this chart here. |
Download this chart here. |
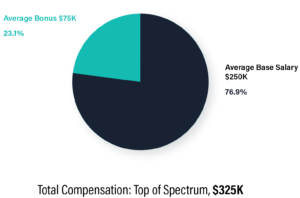
Top End of the Average Marketing Leader’s Total Cash Compensation
Marketing leaders who earn compensation at the top end of the survey’s spectrum take home an average $325,000 per year in total cash compensation (salary + annual bonus).
Bottom End of the Average Marketing Leader’s Total Cash Compensation
Marketing leaders who earn compensation at the bottom end of the survery’s spectrum were found to take home an average $240,000 per year in total cash compensation (salary + annual bonus).
Additional Insights Beget Additional Questions
While our data suggests a wide range in total compensation, the tech CMOs we surveyed earn:
- A base salary between $200,000 to $250,000
- An annual bonus between 20% to 30% of their base salary, and
- Equity between .25% to .49% of their company’s value when hired
Without considering equity, which may or may not vest, B2B marketing leaders make between $240,000 to $325,000 per year in total cash compensation (base salary + bonus).
When equity is factored into compensation, the average CMO’s fully vested equity typically has the potential to earn them $1 million to $2 million more in total compensation value over the course of the vesting period (two to five years).
Those numbers vary, with some leaders making substantially more or less than others. We conducted further analysis to examine the factors that lead to this variability, posing questions such as:
- Within marketing leadership, is there a disparity in pay between men and women?
- Does the amount of time a person has been in their role impact compensation?
- How does company financing and company size factor into compensation?
Here’s what we found.
Average CMO Salary is $200,000 to $250,000, Regardless of Gender
Women comprise 51% of CMOs, up from 47% in 2020 and from 23% in 2016. As more women make their mark in the CMO role, we examined whether gender contributes to how male and female CMOs are paid today.
As detailed in the chart below, no statistically reliable differences* were found between the average base salary, equity, and annual bonus of male and female CMOs.
*Here, a statistically reliable difference means that if the same survey were given to another set of similar marketing leaders, there would be a 95% chance of achieving a very similar result.
Average CMO Base Salary Among Men and Women
No difference was found between the compensation of men and women marketing leaders within the tech sector.
| Men | Women | |
| Average Base Salary | $200,000 to $250,000 | $200,000 to $250,000 |
| Average Bonus | 20% to 30% | 20% to 30% |
| Average Equity | .25% to.49% or $1M to $2M (gross value) |
.25% to .49% or $1M to $2M (gross value) |
| Annual Cash Compensation (Salary + Bonus) |
$240,000 to $325,000 | $240,000 to $325,000 |
| Total Compensation (Salary + Bonus + Fully Vested Equity) |
$1.2 million to $2.3 million | $1.2 million to $2.3 million |
Note: Data is based on survey results of 338 marketing leaders. Most survey respondents were drawn from technology companies that are financed through private equity or venture capital. This finding may not generalize to other market segments, leaving the question open for future research.
Source: 6sense. Download this chart here.
Marketing Leaders for Public Companies Earn the Highest Base Salary
We also examined how CMO compensation may differ when comparing the financial backing of the company, such as:
- VC-backed
- PE-backed
- Publicly traded
- Privately financed
Our study suggests the value of a CMO’s total compensation (i.e., base salary, bonus, and equity) won’t likely differ much unless the leader works for a privately financed company. There, CMOs can expect to earn less in overall compensation.
CMOs employed by privately funded companies typically earn a base salary between $175,000 to $200,000. However, this range begins at $200,000 or $250,000 at VC-backed, PE-backed, and publicly traded companies.
The same follows for annual bonuses. While bonuses given by privately financed companies range between 10% to 20%, the bonuses from companies in other categories start at 20% or 30%.
Lastly, while the equity given by private companies is similar to what’s offered by public companies (.10% to .24%), public companies offer far more in the form of salary and bonuses, thus leaving CMOs at private companies to make the least in total compensation value.
CMOs are Compensated Differently Based on Company Financing
While CMO compensation within VC-backed, PE-backed, and publicly traded companies are generally the same, the way in which they reach that total value varies substantially:
- Public and PE-backed companies rely more on bonuses than private and VC-backed companies do VC-backed companies make up the difference in equity
- Both VC-backed and PE-backed companies provide substantially more of the total compensation package in the form of equity
- Public companies provide equity packages very similar to private companies, but reach an average total compensation value similar to VC-backed and PE-backed companies through larger base salaries
Average CMO Compensation By Type of Company Financing
The total compensation provided by VC-Backed, PE-backed, and public companies are statistically the same, but differ in how they proportion their compensation package in respect to salary, bonuses, and equity. The total compensation provided by privately funded companies was found to be less than the companies in the other financing categories.
| Private | VC-Backed | PE-Backed | Public | |
| Base Salary | $175-200K | $200-250K | $200-250K | $250-300K |
| Equity | .10%-.24% | .50-.47% | .25%-.49% | .10%-.24% |
| Bonus | 10-20% | 20-30% | 30-40% | 30-40% |
Note: Data is based on survey results of 338 marketing leaders.
Source: 6sense. Download this chart here.
CMOs Who Earn More Equity Have Shorter Tenure
While one might expect CMOs with longer tenures to receive more pay, tenure does not influence total cash compensation (salary + annual bonus) among our surveyed CMOs. Whether marketing leaders have tenure less than six months, more than four years, or somewhere in between, their average salary and annual bonus will likely be the same.
When equity is added to the equation, marketing leaders with shorter tenures tend to earn more equity than they typically have in the past. When considered all together (salary + annual bonus + equity), there is a statistically reliable difference* that the least tenured CMOs (with fewer than than six months on the job) earn more than the most tenured CMOs (with more than four or more years on the job).
This trend may reflect the current state of the post-pandemic job market and what is popularly called the Great Resignation or the Great Reshuffle. Companies may be providing more robust compensation packages to attract and keep CMO talent. According to Pew Research, 63% of workers who quit their jobs in 2021 said it was due to insufficient pay.
*Here, a statistically reliable difference means that if the same survey were given to another set of similar marketing leaders, there would be a 95% chance of achieving a very similar result.
Average CMO Compensation by Job Tenure
Marketing leaders with less than six months on the job were found to earn more equity than those with four or more years. Otherwise, cash compensation (salary + annual bonus) was found to be statistically the same, regardless of tenure.
| < 6 months | 4+ years | |
| Salary | $200,000 to $250,000 | $200,000 to $250,000 |
| Bonus | 20% to 30% | 20% to 30% |
| Equity | .25% to .49% or $1 million to $2 million (gross value) | .10% to .24% or $0 to $1 million (gross value) |
| Annual cash comp (salary + bonus) | $240,000 to $325,000 | $240,000 to $325,000 |
| Total Comp. (salary +l bonus + equity) | $1.2 million to $2.3 million | $240,000 to $1.3 million |
Note: Data is based on survey results of 338 marketing leaders.
Source: 6sense. Download this chart here.
Smaller Companies Pay More in Equity
While total compensation may vary dramatically depending on company characteristics such as funding and tenure, a company’s revenue may be less of a driving force.
Although the graph below may appear to present strong differences in total compensation across company sizes, the only statistically reliable difference* is between the total compensation provided by a company with under $10 million in annual revenue and that of one with revenue between $50 million to $100 million.
Statistically speaking, the total compensation provided by companies in other revenue categories are more or less the same. What should be considered for future research, however, is how company growth rate may play a role in compensation.
*Here, a statistically reliable difference means that if the same survey were given to another set of similar marketing leaders, there would be a 95% chance of achieving a very similar result.
Average CMO Total Compensation by Company Revenue Range

Company size is not a driving force in total compensation.
Note: Data is based on survey results of 338 marketing leaders. During analysis, the scale values for salary, bonus, and equity were combined together to create a “total compensation score” that ranged from 1 to the highest possible value of 25. As shown in the graph, the average marketing leader earned a total compensation score between 9.5 and 11.5 which roughly translates to $1.2 million to $2.3 million.
Source: 6sense. Download this chart here.
Based on revenue alone, how can total compensation in other revenue categories be statistically the same? Let’s turn our attention to equity. As seen in the graph below, smaller companies provide more equity, making up for most of what they can’t often provide in other forms of compensation (i.e., base salary, bonus, etc.).
Average CMO Equity by Company Revenue Range

Smaller companies provide more compensation in the form of equity.
Note: Data is based on survey results of 338 marketing leaders.
Source: 6sense. Download this chart here.
Putting It All Together
While there’s a wide range in compensation for CMOs and enough movement happening across this role to match it, this survey’s insights can help us understand how CMOs are paid today.
Most encouraging, men and women CMOs are being paid fairly, at least within the technology sector. CMOs with varying tenure can also expect to earn about the same amount in terms of total cash compensation (salary + bonus); however, those with less than six months on the job may find themselves earning more equity than their counterparts, reflecting the hot market.
While the annual revenue of a hiring company may not make much of a difference in terms of a CMO’s pay, the financing behind the company is likely to have an influence. For instance, CMOs employed by private companies can expect to earn less in total compensation than if employed by a VC-backed, PE-backed, publicly traded, or privately financed organization.
The Final Analysis
- Today’s CMOs and those with similar titles earn an average base salary between $200,000 to $250,000, an annual bonus between 20% to 30%, and equity between .25% to .49% of their company’s value when hired.
- Gender does not make a statistically reliable difference in the way CMOs are paid.
- The least-tenured CMOs, on average, make the highest total compensation.
- Company revenue range does not play a significant role in compensation.
- Public companies pay higher base salaries than private, PE-, and VC-backed companies.
- Public and PE-backed companies rely more on bonuses than their private and VC-backed counterparts.
VC- and PE-backed firms provide substantially more of the total compensation package in the form of equity.
| About the Sample | |||||||
|
Tenure |
Title |
Company Financing |
Gender |
||||
| <6 m. | 19% | CMO | 52% | Public | 12% | Men | 39% |
| 6-12 m. | 19% | SVP/EVP | 14% | Private | 7% | ||
| 1-2 y. | 24% | VP | 32% | VC-backed | 46% | ||
| 2-3 y. | 16% | Other | 2% | PE-backed | 35% | Women | 61% |
| 3-4 y. | 9% | ||||||
| 4+ y. | 13% | ||||||
| 100% | 100% | 100% | 100% | ||||
| *100%=338 participants; “Other” under Titles include senior directors, directors, and senior managers. | |||||||
| Source: 6sense | |||||||
Download this chart here.
This survey was conducted with the participation of the CMO Coffee Talk online community in partnership with Carilu Dietrich, CMO and Advisor. CMO Coffee Talk is an open space for more than 1,300 CMOs to come together weekly with their peers and discuss timely, crowd-sourced topics. 6sense CMO Latané Conant and Matt Heinz of Heinz Marketing co-host these dynamic, illuminating conversations.


