- Search
- Integrations
- Contact Us
- Log In
- Marketing
CMO
Unite your revenue team and drive strategy across the business.
Demand Gen
Focus on in-market accounts and take the guesswork out of demand gen.
Digital
Reach the people and accounts that matter to your business.
How We Do It
Account Identification
Accurately match anonymous and known buyer behavior to accounts.
Intent Data
Uncover 3rd party buying signals at the keyword or topic level.
Predictive Analytics
AI-driven buying stage predictions align teams on the best time to engage.
Data Enrichment
Enrich accounts, leads, and contacts with accurate firmographic data.
Smart Form Fill
Autofill and shorten forms with automated, real-time form enrichment.
Audience Building
Create audiences for segmentation, activation, and analysis across channels.
Advertising
Reach target buyers with display, video, retargeting, and social ad campaigns.
Conversational Email
Leverage AI to craft personalized emails that qualify & convert accounts at scale.
Orchestrations & Workflows
Scale data operations with accurate engagement of accounts and contacts.
Create Your Very Own AI Email Assistant
Use AI to craft relevant, on-brand email campaigns that compel conversations and get more meetings booked. - Sales
CRO
6sense gives sales leaders the intel they need to deliver on big revenue goals.
Inside Sales
When working hundreds of accounts, knowing where to prioritize is critical.
RevOps
Use clean, complete data and scalable processes.
How We Do It
Company & Contact Data
B2B account and contact data with insights for when to engage prospects.
Account Intelligence
Arm reps with account insights in CRM & SEP for prioritization and personalization.
Prioritization Dashboards
Dashboards that help sellers uncover which accounts to engage and when.
Chrome Extension
Access Revenue AI insights directly from LinkedIn and other B2B websites.
Predictive Analytics
AI-driven buying stage predictions align teams on the best time to engage.
Buyer Intent Data
Uncover 3rd party buying signals at the keyword or topic level.
Prospecting Workflows
The insights sellers need in the tools they use, everyday.
Access FREE credits to unlock relevant contact info, and see our packages for teams of all sizes. - Solutions
Industries
Business Services
Drive efficiency with a data-driven approach.
Financial Services
Acquire loyal customers with rich secure data.
Manufacturing
Modernize revenue creation with AI-driven data.
Technology & Software
Drive growth and boost customer adoption.
Transportation & Logistics
Boost conversions with targeted audiences.
Data
Our Data
6sense delivers the most complete dataset for B2B.
Data APIs
Real-time enrichment and personalization anywhere.
Data Packs
Reduce manual processes to achieve database connectivity.
Ecosystem
Integrations
Explore our powerful integrations with leading technologies.
Become a Partner
Let's do more than just work together – let's revolutionize B2B.
Agency Partners
Need some help? Get support from our partners.
Dive into 6sense Revenue AI™
Reinvent the way your team creates, manages, and converts pipeline to revenue.
- Resources
Resource Library
Dive into various topics and content types.
Blog
Short insights, designed to educate.
In-Market Demand Report
Know which companies are interested in you.
Guides
Follow our in-depth articles & how-to’s.
6sense for 6sense
See how the 6sense team uses 6sense.
Revenue Makers Podcast
Steal playbooks from industry-leading brands.
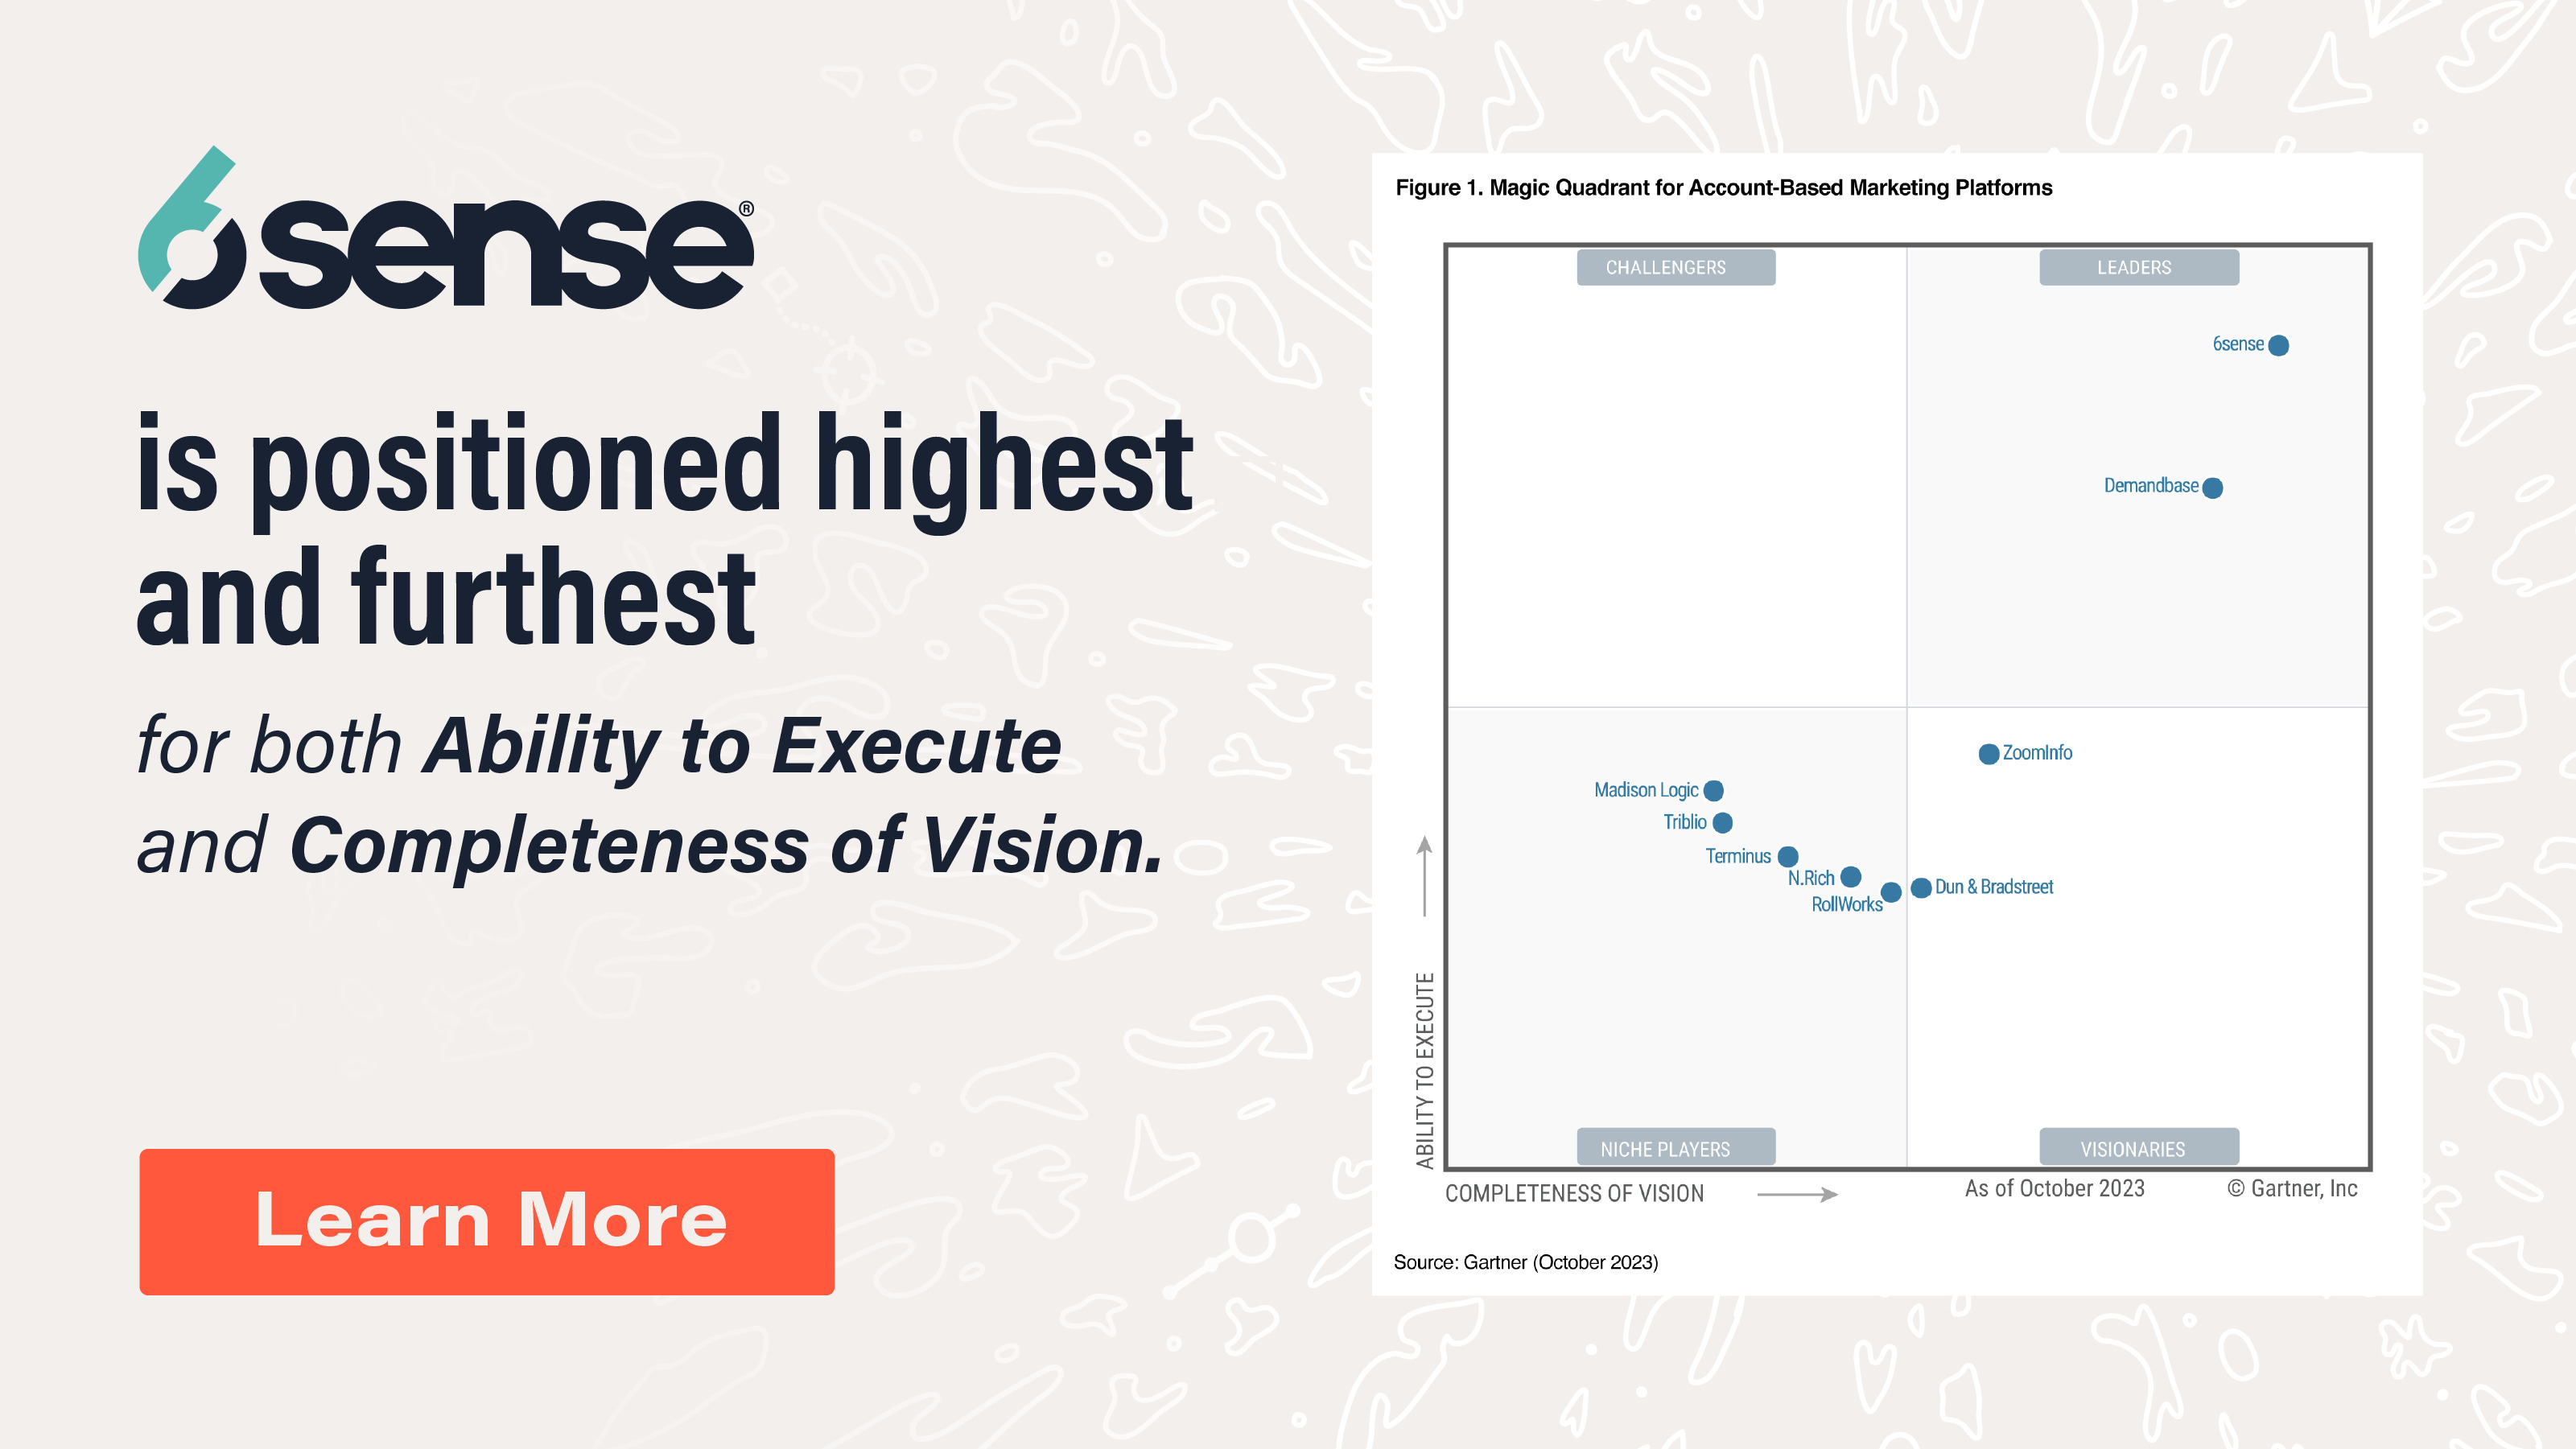
6sense Named a Leader in Gartner Magic Quadrant for ABM for the 3rd Year in a Row
No email required to get a copy of this objective evaluation of the ABM vendors.
- Customers
Meet Our Customers
See how companies like yours leverage 6sense to drive efficiency.
Customer Stories
Dive into the success and journeys of our customers .
Customer Reviews
Read real reviews to understand what 6sense can do for you.
RevCity
Connect with your peers, share successes, and learn about 6sense.
Knowledge Base & Support
Explore our help articles, product updates, and submit support tickets.
WE GET YOU. WE GOT YOU.
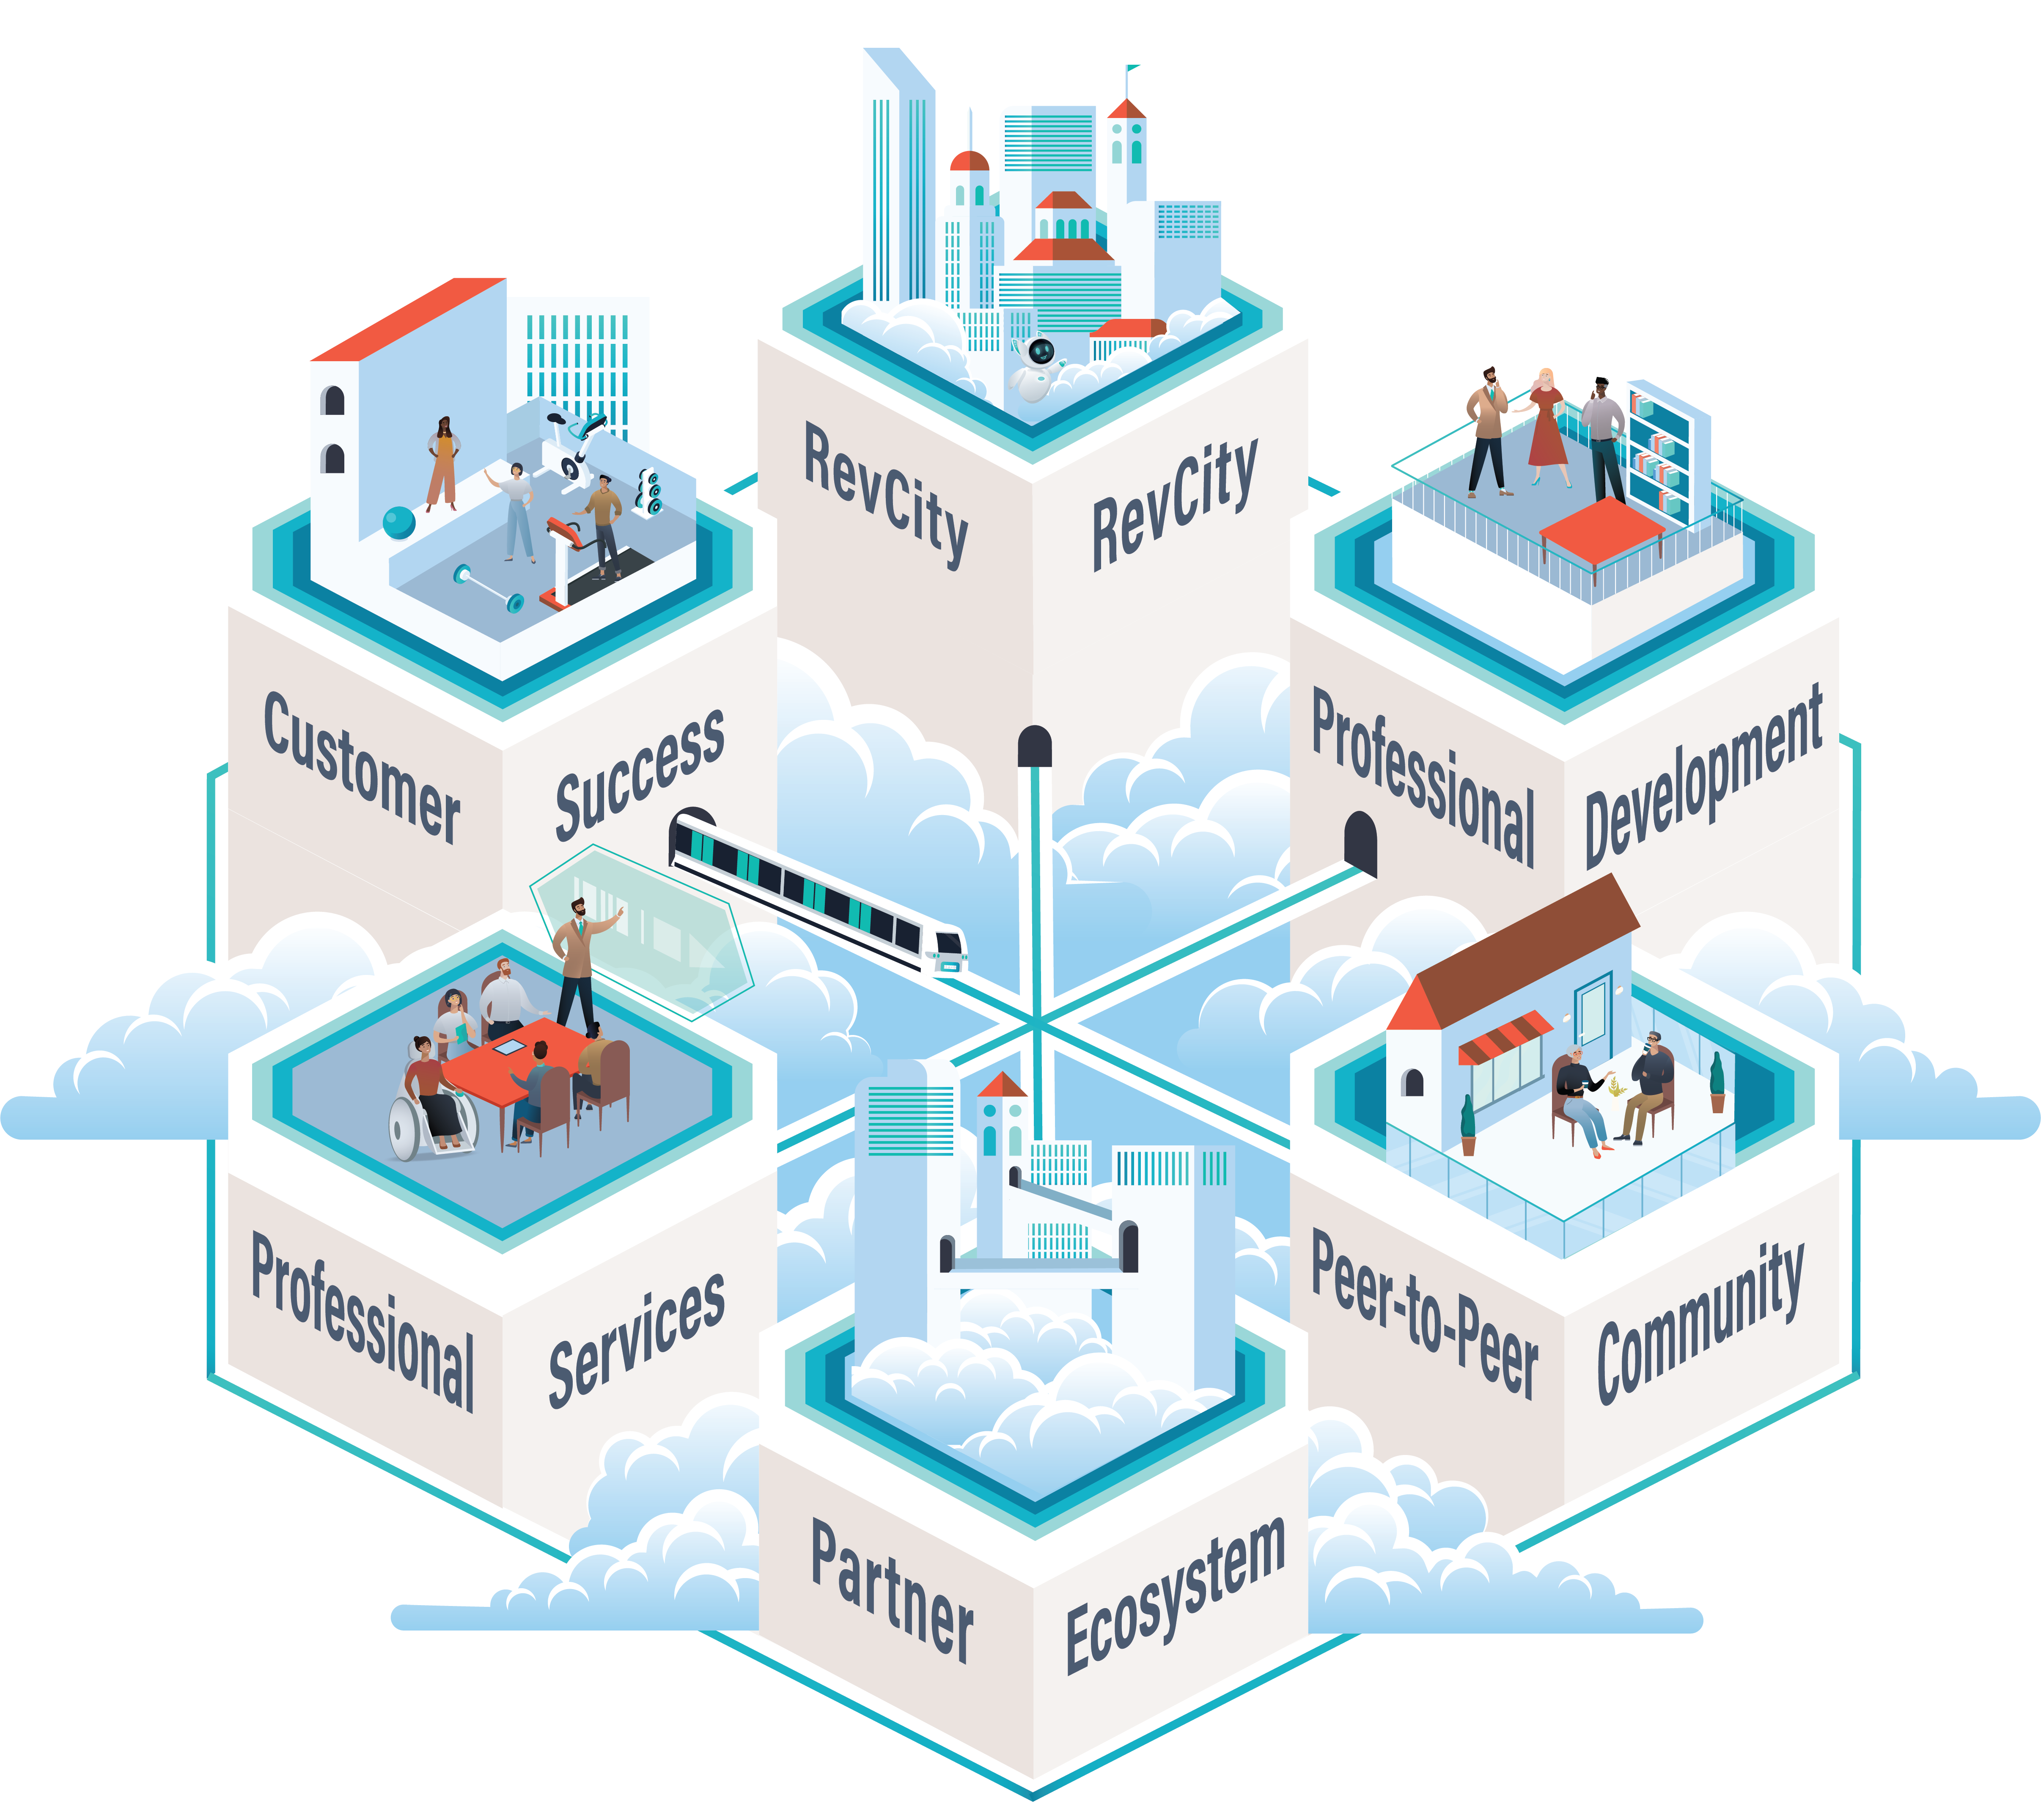
Introducing the 6dimensional Success Model™ – a methodology that empowers customers to unleash their full revenue potential and and achieve extraordinary outcomes.
- Company
About 6sense
Learn about our company values, vision, employee benefits, and more.
Leadership Team
Dreamers and data nerds; Meet the leadership team behind 6sense.
Careers
We want 6sense to be the best chapter of your career.
Newsroom
Read press releases, thought leadership, company announcements and more.
Community
Dive into the communities 6sense hosts and takes part in.
Become Our Partner
Let’s do more than work together. Let’s revolutionize B2B together.