More
Template is not defined.
Buyer Experience Report
The 2023 6sense B2B Buyer Experience Report

Why Buying Cycles Are Usually Over Long Before You Ever Know About Them 6sense Research

Introduction

Over the past decade, breakthroughs in technology and organizational processes have transformed how B2B sales and marketing teams identify, and communicate with, prospective customers.

And while these innovations — such as account-based marketing, buyer intent signals, and artificial intelligence — deliver unparalleled insights into buyer behavior and in-market accounts, they can’t truly see inside the “black box” of the B2B buying experience.

Buying teams in B2B make difficult, impactful, and often risky decisions about what to purchase to pursue their business goals. They are leery of being sold and so conduct most of their buying process independently.
This sparks questions that bedevil B2B marketers and sellers, such as:
  • How long is an average B2B buying cycle, and at what point are buyers ready to directly engage with sellers?
  • Who most often initiates this direct contact? Sellers or buyers?
  • How established are a buying team’s requirements, pre-contact? How flexible are those requirements, post-contact?
  • Do factors such as importance, price, and other factors influence buying cycle length?
  • What factors have the greatest influence over the size of B2B buying teams?
  • How many interactions do buying teams have with sellers? How do these interactions impact sales cycle length?
  • How can sellers influence buying teams in ways that simplify and shorten the buying process?

These questions have stymied sales organizations for since … well … forever. Answering them could radically improve how (and when) sellers engage prospects, which leads to more deals closed, faster. And it could motivate sellers to embrace practices that reduce the $2 trillion that’s wasted annually on inefficient, outdated B2B sales and marketing processes.

6sense Research found answers to those questions. We conducted a 33-question survey with over 900 B2B buyers across many industries, eager to demystify the timing of — and crucial moments within — their B2B buying experiences. We wanted to learn about how their buying teams worked, too.

Within the microcosm of B2B marketing and selling, we believe these findings are revelatory. They were compiled, analyzed, and rigorously vetted by a team led by Kerry Cunningham, a former Vice President, Principal Analyst for Forrester and Senior Research Director & Team Leader at SiriusDecisions.

Let's go.

$2 Trillion Wasted

In July 2023, Boston Consulting Group released a report that said B2B companies throw away $2 trillion every year due to wasteful, old-school sales and marketing approaches. Read our write-up here.

Take the Survey

Interested in seeing our survey and taking it yourself? Visit this webpage. We’ll update this report’s findings with your responses in the future!

About Kerry Cunningham

Kerry is a thought leader in B2B marketing and is a former SiriusDecisions and Forrester analyst.He’s an expert in the design and implementation of demand-marketing processes. technologies, and teams for a wide array of B2B products, solutions, and services.
LinkedIn.

Chapter 1

The Big Picture

Read Time: 245 Words; A little over 1 minute

Here’s the highlight reel of our report. We urge you to read beyond this section to discover the context of these findings, the particulars on how they affect the B2B selling experience, and how sales organizations can use them to streamline and accelerate the buying process.

First, Let’s Level-Set:

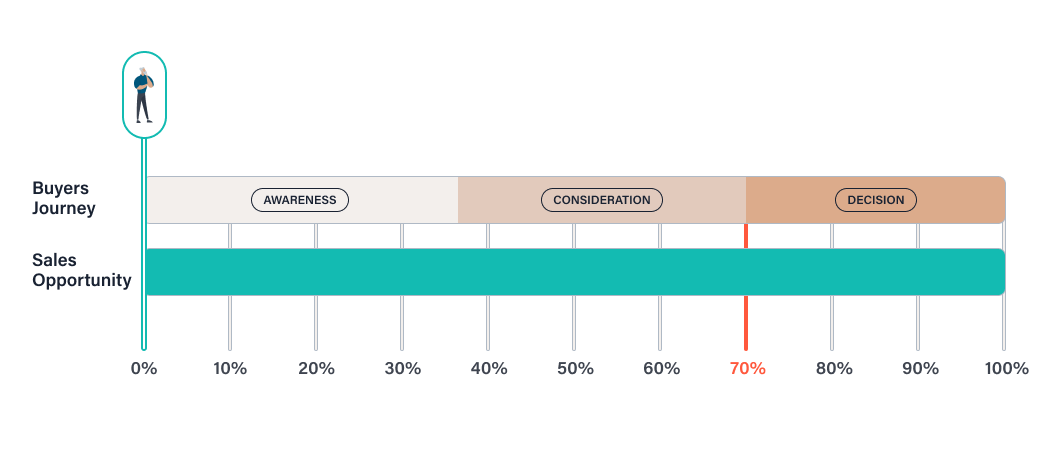
By the time B2B buyers engage sellers directly, they’re 70% through their buying process. In a typical B2B deal cycle, that’s eight months in.

83% OF BUYERS
INITIATE FIRST CONTACT

Why It Matters:

Throughout the sales cycle, buyers are in the driver’s seat. When buyers and sellers finally connect, buyers initiate first contact 83% of the time. They consider an average of four suppliers, but they have largely made their decisions by the time they get in touch. Eighty-four percent of the time, the first vendor contacted ultimately wins the business.

Even if a vendor is first on that list, 78% of B2B buyers have completely or largely established their requirements before making first contact. Those requirements don’t change in the home stretch of the buying process.

Timing Is Everything:

This means if vendors haven’t won over buyers who are conducting research on the anonymous B2B web — aka the Dark Funnel™ — during the first two-thirds of the buying process, they have a mere 16% chance of winning the deal.

That’s if  they find out about the deal at all.

84% OF DEALS ARE WON/LOST
BEFORE YOU KNOW ABOUT THEM

Bottom Line:

84% of deals are won or lost before providers know they even exist. To achieve a meaningful advantage during the sales process, revenue teams should identify these hidden opportunities long before the “70% Constant,” when buyers initiate contact. This empowers vendors to become the providers of choice, which places them well ahead of competitors.

Next Steps:

Buyers contact sellers when they’re good and ready. But B2B sellers can provide valuable educational and consultative experiences beyond the selling process that create a competitive edge, like:

  • Thought leadership content
  • One-on-one Subject Matter Expert consultations
  • Practitioner communities
  • Educational events

This early-stage positioning can reduce the number of vendors that buyers consider before they arrive at the 70% Constant… and affect which vendors are top-of-mind when it’s time to engage sellers.

The Dark Funnel™

The Dark Funnel is a part of the B2B web that most marketing platforms can’t detect. The Dark Funnel comprises online trade publications, social networks and other digital resources. It also includes the anonymous traffic on B2B vendor websites, and even the leads that B2B vendors never follow-up on. Nearly all of the B2B buying journey occurs in this Dark Funnel. Without all of these signals, marketers are left flying blind…

Learn more about the Dark Funnel

Chapter 2

A Closer Look

Read time: 690 words, about 3.5 minutes

Here’s an abbreviated version of the journey presented in the next section, 3: The Deep Dive. Check out that section to explore approach, the data, and the report’s crucial takeaways.

Our Survey Respondents and Their Buying Cycles

  • We surveyed 900+ individuals who’d participated in the buying process for a B2B purchase of greater than $10,000 in annual value within the last 24 months.
  • Respondents represented a wide variety of industries, departments and organizational levels.
  • Across all respondents, the average buying cycle was just under 11 months from the time research began until the time a provider was selected.
  • The first time B2B buyers directly contact a vendor’s sales team comes at just under the 8-month mark.
  • This means that the average point of first contact occurs 69% of the way through a buying cycle.

The ‘70% Constant’

  • 70%

    This point of first contact of approximately 70% is remarkably consistent across industries and departments, as well as solution and purchase types, and solution price points.

  • 70%

    We found this 70% threshold is effectively a constant in B2B buying.

Buyers Drive First Contact, Not Sellers

  • 83%

    In our survey, 83% of buyers initiated first contact with vendors.

  • Buyers initiate contact when they’re ready to engage and rarely before that.

  • This clearly suggests that sellers learn about buying processes on buyers’ terms, not their own.

  • Even when buyers do respond to SDRs, they do not have first contact earlier than those who initiated the contact.

Length of Sales Cycle and Preferred Vendor Status

  • 70%

    As mentioned, B2B buyers directly contact vendors when they’re about 70% into the buying process.

  • Vendors have little influence on this timing. When buyers directly engage sellers, it’s at time of their choosing.

  • 78%

    By the time of this first contact, 78% of buyers have completely or largely established their business requirements. Sellers have little influence over this, post-contact.

  • 84%

    Further, 84% of buyers said the first vendor they contacted ultimately won the business.

  • This means if vendors haven’t won buyers over during the first two-thirds of the buying process, they have a mere 16% chance of winning the deal.

  • This suggests that when providers receive an MQL, whether they are going to win or lose the deal, as well as the nature of the deal itself, is largely decided.

How the Importance of a Purchase Affects Buying Cycle Length

When buyers consider a purchase important to their organization, the buying process takes less time, not more.
This indicates that business-critical purchases are prioritized and streamlined over less important ones.
Larger buying teams report shorter buying cycles, not longer ones. This may be because larger organizations have more mature purchasing processes and personnel who can dedicate more time to evaluating solutions.

How Buying Team Size Affects the Buying Cycle

  • As a refresher, in B2B, a “buyer” isn’t an individual — it’s a team of individuals, and each plays a distinct role in the buying process.

  • On average, B2B buying teams include just over 9 members, according to our survey respondents.

  • Sellers want to shorten buying cycles by affecting the size of the buying team, but cannot often do that directly.

  • However, sellers can affect buying team size indirectly since team size is strongly influenced by the number of vendors being evaluated.

Eliminating Competitors Shortens the Sales Cycle

  • Buyers, on average, consider four vendors when purchasing a solution.
  • Each vendor considered beyond this average adds about two members to a buying team and two months to the buying process.
  • Buying teams likely increase to meet the demands of conducting multi-vendor evaluations.
  • The number of considered vendors also increases the quantity of interactions that each team member must make with sellers.
  • All buying team roles have more than 15 interactions with each vendor being evaluated.
  • Adding one vendor increases the total number of buyer-seller interactions to nearly 30 interactions per person per vendor.

Bringing It Together

  • To achieve a meaningful advantage during the sales process, B2B sellers should exert considerable effort to intervene early in the buying process.

  • Intervening means engaging buyers digitally and by establishing relationships with buying team members outside of the typical sales processes.

  • This engagement can include:
    • Thought leadership content
    • One-on-one Subject Matter Expert consultations
    • Practitioner communities
    • Educational events
  • 70%

    This should occur long before the “70% Constant,” where buyers initiate first contact with sellers.

  • This early engagement could influence buyers toward their solutions and eliminate competitors whenever possible.

  • This can simplify and shorten the buying process.

Chapter 3

The Deep Dive

Read time: 6,800 words; about 34 minutes

It is a truism that in B2B, buying and the teams of people who do the buying are complex. But it is also true that each buying process — and therefore each selling process — is unique.

In this report, 6sense Research sought to understand the factors that influence:

How long buying processes are
How many individuals participate in the buying process
The number of vendors that are evaluated, and
Which actions buyers take and value during the buying process, among much else

Methods

Survey Participants

We surveyed over 900 individuals who had been involved in B2B purchases exceeding $10,000 in annual value within the last 24 months.

Our study included participants from a wide array of industries, departments, and organizational levels, with accounting/legal and purchasing departments, along with IT, being the most commonly represented. Less than 2% of respondents held individual contributor roles, while the remaining participants held titles distributed evenly from manager to senior executive positions.

The tech industry formed the largest segment of our sample at 30%, while business services, professional services, manufacturing, and financial services each comprised approximately 15%. A category labeled “other,” which allowed participants to specify their industry, made up the smallest portion at 10% of the sample.

Findings

This Much Is True: It’s Nearly Over When We Meet

For years, B2B revenue professionals have heard things like, “The buying journey is two-thirds over before anyone talks to sales,” and “Two-thirds of the buying process is done digitally.”

Turns out, this is true.

In our survey, we asked B2B buyers at what point in their buying journeys they first had direct contact with marketers or sellers from vendor organizations. (We called this the “point of first contact.”)

Across all our respondents, the average buying cycle was just under 11 months from the time research began until the time a provider was selected. (A full discussion of buying cycle length and the factors that impact it follows later in this report.) The point of first contact came in at just under eight months.

This means that the average point of first contact was 69% of the way through a buying cycle.

The Point of First Contact Constant

Next, we tested a wide variety of the factors we collected from buyers to assess how they might influence point of first contact. For example, would solutions that buyers deem more important cause them to reach out to providers earlier in their buying process? For instance, this might be to ensure they had all the information they’d need to make good decisions.

The clear answer we found is that, no, none of the dozen-plus variables we captured had a meaningful impact on point of first contact. The point of first contact of approximately 70% is remarkably consistent across industries and departments, as well as solution and purchase types, and solution price points (see details of the analysis in the appendix).

The point of first contact is effectively a constant in B2B buying.

Don’t Call Me, I’ll Call You

We also asked buyers to indicate whether they initiated first contact, or if instead the initiative was taken by the seller.

We reasoned that if buyers are initiating contact, sellers have little control over when they find out about a buying process. If, instead, these interactions primarily result from seller outreach, this suggests that sellers are effectively targeting in-market buyers.

In our survey, buyers indicated that they were the ones initiating contact 83% of the time. This clearly indicates that sellers are finding out about buying processes on the buyer’s terms. Undoubtedly, sellers had in many cases reached out to these buyers prior to that initial contact. In fact, buyers who report responding to SDR overtures do so at the same point in the journey as buyers who initiate contact themselves. However, what our participants’ responses suggest is that whether sellers are reaching out or not, buyers initiate contact when they are ready to engage and rarely before that.

As with the timing of first contact, this finding is not meaningfully influenced by any of the factors we assessed in our study.

Oh, I Already Know What I Want

Given that buyers determine when they will engage with sellers and only do so deep into their buying process, we surmised that buying teams might already have established their requirements — and perhaps even chosen frontrunners — in their search by point of first contact.

Both of these suppositions were confirmed by survey participants.

Seventy-eight percent of buyers told us that at the time they initiated contact with sellers, their requirements were completely set or changed only slightly after initial contact:

Perhaps of greatest interest, 84% of buyers also reported that they reached out first to the vendor that ultimately won (see chart below). There are two ways that this can be interpreted.

  • Interpretation 1:

    It may be that the first vendor to interact directly with the seller has a strong advantage over those who come after.

  • Interpretation 2:

    Alternatively, given that requirements are completely or largely established at the time of that first contact, it seems more likely that buyers have largely decided who they would like to do business with at the point of first contact. And there’s not much room to change what the buyer has already decided they want.

Of course, either of these explanations may be true in any given case, and both may be true in many cases.

Either way, buyers clearly indicated that they conduct most of their buying journey before engaging directly with providers, and that when they do, they do it on their own terms. They have already established their requirements and chosen favorites in the race for their business.

It is clear that buyers largely make their preliminary decisions out of view and prior to engaging with sellers. The data also tell us that simply hounding buyers before they are ready is very unlikely to produce a result. Buyers simply don’t respond until they are ready, and if they do respond, the data suggest it is not good news for the organization that reaches them early.

But, suppliers are not helpless. There are a wide variety of mechanisms through which provider organizations can begin and nurture relationships with decision-makers outside of a selling process.

Thought-leadership content appropriate to buyer needs and preferences for content consumption is table-stakes. In addition, however, high-performing organizations are also engaging buyers through one-on-one Subject Matter Expert consultations, practitioner communities, educational events, and other similar tactics that deliver value to buyers outside of demos and sales calls.

Source: 6sense

B2B Buying Is a Team Sport

One of the most important developments in the field of B2B revenue generation over the past decade is that marketers have gradually adopted the understanding that for all but the smallest purchases in B2B, the buyer is not an individual but a team of individuals, each with distinct roles in the buying process.

Significance is not importance

Statistical significance is a measure of how reliably a finding represents the population or real-world condition of interest. However, the word “significance” can be misleading. It can make people think that a statistically significant finding is also important or meaningful. But this is not always the case. In fact, many findings that are statistically significant are not really significant in any way that we would care about. When we encounter findings that are statistically “significant” but not important, we describe them as “not meaningful.” For instance, in our research of B2B buying processes we found that buyers reliably consume vendor content (e.g., website, webinars) more than they read analysts reports, but only by 4%. Thus, is an example in which we found a “statistically significant” finding that is not very meaningful.

This finding is consistent with many similar findings from across B2B over the past half decade. Despite this now well-known fact, a substantial portion of B2B marketing organizations still struggle to recognize when buying teams, rather than lone individuals, show interest in a solution at the same time.

Just How Big Are Buying Teams?

JUST OVER 9 INDIVIDUALS

Survey respondents reported that they were members of buying teams comprising just over nine individuals, on average. Of course, as with the length of buying cycles, there are a number of factors that influence the size of those teams.

To assess the influences on buying team size, we conducted a correlation analysis with four factors that we hypothesized might be influential:

Marketers and Buyers

To learn more about how marketers still struggle to recognize buying teams, see our “Who’s (Not) Using All The Buying Signals – And Who Should Be” report.
Find it here

  • The number of vendors evaluated

  • Purchase cost

  • Solution importance, and

  • Company size (indicated by company revenue)

Our analysis showed that the number of vendors being evaluated and the cost of the solution were both correlated with the size of the buying team.

An increase in either was reliably associated with a meaningful increase in buying team size. Decreases in either were also associated with a decrease in team size. While company size and the importance of the solution were also correlated with buying team size, their impacts were negligible. (Click here for all statistics concerning buying group size).


Additionally, we investigated whether…

  • Company funding type
  • Industry
  • Buyer department
  • Solution type
  • Purchase type, or
  • Company size

…had a significant impact on buying team size. However, none of these additional factors appeared to have a meaningful influence on buying group size.

Correlation

Correlations measure whether changes in one factor are reliably associated with changes in another. The easiest correlations to think about are those where one measurement increases, and then a second one also consistently increases. For example, in our research on B2B buying processes, we found that when buyer’s increase the number of vendors they evaluate, their buying process takes longer. That is a positive correlation. In contrast, we found a weak but reliable negative correlation between how important a buyer rates a solution and the length of the buying cycle. More important solutions have reliably shorter buying cycles .

These tests assessed whether each of the variables mentioned are related in some way to buying team size. They examine each variable in isolation from others. However, in the real world, these factors do not exist in isolation from the others and are all in play at the same time.

To better understand why some buying teams have just a handful of members while others have 20 or more, we performed a multiple regression analysis, incorporating the four factors derived from the correlation analysis — purchase cost, solution importance, and company size as indicated by company revenue — into a model to predict buying team size.

The results from this model would tell us how much of the variability we observed in buying team sizes can be predicted by the factors we measured in our survey. This multivariate test would also allow us to assess the relative importance of each factor on buying team size.

52.8%

A Robust Model for Predicting Buying Team Size

Together, the number of vendors evaluated, purchase cost, and solution importance accounted for an extremely robust 52.8% of the reason why a buying team is smaller or larger than the nine-person average.

The number of vendors included in the evaluation accounted for a considerable share of that variability — more than double the next most important factor, which was the cost of the solution.

Next, we hypothesized that solutions that were deemed to be more important would also have larger buying teams assigned to them. However, we found the opposite.

To assess this, we asked buyers to rate how important the solution under consideration was on a scale where 1 equaled “Nice to have,” 3 equaled “Important,” and 5 equaled “Essential.” Across our sample, participants rated their purchases midway between being Important (3) and Very Important (4).

Contrary to our expectation, solution importance had only a small influence on buying team size, and more important solutions tended to have slightly smaller, not larger teams.

The size of the buying company as measured by annual revenues did not make a meaningful impact on the size of buying teams and was therefore excluded from the model.

The two key predictors — number of competitors and solution price — accounted for nearly all (52.4%) of the predictive power of the three-factor model (52.8%).

Each additional vendor considered beyond the average of four typically adds just over two people onto the average buying team size of just over nine while each $100,000 increase in purchase cost adds about half a person to the buying team.

These results suggest that as competitors are added or subtracted from the evaluation list, the additional work required to evaluate them causes teams to add personnel. And, as solutions become more expensive, organizations add resources, perhaps in areas such as purchasing, procurement and finance, to help evaluate vendors. We discuss these factors in greater detail in a later section.

6sense Research recommends that organizations ensure that all competitive positioning content that might help buyers decide which vendors to evaluate be ungated. Also, where organizations have competitors that appear in all or most competitive cycles, proactively recommend to buyers that they evaluate that core set of solutions — to the exclusion of fringe competitors.

By doing so, organizations may help buyers limit the number of times fringe competitors are included in evaluations. Offering buying guides that also include other competitors — or at least capability sets that are core to the key suppliers may help buyers settle on a smaller evaluation set.

Likewise, pointing buyers to external resources that do the same may also help buyers settle on a smaller set of competitors, hence reducing the complexity of their decision and shortening buying cycles.

Phone-A-Friend for B2B Buyers

As we have seen, B2B buying groups are large. But they are not the only influences on what an organization buys. Organizations frequently rely on trusted advisors — consultants and industry analysts — for input into what they buy. To assess the circumstances in which organizations utilize consultants and analysts, we asked participants to indicate if they used either or both during their buying process.

First, we tested whether buyers that use consultants differ from those that use analysts along any of the key buying cycle parameters we have examined in this report. These parameters include:

  • The size of the buying company

  • Number of vendors evaluated

  • Purchase size, and

  • Solution importance

(Click here for all statistics concerning the use of outside resources.)

What became clear from our analysis is that there are many differences between buying teams that use outside resources and those that don’t. However, there are no meaningful differences between organizations that use either consultants, or analysts, or both. Organizations appear to either use outside resources or not, irrespective of which type of outside resource.

Given that, for the remainder of our analysis, we grouped participants into two groups: those who used an outside resource and those who did not. Examined this way, there were clear differences between the two groups. For example, buying teams that tend to use outside resources also tend to:

  • Evaluate more vendors

  • Purchase more expensive solutions

  • Have 2x longer buying processes

Surprisingly, company size and the perceived importance of the solution to the organization did not influence whether an organization used outside resources.

As with prior analyses, we also tested whether the purchase type, solution type or the buyer’s industry influenced whether an organization used outside resources.

Multiple Regression Analysis

Multiple regression (more formally, Multiple Linear Regression) is a statistical method used to predict an outcome (such as buying cycle length) from various factors that might impact it (such as solution price, number of vendors under evaluation, and how important the solution is to buyers). In our example, we use this method to figure out how much these three factors (price, number of vendors, solution importance) can clarify why buying cycles vary. Multiple regression also provides a measure of how important each factor is to the model’s prediction.

Chi-square tests revealed that organizations that use outside resources differ from those that don’t on all three factors. However, the differences observed between the two groups for industry and purchase type were found to be small, whereas the differences in solution type were somewhat larger.

Next, to test the relative influence of these factors on whether an organization uses outside resources, we entered the number of vendors used, solution cost, length of buying cycle, and the solution type into a logistic regression model predicting whether an organization would use outside resources or not.

Results from this analysis indicate that this set of factors produces a reasonably good-fit model, predicting whether an organization would use an outside resource in the purchasing process. Analysis shows that the model would correctly predict when an organization does not use an outside resource approximately 48% of the time, while predicting when they will use outside resources 94% of the time for an overall accuracy rate of 83%.

In this model as in our earlier analyses, the number of vendors a company evaluates was the strongest single factor predicting whether the organization used outside resources, with the solution price having just a very small influence on the likelihood that a buying team will use outside resources.

In this model, a number of the different solution types had a substantial impact on the likelihood of using an outside resource. When controlling for the number of vendors evaluated, solution cost, and length of the buying cycle, buyers of hardware or equipment purchases, individual machinery/heavy equipment, professional services solutions, and software perpetual licenses were all less likely to utilize outside resources than the average buyer in our sample. Buyers of other solution types were no more or less likely to consult with outside resources than the average of our full sample (76%). Please refer to the chart below.

Note 1:

In the graph above, buyers of the solution types highlighted in red are those that were found to be less likely to utilize outside resources than the average buyer in our sample.

Chi-Square Test

The chi-square test is a statistical test that can be used to see if there is a relationship between two groups. It helps us understand if there’s a meaningful connection or if any observed relationship is just due to chance.

By comparing the actual data we have with what we would expect by random chance, the chi-square test helps us make informed decisions about relationships between categories.

For example, in our study investigating how B2B organizations measure their marketing efforts, we examined whether there was a connection between practicing account-based marketing (ABM) and the measurement of Marketing Qualified Leads (MQLs).

We discovered that a higher proportion of marketers in our sample measured MQLs than what we would anticipate by random chance, indicating that, in general, organizations are more inclined to measure MQLs than not.

Buying Cycles: Long and Winding Roads That are Largely Hidden from View

Across our sample of B2B buyers, participants reported that an average buying cycle was just under 11 months. Not surprisingly, our participants reported a wide range of buying cycle lengths, from one to 36 months. What leads to such wide variation in buying cycle lengths was a central focus of our study.

To begin with, many factors that influence the duration of B2B buying cycles are unpredictable, uncontrollable, and often unknown to revenue teams. These factors include intricate relationship dynamics (both personal and corporate) within buying teams and between buying and selling organizations. Other likely factors include unexpected changes in economic and market conditions, the business performance of buying and selling organizations, and many others.

Common but unforeseeable factors — like personnel changes, shifts in offerings and messaging, competitive disruptions, and the performance of team members — further contribute to the unpredictability of B2B buying cycles.

In addition to those, however, are a number of factors that may more readily be measured, anticipated, and in some cases, managed by selling organizations. We captured eight such quantifiable factors. For example, respondents reported on the annualized cost of their purchase, how many competitors were considered, and much more (see below).

The Quantifiable Factors

Factor Description Unit of measure
Point of First Contact

The point in the buying journey where first direct contact between buyer and seller occurs.

Months
Buying Team Size

How many individuals are on the buying team.

People/ headcount
Number of Interactions

How many interactions an individual has with the winning vendor, including all digital and person to person.

Respondent estimate in whole numbers
Losing Vendor Interactions

How many interactions an individual has with losing vendors.

5-point scale with 1 = Many fewer, 3 = About the same as winner, 5 = Many more
Purchase Cost

The annualized value of the purchase.

12-point scale, 1= $10k to $50k, 6 = $401k to $500k, 12 = > $1 million
Solution Importance

Respondent’s opinion about the importance of the solution to the organization.

5-point scale with 1 = Non-essential/nice to have, 3 = Somewhat important, 5 = Essential
Competitor Count

How many vendors were evaluated?

Respondent estimate
Company Size

Measured in annual revenues.

Two-part question with 27 possibilities from $100k or less to $10 billion or more

As with our examination of buying team size, we first conducted a correlation analysis with the factors that could be quantified, examining the relationships between the length of the buying cycle in months, as reported by our participants, and the factors described in the table above. (Click here for all statistics concerning buying cycle length)

Quantifiable Factors

Purchase Cost

As anticipated, our study revealed that higher-priced solutions generally result in longer sales cycles.

This relationship was evidenced by a reliable, moderately sized correlation coefficient between solution cost and sales cycle length, suggesting that cost exerts a meaningful upward influence on the length of a buying cycle.

Solution Importance

Another factor we anticipated might lead to more rigorous evaluation processes (and hence longer buying cycles) is the importance of the solution to the buying organization.

Like our finding concerning buying team size, Solution Importance was inversely related to Buying Cycle Length, such that more important solutions tended to have shorter rather than longer buying cycles. While this effect was a small one, it may indicate that importance leads to urgency and a greater organizational prioritization of the solution evaluation process.

Further tests suggest that importance does not necessarily increase the rigor of the evaluation process. For example, importance does not increase the number of interactions buyers have with sellers, nor the number of individuals on the buying team. Our hypothesis that greater importance would lead to longer sales cycles was clearly refuted.

Effect size

Effect size is a measure of how much of a difference something really makes. For example, in our research we found that IT buyers and non-IT buyers reliably rated the helpfulness of their interactions with potential suppliers differently. On a five point scale, non-IT buyers would be expected to rate seller interactions between 4.184 to 4.286 while IT buyers would be expected to rate their experience between 4.307 and 4.483. The top of the range for non-IT buyers is just .022 points below the bottom of the range for IT buyers. It’s a statistically reliable difference, but not a meaningful one. This would be deemed a small effect size.

Buying Company Revenue (Company Size)

As organizations grow, they often implement more specialized functions and rules to govern corporate purchases, potentially leading to longer buying cycles. Thus, we hypothesized that larger buyer organizations may experience longer buying cycles while smaller buyer organizations might experience shorter buying cycles. However, this hypothesis was also refuted.

In this case, the correlation coefficient between the size of buyer organizations and buying cycle length did not meaningfully approach statistical reliability. This suggests that the size of a company and the length of time a company takes to execute a corporate purchase are not related. This is especially surprising in light of a related finding that larger companies do tend to execute larger purchases.

Given the interrelationships between these variables, we conducted a further correlation test in which we evaluated the relationship between company size and length of buying cycle, while holding the cost of the solution constant. This test allows us to assess buying cycle lengths as if larger and smaller companies were making comparably sized purchases.

Results from this analysis indicated that when larger companies make purchases comparable to those of smaller companies, they have reliably shorter buying cycles. That difference, however, is not a large one, amounting to a day or two less on a typical 11-month buying cycle.

Competitor Count

The next factor we tested was the number of competitors being evaluated. It stands to reason that when there are more vendors to be evaluated, the evaluation process itself might simply take longer. And indeed, this is what we found.

In fact, the correlation coefficient between buying cycle length and competitor count is nearly double the size of the correlation between purchase cost and buying cycle length.

Interactions with Competitor Organizations

Having found that more competitors being evaluated leads to longer buying cycles, we surmised that this might be because more competitors would make the decision-making process more difficult, which might lead buying team members to need more interactions with each vendor to make a decision. This in turn would lead to longer buying cycles.

The correlation coefficient between the number of competitors evaluated and number of interactions a buying team member has with each vendor strongly indicated that this was true. More competitors leads to more interactions with each of the competitors.

Note:

As the table above shows, there’s a strong positive correlation between how many vendors are included in an evaluation and how many interactions an individual has with each vendor they interact with. This suggests that as additional vendors are added to the list, each member of a buying team requires more information to make their ultimate decision, which results in more interactions with each vendor.

Statistical significance is reliability

Statistical significance is a measure of how reliable survey data is. It tells us how likely it is that the result we found represents the real world. For survey research, the standard for determining statistical significance is that we would expect to find the same result 95% of the time we replicate the survey with a sample drawn from the same population. 6sense Research uses the word "reliable" instead of "significant," because we think it is a more accurate description of this concept. The word “significant” is often taken to mean “important” or “large” in everyday conversation, but there are many cases in which findings that are statistically significant are not meaningful, large, or important.

Buying Team Size

Finally, we hypothesized that larger buying teams would naturally require more collaboration among team members and potentially more time spent in decision-making compared to smaller groups. As anticipated, our analysis revealed an extremely robust correlation between the size of a buying team and the duration of their buying cycle.

This association is partly attributable to the tendency of larger buying teams to engage in more interactions with vendors. However, it is also likely influenced by the strong possibility that bigger groups are also having more interactions within their own team during the decision-making process.

Non-Quantifiable Factors

There are other factors that might be expected to influence buying cycle length, which aren’t quantifiable and therefore cannot be assessed using correlation studies. Some of these factors are highlighted in the table below:

Factor Description Response Options
Industry What industry does your company belong in?
  • Business Services
  • Construction
  • Education
  • Energy/Oil & Gas
  • Financial services
  • Healthcare
  • Information technology
  • Leisure and entertainment
  • Manufacturing
  • Manufacturing
  • Real estate
  • Retail
  • Sales
  • Transportation
  • Utilities
  • Wholesale
Purchase Type What kind of purchase was it?
  • Improve existing capabilities
  • New business capabilities
  • Renew/continue Existing Solution
  • Replace existing capabilities
Solution Type What type of solution was the purchase?
  • Business Services
  • Financial Services
  • Hardware or equipment lease
  • Hardware or equipment purchase
  • Healthcare Services
  • Individual machinery/heavy equipment
  • Other – Please specify
  • Professional Services – Project-based
  • Professional Services – Retainer or contract term
  • Software as a service
  • Software perpetual license
Respondent Department Department of person completing the survey
  • Acct/Purch/Legal
  • Engineering
  • IT
  • Manufacturing
  • Marketing
  • Operations
  • Sales
  • Supply Chain

To test these, we conducted separate analysis of variance tests, entering each factor as an independent variable predicting buying cycle length.

Each of the factors analyzed exhibited a statistically reliable influence on buying cycle length, but only in the case of a company’s funding was that influence2 found to be meaningful. Companies that have private equity backing tended to have substantially longer buying cycles (average  = 16.39 months) than either Private (10.33 months) or Publicly traded companies (11.2 months). Venture capital backed companies (13.7 months) trended lower than private equity funded companies, but that difference was not sufficient to conclude that they are reliably different.

ANOVA (Analysis of Variance)

ANOVA is a tool in statistics that compares the average measures taken from more than two groups (when there are just two groups, a T-test is commonly used, but when there are more, ANOVA is used). For example, in our research, we asked buyers their industry and how many interactions they had during their buying process with sellers. We used ANOVA to determine if buyers in some industries had more or fewer interactions than their peers in other industries. Our analysis found that buyers in the manufacturing industry have reliably fewer interactions (12.8) in their journeys, compared to peers in Professional Services (16.7), Business Services (16.2), Tech (16.9), and Financial Services (16.9). The other industries, however, are not reliably different from one another.

Disentangling the Influences on Buying Cycle Length

To determine which of these factors truly exhibits the most influence on the length of a buying cycle, we conducted a multiple regression analysis with the six quantifiable factors (number of competitors, solution importance, interactions with vendors, buying team size, purchase cost, organization size) and the non-quantifiable factor (company funding type) that was identified as influential to buying cycle length.

Despite there being a wide variety of factors that we did not measure that could be expected to influence the length of a buying cycle, the seven factors in our model accounted for 62.9% of the reason any given buying cycle differs from the overall average of 11 months.

Although all seven factors in our model contributed some predictive power of buying cycle length, their impacts varied.

For instance, company funding type accounted for only 3% of the 62.9% variance in buying cycle length predicted by our model. Here, we observed that privately or publicly funded companies generally had shorter buying cycles compared to PE- and VC-backed firms, all other factors being equal. The impact of company size was also statistically reliable, but had only a small impact on buying cycle length.

As indicated by the negative correlation observed earlier between solution importance and buying cycle length — and when controlling for the other factors in our model — the importance of a solution still tends to decrease the length of the buying cycle. For example, the average importance for purchases in our survey was 3.6 out of 5 (or roughly halfway between Important and Very Important) and had a buying cycle length of 11 months. A solution that was rated one point higher at 4.6 out of 5 would expect to have approximately 20 days shaved off the length of that buying cycle, other factors being equal.

Undoubtedly, the most important factors we measured that drive buying cycle length were once again the number of vendors being evaluated and the price of the purchase. Together, these two factors account for 39.1% out of the 62.9% of the reasons any given buying cycle differs from the overall average of 11 months.

In reality, of course, all of the factors mentioned above are at play at once. And, our correlation studies indicated that not only do some of these factors directly impact the length of a buying cycle, some of these factors also influence each other. For example, the number of competitors being evaluated influences the length of a buying cycle and the number of interactions each buying team member has with each vendor. But, the number of interactions each buying team member has also influences the length of a buying cycle on its own.

To assess this, we focused on the most influential factors identified through our regression analysis (number of vendors considered, purchase cost, interactions with vendors, and buying group size) and conducted a further statistical analysis to gain insights into both the direct and indirect influences of each factor on the buying cycle length.

What we found was clear: The number of vendors under evaluation and the cost of the purchase remain the most influential factors that directly influence the length of the buying cycle. When the number of vendors exceeds the average of four, each additional vendor extends the buying cycle by over two months, and for every additional $100,000 increase in purchase price, just over half a month is added to the cycle.

However, two-thirds of this nearly three-month addition to the buying cycle can be attributed to the effect that competitor count and purchase cost have on two other factors: buying team size and the number of interactions with vendors.

In other words, the impact of vendor count and purchase cost goes beyond their direct influence, as they indirectly lead to more interactions with each vendor and increase the likelihood of adding additional members to the buying team (more vendors and higher costs lead to bigger teams and more interactions). See below.

Direct Indirect (through larger team sizes and increased interactions) Total
Add 1 competitor above average of 4 14 to 15 days (14.67) 51 to 52 days (51.63) 66 to 67 days (66.3) or 2.2 months
Purchase cost increase (in $100,000 units) 5 to 6 days (5.19) 12 to 13 days (12.7) 17 to 18 days (17.9)
Source: 6sense

“Controlling” for

Controlling for a variable means accounting for other factors that might be affecting the relationship you're interested in. For example, let's say you're a marketing manager and you want to know if spending more money on advertising leads to making more money (revenue). But there's a catch: maybe companies that spend a lot on advertising also happen to have better products or services. So, the extra money they make might be because of their good product, not just the advertising. To clear up the confusion, we use statistical techniques to "control for" the product quality. It's like putting blinders on and only looking at the advertising and revenue relationship, ignoring the product quality influence. This way, we can figure out if the advertising money really makes a difference in making more sales without being distracted by other factors.

B2B Buying Journeys: What’s Happening Along the Way

As we have seen, buying cycles last anywhere from a month to multiple years, depending largely on how many vendors are being evaluated (the average number being just over four) and the cost of the solutions in question. We also know that buying teams average approximately 10 members, with the size of the team varying based on the same factors.

Next, we examined what buyers say they are doing throughout their buying journeys, such as:

  • How many interactions are buying teams having?

  • What types of interactions are they having?

  • Which provider resources are they interacting with?

  • What do they think of these interactions and resources?

How Participation Varies By Role (or Doesn’t) In the Buying Process

First, we looked at how many interactions each of the buying team members are having individually and as a team.

As the chart below indicates, all buying team roles have more than 15 interactions with each vendor being evaluated. This number is essentially equivalent across the different buying roles, with only the ultimate decision-maker having reliably fewer interactions than influencers, who have the most. And while this difference was found to be statistically reliable, the difference is trivially small.

Large Buying Teams Across Long Buying Journeys Have a Lot of Interactions with Vendors

When this view is expanded to examine interactions across buying teams, the number of interactions grows faster for larger teams. As buying teams grow, each member of the buying team has more interactions. It is clear from the data that teams are not larger so that they can share more of the burden. Instead, it appears that larger teams engage in more intensive buying processes than smaller teams.

Vendor Interaction Rates by Buying Group Size

Buying group size
< 5 6 to 8 9 to 13 > 13
Interactions per Buying Group per Vendor 90 258 549 1,138
Source: 6sense

Vendor Count and Purchase Cost Drive Interactions Volume

To examine the key drivers of interactions volume between buying and selling teams, we first computed an average number of interactions per buying team (Buying Team Interactions, or BTI) by multiplying each respondent’s reported number of interactions by the reported size of their buying team.

We then entered the number of vendors evaluated and the purchase cost of the solution (recall, these are the key factors that have been seen to drive buying cycle length and buying team size) into a regression model predicting total buying team interactions. (Click here for all statistics concerning interactions with vendors.)

As with our previous models, the number of vendors being evaluated was the primary influence on total buying team interactions. The purchase price of the solution was also a significant factor, but substantially less influential than the number of vendors being evaluated. Together, the two factors predict 42.9% of the reason that one buying team might engage in more interactions with sellers than the average buying team.

What Interactions are Buying Teams Having and What Do They Think of Them?

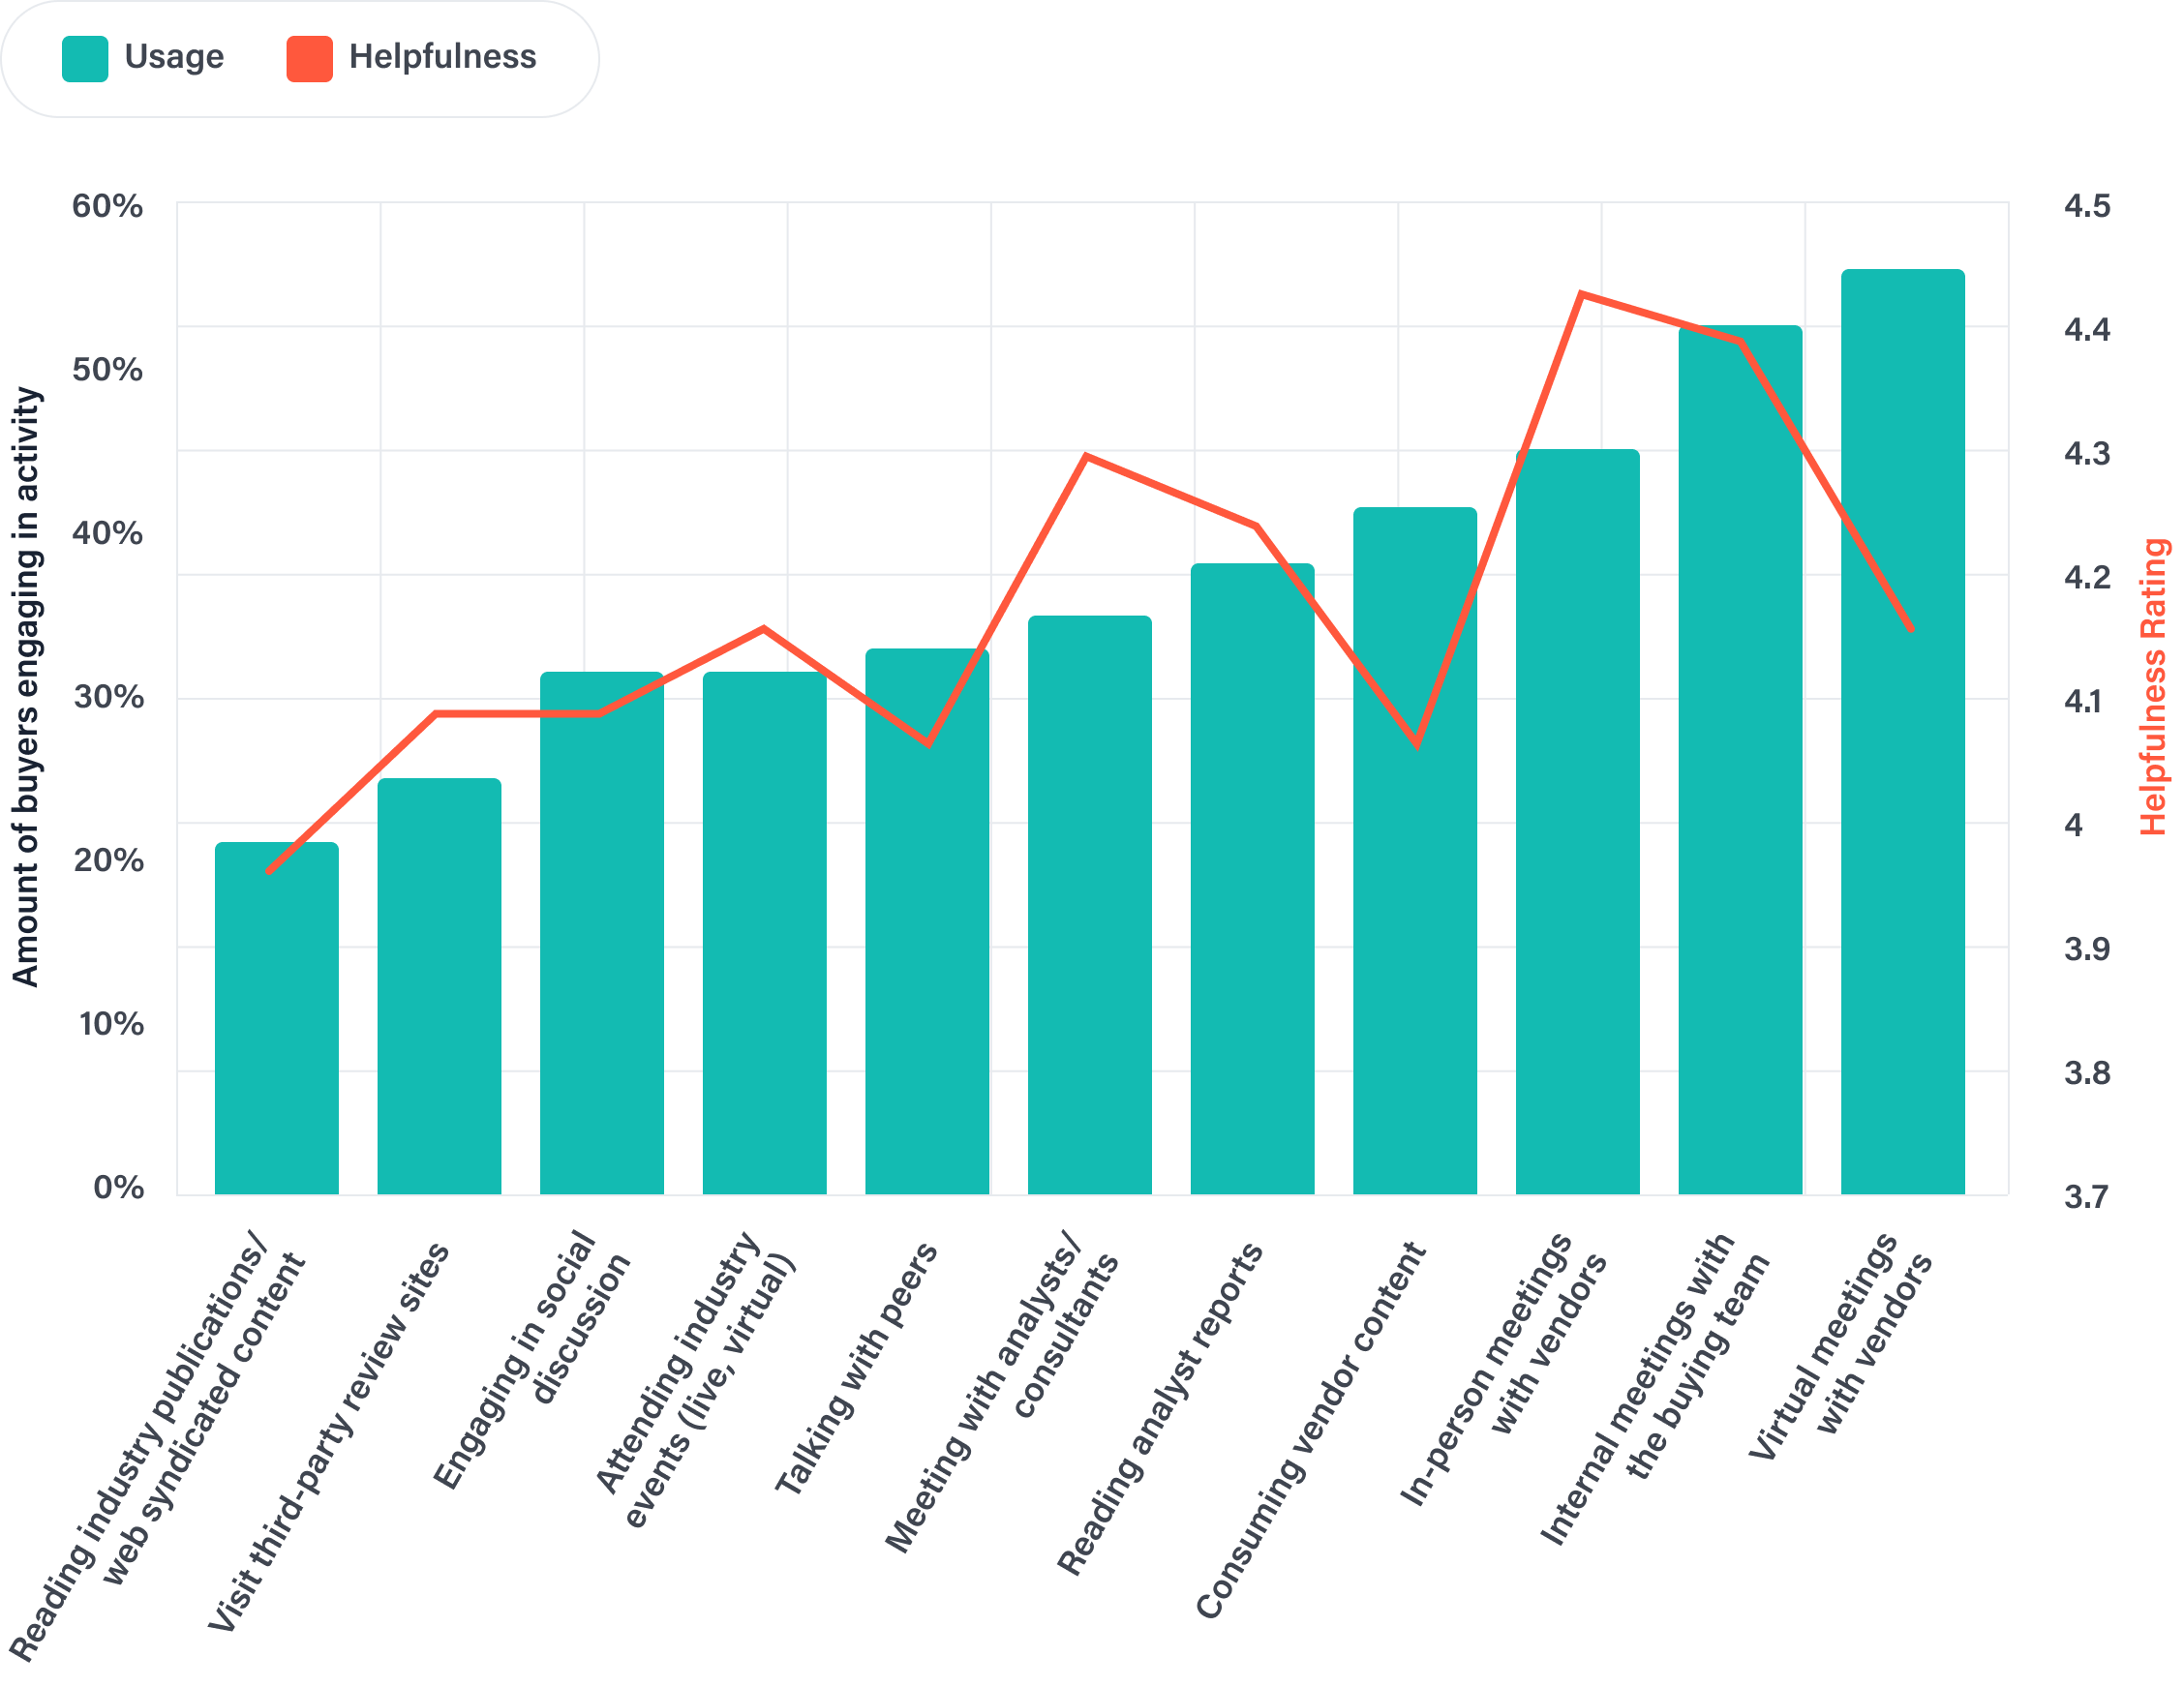
To understand the types of activities buyers are engaging in throughout their purchase experience, we asked them two questions:

  • Which activities did you participate in as a part of the purchase process? (see Chart 1 of 2 below)
  • Which activities did you engage in with the winning vendor? (see Chart 2 of 2 below)

Statistical tests showed that there are differences in how buyers use the different interactions types about which we asked. As the charts illustrate, there are substantial differences in the utilization of the most-used from the least-used interactions types, both in the context of general buying process interactions (Chart 1 of 2) and interactions with the winning vendor (Chart 2 or 2).

It may also be observed that across both sets of activities, the most-used interactions types involve the buyer in person-to-person interactions with either the vendor personnel or internal personnel.

Note:

In the context of the two charts below, where error bars ( divider ) on adjacent factors overlap, those factors are not statistically different from one another.

Across B2B, Buyers Just Do What They Do

Next, we tested whether…
  • Buyer industry
  • Purchase type
  • Company revenue
  • Solution type
  • Solution price
  • The buying team role of the respondent
  • Vendors evaluated
  • …meaningfully influenced which interactions types a buyer used.

While most of these factors did exhibit statistically reliable influence on the interactions types being used, none of these factors made enough of a difference to warrant further consideration. This leads us to conclude that the use of interactions types is not meaningfully influenced by any of the variables we collected. Choice of interactions types may owe more to what is available to buyers and to personal preferences than to any of the factors we measured.

What Interactions Types Do Buyers Like Most?

Next, we asked participants to rate interactions they had engaged in during their journey, on a scale where 1 = Not At All Useful and 5 = Extremely Useful. All interactions we asked about were rated above a 3 (between Moderately Useful and Useful), suggesting that buyers find all the interactions types we presented at least moderately useful.

A statistical analysis of the differences revealed that while some of the differences amount to approximately one point on the 5-point scale we used, the differences do not reach statistical reliability. Participants’ opinions of each of the interactions types varied considerably, with each interactions type having strong proponents and strong detractors. When this occurs, meaningful differences become difficult to detect or predict.

Source: 6sense

Take Me To Your Leader

We also asked participants to tell us how helpful five key selling team roles were. Those roles are given with their helpfulness ratings in the chart below.

Here, the analysis of variance did find statistically reliable differences between several of the roles. (Click here for all statistics concerning support satisfaction) BDR/SDRs were found to be meaningfully less helpful from every other role. Senior leadership and sales engineer/solution consultants scored the highest, but these differences were only meaningfully different from the scores Sales AEs and BDRs received.

Source: 6sense

All’s Well That Ends Well … If It Does

The final part of most B2B buying processes involves the negotiation and completion of a contract. Because it is the last part of the buying process, it can be expected to be influential in determining how buyers enter into this new or continued relationship, and can also be expected to influence how the buying process is remembered.

To examine how contract negotiations impact buyer-seller relationships, we asked participants to tell us whether the contracting process itself made them more or less likely to want to do business with the selling organization in the future. Buyers responded using a 5-point scale from Much Less Likely to do business with the selling organization again (1) to Much More Likely (5).

Here, we found that, in general, buyers found the contracting process to exert a positive influence on future buying with all but one type of respondent — those from Legal departments. The contracting process yielded an overall average of 4.08 on the 5-point scale, meaning the process made buyers more likely to want to do business with that supplier in the future.

To test relations with other factors, we conducted a correlation analysis. (Click here for all statistics concerning the contracting process). In this examination, only a company’s financial performance and the importance of the solution being purchased were related to their view of the contracting process, with better-performing companies and the purchase of more important solutions being reliably associated with more satisfaction with the contracting process.

We also tested a wide variety of other factors, such as a respondent’s industry, funding type, and department, as well as the solution and purchase type.

Of these, only two statistically reliable relationships appeared. Private company responders tended to have a slightly rosier view of the contracting process than others, while Legal department responders took a substantially dimmer view of the process, rating it just 2.8 out of 5 compared to the overall average of 4.08.

Overall Buying Process Rating

Our main interest in examining the contracting process, though, was to understand what kind of impact it might have on the buyer’s overall view of the buying process. We found that a higher rating of the contracting process was associated with a reliably higher rating of the overall buying process, suggesting that as a process that takes place at the end of the purchase, it does have an important role in shaping how buyers think about the overall buying process.

In addition, we found that more important solutions tended to be associated with more satisfying purchasing processes, and that respondents who reported that their companies had performed better financially over the past year also had a rosier view of the buying process.

To test the impact of the contracting process on the overall satisfaction rating, we entered the contracting sentiment variable along with others that we have considered in this research into a multiple regression predicting overall satisfaction with the buying process (Click here for all statistics concerning overall satisfaction with the buying process). The model that resulted accounted for 15.7% of the variability in the overall satisfaction rating. In the model, a buyer organization’s financial performance over the past year was the strongest predictor, accounting for a third of the total variability accounted for by the model. Sentiment concerning the contracting process accounted for nearly as much (31.7%) of the model’s predictive power.

While this model is not as strong as others we have looked at in this research, it is clear that the contracting process can have an important impact on whether buyers are likely to become repeat customers.

Implications

In this research, we found that buyers are 70% through their buying process by the time they engage sellers directly. And when they do engage, they do it at a time of their choosing, reaching out first to the vendor that ultimately wins the business 84% of the time.

What’s more, buyers told us that their requirements were completely or largely established by the time of that first contact. This strongly suggests that if providers have not won buyers over in the first two-thirds of a buying process, they have very little chance (16%) of winning the deal thereafter.

70% 84% 16%
In short, our findings suggest that 84% of deals are won or lost before providers know they exist.
84%

In addition, this research resulted in important discoveries concerning the length of buying cycles. To our surprise, where we expected that purchases that were rated more important to their organizations would result in longer buying processes, we found the opposite. More important purchases were marked by shorter buying processes. This may suggest that buying processes for more business-critical solutions are prioritized and/ or streamlined by buying organizations.

We were also surprised to find that larger buying organizations reported shorter, rather than longer buying cycles. We might speculate that larger organizations have more mature purchasing processes and perhaps more specialized personnel who are able to dedicate more time and attention to evaluating solutions.

There were yet other fascinating findings with respect to the factors that influence the length of buying cycles. The single most important variable predicting the length of a buying cycle is the size of the buying team. Yet, selling organizations are not likely to be able to directly impact the size of a buying team in order to shorten the cycle.

However, selling organizations can influence the size of buying teams and, hence, the length of a buying process indirectly. This is because the size of a buying team is strongly influenced by the number of vendors being evaluated.

Recall that our research found that every vendor added to a buying process above the overall average of four increased the length of a buying process by two months. What is behind this is not immediately clear. However, the number of vendors being evaluated accounts for nearly half of the variability in buying team size. It seems likely that buying teams staff up to meet the demands of conducting multi-vendor evaluations.

We also found that the number of vendors being evaluated increases the number of interactions each member of a buying team has. By driving up the interactions per person and the number of people on the buying team, adding one additional vendor to a buying process increases the total number of buyer-seller interactions by approximately 100 interactions across the course of an average buying cycle.

From all of the above, it becomes clear that selling organizations should exert considerable effort to intervene early in the buyers’ journey, long before the 70% point, not only to influence buyers toward their solutions, but also to eliminate competitors whenever possible, thereby simplifying and shortening the buying process.

Chapter 6

Appendix

Read time: 3,200 words; about 16 minutes

Table 1: Statistical Reporting

Point of First Contact
Finding Statistical Test Statistiс Significance Level Effect Size Sample Size
The average buying cycle is 11 months. Average n/a n/a n/a 934
Buyers typically make direct contact with vendors around 7.586 months into the buying cycle. Average n/a n/a n/a 934
Buyers typically make direct contact with vendors 69% of the way through a buying cycle. ANOVA F=1.496 p=0.189 0.008 934
The point at which buyers first make direct contact with vendors is consistent across industries. ANOVA F=1.660 p=0.071 0.021 934
The point at which buyers first make direct contact with vendors is consistent across solution capabilities. ANOVA F=2.251 p=0.081 0.007 934
The point at which buyers first make direct contact with vendors is consistent across purchase types. ANOVA F=0.856 p=0.574 0.009 934
The point at which buyers first make direct contact with vendors is consistent across solution price points. ANOVA F=0.725 p=0.728 0.009 934
B2B buyers indicate that they initiate contact 83% of the time. Frequency n/a n/a n/a 931
No matter their industry, buyers indicate they initiate contact with sellers. Contingency Tables n/a p=0.015 X2=14.086 931
No matter their department, buyers indicate they initiate contact with sellers. Contingency Tables n/a p=0.04 X2=21.441 931
Irrespective of the type of capability sought (new, replacement, etc.), buyers indicate that they initiate contact with sellers. Contingency Tables n/a p=0.314 X2=3.553 931
Irrespective of the type of purchase (SaaS, hardware, etc.), buyers indicate that they initiate contact with sellers. Contingency Tables n/a p<.001 X2=30.875 931
Irrespective of the cost of the purchase, buyers indicate that they initiate contact with sellers. Contingency Tables n/a p=0.691 0.001 927
77.6% of buyers said their initial requirements remained largely unchanged upon contacting sellers. Frequency n/a n/a n/a 926
84% of buyers state that the initial vendor they contacted emerged as the ultimate winner. Frequency n/a n/a n/a 931
Buying Groups
Finding Statistical Test Statistiс Significance Level Effect Size Sample Size
The average buying team is just under 10 people. Average n/a n/a n/a 934
More vendors under evaluation tend to lead to larger buying teams. Pearson’s r 698 p<.001 863 934
More costly solutions tend to lead to larger buying teams. Pearson’s r 381 p<.001 401 929
Modestly, company size (measured by revenue) positively correlates with buying team size. Pearson’s r 196 p=.017 078 934
Modestly, company size (measured by employee count) positively correlates with buying team size. Pearson’s r 0.078 p<.001 199 934
The importance of the solution sought tends to lead to smaller buying teams. Pearson’s r -0.071 p=0.03 -0.071 934
Company funding type, industry, buyer department, solution type, purchase type, and company modestly predict buying team size (combined, they contribute 2.6% predictability). Regression F=32.707 P<.001 R2=.557 929
The number of vendors evaluated, purchase cost, and solution importance account for 52.8% of the reason one buying team is smaller or larger than the average buying team of about 10 people. Regression F=345.061 P<.001 R2=.528 929
The number of vendors evaluated and solution price alone account for 52.4% of the reason one buying team is smaller or larger than the average buying team of about 10 people. Regression F=509.45 P<.001 R2=.524 929
Every extra $100,000 spent adds roughly half a person to the 10-person average buying team size. Path Analysis 457 P<.001 457 934
For every extra vendor considered beyond the average of four, the buying team size increases by 2 to 3 people from the 10-person average. Path Analysis 2.167 P<.001 2.167 934
Outside Resources
Finding Statistical Test Statistiс Significance Level Effect Size Sample Size
The size of a company (measured by revenue) does not influence whether buyers use consultants, analysts, or both, during purchases. ANOVA F=1.660 p=.191 p<.001 710
The size of a buying group does not influence whether buyers use consultants, analysts, or both, during purchases. ANOVA F=1.601 p=0.202 0.005 710
Those who use both consultants and analysts tend to have a slightly shorter buying cycle than those who use just consultants or just analysts during purchases. ANOVA F=4.060 p=0.018 0.018 710
Those who use consultants, analysts, or both during purchases tend to spend similar amounts of time in the buying cycle before initiating the first contact with vendors. ANOVA F=0.873 p=0.418 0.002 710
Organizations tend to use both consultants and analysts for more important purchases. ANOVA F=3.491 p=0.031 0.010 710
The number of competitors under evaluation does not influence whether buyers use consultants, analysts, or both, during purchases. ANOVA F=0.153 p=0.858 0004 710
The cost of the purchase does not influence whether buyers use consultants, analysts, or both, during purchases. ANOVA F=0.870 p=0.870 0003 709
Buying teams that tend to use outside resources also tend to evaluate more vendors. Welch’s t-test -11.715 p<.001 -0.827 934
Buying teams that tend to use outside resources also tend to purchase more expensive solutions. Welch’s t-test -10.504 p<.001 -0.801 929
Buying teams that tend to use outside resources also tend to have two-times longer buying processes. Welch’s t-test -13.386 p<.001 -0.927 934
The size of an organization (measured by revenue) does not influence whether an organization uses outside resources. Welch’s t-test 1.744 p=0.418 0.138 936
The size of an organization (measured by employee count) does not influence whether an organization uses outside resources. Welch’s t-test -1.169 p=0.031 -0.095 936
The perceived importance of a solution intended to be purchased does not influence whether an organization uses outside resources. Student’s t-test 1.717 p=0.858 0.132 934
Generally, organizations lean towards using external resources, especially for software-as-a-service, but less for machinery/heavy equipment. Contingency Tables n/a p=0.870 X2=142.5 934
Organizations usually utilize external resources, especially when enhancing or acquiring new capabilities, but less so when maintaining existing solutions or replacing capabilities. Contingency Tables n/a p<.001 X2=20.688 934
Organizations typically rely on outside resources, with financial services solutions purchasers being almost four times more likely to utilize external help compared to those making other types of purchases. Contingency Tables n/a p=.08 X2=68.188 936
Vendor count, solution cost, buying cycle length, and solution type forecast instances of organizations not using external resources with 48% accuracy, and predict their utilization of external resources with 94% accuracy, resulting in an 83% overall accuracy rate. Logistic Regression X2=289.47 p=.243 929
Organizations purchasing financial services solutions are nearly four times as likely to use outside resources as those making other types of purchases. Contingency Tables n/a p=0.08 X2=68.188 936
Organizations buying machinery/heavy equipment are substantially less likely to consult with outside resources. Contingency Tables n/a p<.001 X2=142.550 934
Buying Cycle Length
Finding Statistical Test Statistiс Significance Level Effect Size Sample Size
Higher-priced solutions generally result in longer sales cycles. Pearson’s correlations r=.365 p<.001 Fisher’s z=.383 929
More important solutions tend to have shorter, rather than longer, buying cycles. Pearson’s correlations r= -0.134 p<.001 Fisher’s z=-0.134 934
The size of a company and the length of time a company takes to execute a corporate purchase are not related. Pearson’s correlations r=.0008 Fisher’s z=.0008 934
Bigger organizations (measured by employee count) have longer buying cycles. Pearson’s correlations r=.112 p<.001 Fisher’s z=.112 934
As competitors are added to the mix, buying cycles grow. Pearson’s correlations r=.596 p<.001 Fisher’s z=.687 934
As the number of vendors being evaluated increases, the number of interactions a buying team member has with each vendor also increases. Pearson’s correlations r=.647 p<.001 Fisher’s z=.769 934
Bigger teams have longer buying cycles. Pearson’s correlations r=.719 p<.001 Fisher’s z=.905 934
Larger buying teams engage in more interactions with vendors. Pearson’s correlations r=.667 p<.001 Fisher’s z=.806 934
Capability type (new, replacement, etc.) affects buying cycle length, albeit modestly. Acquisitions for new business capabilities have the lengthiest cycle (12.829 months) compared to other types. ANOVA F=6.786 p<.001 n2=0.021 934
Purchase type affects cycle length, with minor impact. Those who selected the purchase category “other” reported the shortest buying cycle (4.3 months), followed by those purchasing individual machinery/heavy equipment (7.3 months). ANOVA F=7.646 p<.001 n2=0.077 934
Buyer industry affects buying cycle length, with minor impact. Those who selected the industry category “other” tend to report shorter average buying cycles (6.8 months) than those in tech (11.64 months), professional (11.43 months), business (11.4 months), and financial services (11.87 months). Those in manufacturing (9.17 months) tend to report shorter buying cycles than those in Tech. ANOVA F=5.042 p<.001 n2=0.026 934
A buyer’s company funding has an impact on buying cycle length but its impact is minimal. Companies that have private-equity backing tended to have substantially longer buying cycles (average = 16.39 months) than either Private (10.33 months) or Publicly traded companies (11.2 months). Venture capital backed companies (13.7 months) trended lower than private-equity funded companies, but that difference was not sufficient to conclude that they are reliably different. ANOVA F=8.788 p<.001 n2=0.028 934
Buyer industry affects buying cycle length, with minor impact. Those who selected the industry category “other” tend to report shorter average buying cycles (6.8 months) than those in tech (11.64 months), professional (11.43 months), business (11.4 months), and financial services (11.87 months). Those in manufacturing (9.17 months) tend to report shorter buying cycles than those in Tech. ANOVA F=5.042 p<.001 n2=0.026 934
The number of vendors evaluated, solution importance, interactions with vendors, buying team size, purchase cost, organization size and company funding type account for 62.9% of the reason any given buying cycle differs from the overall average of 11 months. Regression F=152.02 p<.001 R2=.598 934
Company funding type accounts for only 3% of the reason any given buying cycle differs from the overall average of 11 months. Privately or publicly funded companies generally have shorter buying cycles compared to PE- and VC-backed firms, all other factors being equal. Regression F=8.788 p<.001 R2=0.028 934
The average solution importance was rated 3.6 out of 5 by respondents in our survey (or roughly halfway between Important and Very Important). Average n/a n/a n/a 934
A solution that was rated one point higher (“more important”) than the average at 4.6 out of 5 would expect to have 20 days shaved off the length of that buying cycle. Regression F=152.02 p<.001 R2=.598 934
The number of vendors being evaluated and the price of the purchase account for 39.7% of the reason any given buying cycle differs from the overall average of 11 months. Regression F=305.411 p<.001 R2=.397 934
When the number of vendors exceeds the average of four, each additional vendor extends the buying cycle by over two months (2.21 months). Mediation Analysis z-value =20.181 p<.001 estimate =2.221 934
For every additional $100,000 increase in purchase price, just over half a month is added to the cycle. Mediation Analysis z-value =8.056 p<.001 estimate =.601 934
When the number of vendors exceeds the average of four, each additional vendor extends the buying cycle by 14 to 15 days on its own. Mediation Analysis z-value =3.915 p<.001 estimate =0.489 934
For every additional $100,000 increase in purchase price, 5 to 6 days are added to the buying cycle directly. Mediation Analysis z-value =2.659 p<.001 estimate =0.173 934
Each additional vendor adds 10 to 11 (10.652) interactions per buying team member. Mediation Analysis z-value =19.124 p<.001 estimate=10.652 934
Each vendor interactions adds nearly two days (1.74) to the buying cycle. Mediation Analysis z-value =9.933 p<.001 estimate=0.058 934
Removing the influence of purchase cost, there is a modest inverse relationship between company size and buying cycle length wherein larger companies have slightly shorter buying cycles. Pearson’s correlation r=-.08 p=.014 -.08 934
Interactions/What Happens Along the Way
Finding Statistical Test Statistiс Significance Level Effect Size Sample Size
All buying team roles have more than 15 (15.7) interactions with each vendor being evaluated. Average n/a n/a n/a 934
Decision-makers interact less with vendors than influencers do (who interact the most) but, this statistically reliable difference is minor. ANOVA F=7.316 p<.001 n2=.031 934
As buying teams grow, each member of the buying team has more interactions with vendors. Pearson’s correlation r=.667 p<.001 Fisher’s z=.806 934
The number of vendors evaluated and the purchase cost of the solution predict 42.9% of the reason that one buying team might engage in more interactions with sellers than the average buying team. Regression F=347.497 p<.001 R2=.429 934
Statistical tests show that there are differences in how buyers utilize different interactions types. There is a substantial difference in the utilization of the most-used from the least-used interactions types. It may also be observed that the four most-used interactions types involve the buyer in person-to-person interactions with either the vendor personnel or internal personnel. Repeated Measures anova F=58.2 p<.001 n2=0.052 940
A buyer’s industry has a statistically reliable, but small influence on the types of interactions buyers engage with during the purchase process. Repeated Measures anova F=48.89 p<.001 n2=0.010 936
A buyer’s company size (measured by revenue) has a statistically reliable, but small influence on the types of interactions buyers engage with during the purchase process. Repeated Measures anova F=1.15 p<.0011 n2=0.028 936
A seller’s solution price has a statistically reliable, but small influence on the types of interactions buyers engage with during the purchase process. Repeated Measures anova F=2.18 p<.001 n2=0.022 936
The number of vendors evaluated has a statistically reliable, but small influence on the types of interactions buyers engage with during the purchase process. Repeated Measures anova F=1.47 p<.001 n2=0.012 936
The type of purchase under evaluation has a statistically reliable, but small influence on the types of interactions buyers engage with during the purchase process. Repeated Measures anova F=14.80 p<.001 n2=0.016 936
The type of solution capability has a statistically reliable, but small influence on the types of interactions buyers engage with during the purchase process. Repeated Measures anova F=1.96 p<.001 n2=0.005 936
A buyer’s role in a purchase doesn’t have an influence on the types of interactions buyers engage with during the purchase process. Repeated Measures anova F=1.25 p=0.066 n2=.005 936
There are no statistically reliable differences in the sentiment buyers report for the various types of vendor interactions they have. Repeated Measures anova F=1.96 p=.066 n2=0.169 110
BDR/SDRs are rated as less helpful than every other role. Senior leadership roles and sales engineer/solution consultants are scored highest, but are only statistically different from Sales AEs and BDRs. Repeated Measures anova F=22.113 p<.001 n2=0.026 934
38.4% of buyers set their requirements before contacting sellers. Frequency N/a N/a N/a 927
39.3% of buyers say that the requirements for their purchase only changed slightly upon contacting sellers. Frequency N/a N/a N/a 927
18.4% of buyers say that the requirements for their purchase changed moderately upon contacting sellers. Frequency N/a N/a N/a 927
Only 4% of buyers say that the requirements for their purchase changed substantially upon contacting sellers. Frequency N/a N/a N/a 927
The Contracting Process and Satisfaction with the Overall Buying Journey
Finding Statistical Test Statistiс Significance Level Effect Size Sample Size
A statistically reliable correlation exists between company financial performance and buyer satisfaction with the contracting process. Pearson’s correlation r=.177 p<.001 Fisher’s z=.179 926
There’s a statistically reliable correlation between position level and a buyer’s satisfaction of the contracting process. Pearson’s correlation r=.097 p=.003 Fisher’s z=.097 926
There’s a statistically reliable correlation between the importance of a solution and the buyer’s satisfaction of the contracting process. Pearson’s correlation r=.315 p<.001 Fisher’s z=.326 926
There is no statistically reliable correlation between the length of the buying cycle and buyers satisfaction with the contracting process. Pearson’s correlation r=.008 p=.818 Fisher’s z=.008 926
There is no statistically reliable correlation between the size of the buying group and buyers satisfaction with the contracting process. Pearson’s correlation r=.02 p=.494 Fisher’s z=.02 926
Buyers' industry does not have a meaningful impact on how they view the contracting process. ANOVA F=1.881 p=.095 n2=0.010 926
Company funding has a meaningful impact on how the contracting process is viewed. Private company responders tend to have a slightly rosier view of the contracting process than others. ANOVA F=.6052 p<.001 n2=0.019 926
Respondent’s department has a meaningful impact on how they view the contracting process. Legal department responders take a substantially dimmer view of the process, rating it just 2.8 out of 5 compared to the overall average of 4.08. ANOVA F=2.672 p=.002 n2=0.034 926
The type of purchase does not have a meaningful impact on how buyers view the contracting process. ANOVA F=1.663 p=.085 n2=0.018 926
The average satisfaction rating for the overall buying process was 4.08 out of a possible 5. ANOVA n/a n/a n/a 926
A solution’s capability type does not have a meaningful impact on how buyers view the contracting process. ANOVA F=1.009 p=0.388 n2=.003 926
A higher rating of the contracting process is associated with a reliably higher rating of the overall buying process, suggesting that as a process that takes place at the end of the purchase, it does have an important role in shaping how buyers think about the overall buying process. Pearson’s correlation r=.297 p<.001 Fisher’s z=.306 926
More important solutions tend to be associated with more satisfying purchasing processes. Pearson’s correlation r=.209 p<.001 Fisher’s z=.212 932
Respondents who report that their companies had performed better financially over the past year also have a rosier view of the buying process. Pearson’s correlation r=.272 p<.001 Fisher’s z=.279 932
A multiple regression analysis to predict the overall satisfaction with the buying process accounted for 15.7% of the variability in the overall satisfaction rating. Notably, within this model, the financial performance of the buyer organization in the preceding year emerged as the most influential predictor, responsible for one-third of the total variability explained by the model. Regression F=28.499 p<.001 R2=.157 934

Table 2: Survey Participants

Business Services Financial Services Manufacturing Other Professional Services Technology & Software Total
Accounting / Purchasing / Legal 77 65 53 12 68 69 344
Engineering 1 0 1 1 4 4 11
IT 18 21 18 13 26 137 233
Manufacturing 8 2 20 2 5 5 42
Marketing 32 4 25 1 16 22 100
Operations 17 5 13 14 21 11 81
Sales 38 19 9 5 26 13 110
Supply Chain 2 1 2 4 4 2 15
Total 193 117 141 52 170 263 936
Individual Contributor Manager Director VP SVP/EVP C-level Total
Accounting / Purchasing / Legal 3 89 115 46 21 70 274
Engineering 0 4 1 2 2 2 9
IT 5 43 42 18 15 110 123
Manufacturing 1 16 6 1 3 15 27
Marketing 0 20 17 33 21 9 91
Operations 4 24 13 7 5 28 53
Sales 3 38 24 10 7 28 82
Supply Chain 1 6 5 0 0 3 12
Total 17 240 223 117 74 265 936