More
Template is not defined.

2024 European B2B Buyer Experience Report  

The most important parameters of the B2B buying process in Europe are confirmed to be more like the rest of the world than they are different.

Share
Screenshot 2024-10-02 at 2.03.06 PM

Chapters

Chapter 1

Summaries

Chapter 2

Introduction

Chapter 3

Findings

Chapter 4

Implications

Chapter 5

Appendix

Table of Contents

Chapter 1

Summaries

Chapter 2

Introduction

B2B revenue teams — comprising marketing, sales, and customer success — are designed for a world in which buyers depend on sellers for crucial information when selecting vendor partners. That world has long since disappeared (see, Gartner B2B Buying Process).  

Yet many B2B organizations still treat buyers as if they are starting from a blank or nearly blank slate when buyers and sellers first engage as if buyers are completely unfamiliar with vendors at the outset.

This outdated perspective is rooted in a time before the internet, when buyers depended almost entirely on vendor personnel for information — a norm just 25 years ago, still within the careers of many B2B leaders.

The reality of modern B2B buying is markedly different. Consistent with earlier findings from a variety of sources (SiriusDecisions), our 2023 Buyer Experience report shows that initial buyer-seller dialogues consistently occur two-thirds of the way through the buying journey, by which time buyers have largely decided on their preferred vendor.  

This year’s study echoes last year’s findings across Europe on all key dimensions: during the first two-thirds of their journey, the typical B2B buying group gains consensus on and ranks a shortlist. Only after this is accomplished do they begin contacting vendors — starting with their top choice. Once these interactions begin, buyers rarely change their minds. 

This new understanding requires a radical rethinking of B2B marketing and sales strategies. 

Consider this: If we believe that buyer decision-making starts only after buyers and sellers begin interacting, marketing can justifiably be seen as the junior partner in revenue production, primarily focused on generating those initial conversations. Marketing tactics in this view are nothing more than enticements to that first seller conversation. 

This outdated view is evident in how sales and marketing budgets are handled during market downturns. Companies often slash marketing budgets, expecting sellers to compensate by working harder to initiate conversations, sometimes even increasing sales headcount at the expense of marketing. 

However, we now know that by the time sellers speak with buyers, those buyers have already chosen a favorite, and that favorite will win the deal more than 80% of the time 

So, does cutting marketing budgets to fund more sellers still seem like a wise strategy? 

Instead of cutting marketing budgets in response to an impending downturn, B2B organizations should amplify both brand and demand investments to maximize revenue from in-flight (and soon-to-be in-flight) buying processes that will drive future quarters. Additional selling resources may be necessary to capture this maturing pipeline, but this should be viewed as expanding capacity to boost revenue production, not merely to prevent shortfalls. 

There is much to learn from this report, and we hope it helps B2B organizations better serve buyers, improve how and when they engage prospects, and increase the velocity and volume of deals closed. 

Chapter 3

Findings

Understanding European Buyers

Types of Purchases

The buyers in our survey reported that they purchased hardware/machinery, services, and software in similar proportions, with a slightly greater number purchasing software. Most European buyers we surveyed made their purchase to enhance existing capabilities (63%). This was followed by those seeking new business capabilities (18.5%), those replacing existing capabilities (11%), and those renewing or continuing an existing solution (7.6%).  

Type of Solution
Percent of Buyers
Average Cost
Hardware/Machinery
30.5%
$100,001 to $200,000
Services
29.6%
$200,001 to $400,000
Software
39.8%
$200,001 to $300,000
Region
Hardware/Machinery
Services
Software
Belgium
24.6%
26.2%
49.2%
Germany
36.1%
19.4%
44.4%
Ireland
29.2%
31.3%
39.6%
Netherlands
44.1%
27.5%
28.4%
United Kingdom
25.5%
34.2%
40.3%

Prior Vendor Experience

Buyers in Ireland and the UK are statistically more likely than others to have no prior experience with the vendors they evaluate. These differences are statistically reliable.

Across Europe, 90.5% of buyers had prior experience with at least one vendor they evaluated, and 77% said their prior experience included the winning vendor. In 45% of cases, they had only worked with the winning vendor, while 33% had experience with both the winning and non-winning vendors. Just 9.3% of European buyers had no prior experience with any of the vendors they evaluated. 

The chart above shows the percentage of buyers in different European regions who had experience with the vendors they considered. In Ireland and the UK, slightly more buyers lacked prior experience, but this remained uncommon, occurring in just 10.9% to 18.4% of buying cycles.  

Multi-regional Buyers

This year, we asked buyers where they were located during their purchase and where their company headquarters are. Across all regions in our global study, buying processes involving individuals who are in different regions from their parent companies (multi-regional buyers) tend to make larger, more complex purchases in which they evaluate more vendors, and have longer buying cycles with more interactions with each vendor. In Europe, buyers in Ireland were more likely to be involved in multi-regional purchases than those in other countries.  

In the chart above, buyers in Ireland are statistically more likely to be a part of multi-regional buying teams than their peers in other countries.

The Length of Buying Cycles

Across Europe, the average buying cycle was 10 months from the time research began until the time a provider was selected. Shown in the chart below, buyers in Belgium and the UK have longer cycles than buyers in the Netherlands. 

Our global data, detailed later in this report, show that the number of vendors buyers evaluate both directly and indirectly impact the length of the buying cycle. Evaluating more vendors prompts organizations to expand their buying groups and increases the number of interactions each member has with vendors. As we’ll see, buyers in Belgium tend to evaluate more vendors than those in the Netherlands, leading to larger buying groups and longer cycles. 

Buyers in Belgium and the UK have statistically longer cycles than buyers in the Netherlands.

The Point of First Contact Constant

As we saw last year and confirmed in this year’s global study, B2B buyers don’t engage sellers until they are well into their purchase journey. Evidence from a variety of sources over the years has shown that buyers spend approximately two-thirds of their buying journeys researching solutions digitally (SiriusDecisions). Last year, our research found that North American buyers reported engaging sellers at 68.3% of the way through their journey. That finding was confirmed this year across North America, APAC, and Europe. In Europe, the point of first contact (POFC) occurred at 67.7% of the way through the purchase journey 

The average point of first contact we found in our European sample is slightly earlier than the global figure, but that difference is not statistically reliable. The point of first contact is statistically the same across countries within Europe. Dutch buyers trended toward later engagement, much like buyers in APAC. However, that difference is not statistically reliable. Buyers reach out to sellers more than two-thirds of the way through their purchase journey, and this pattern is consistent across the countries sampled in Europe.

The differences in the chart above are not statistically reliable.

In B2B, Buyers Make the First Move

We also asked buyers to indicate whether they initiated first contact with sellers, or if instead the initiative was taken by the seller. Both in our North American data last year and again in our global data this year, we found that buyers initiate contact with sellers over 80% of the time.  

As shown in the chart below, there are some interesting variations within Europe. Buyers in Belgium and the UK are slightly more responsive to seller outreach compared to the typical European buyer.  

In the chart above, buyers in Belgium and the UK are statistically more responsive to seller contact compared to the average buyer. All European countries we measured are within the margin of error of the global average, or higher.

While buyers may receive outreach from sellers long prior to the 70% point, the findings above clearly highlight that they still tightly control the point of first contact, choosing when and how to engage with sellers. When a buyer engages, it is because they’ve decided the time is right for them to take the next step. 

Buyers Settle on Their Purchase Requirements Before Contacting Sellers

Both this year’s and last year’s data show that buyers not only control the timing of their initial contact with sellers but also largely decide on their purchasing requirements before making that contact. In this year’s global data, buyers had their requirements fully or mostly defined before engaging with sellers between 82% and 88% of the time. European buyers came in at the high end of that range at 88% across the region. 

Within Europe, buyers completely or mostly establish their purchase requirements between 87% and 92% of the time.  

In the chart above, buyers in the UK are statistically more likely than the average European buyer to have their purchase requirements change moderately or substantially after connecting with sellers.

Buyers Pick a Winner Before Talking to Sellers

In our survey, we asked buyers if their first interaction with a provider was with the ultimate winner or another vendor. Perhaps the most startling finding from our 2023 Buyer Experience Research was that buyers had their first conversations with the ultimate winner 84% of the time. This finding was validated again this year in APAC and North America. European buyers reported picking a winner in advance 78.5% of the time.   

Europe’s overall average of 78.5% is marginally lower than both North America (84.6%) and APAC (82.3%). This is largely because buyers in Ireland and Belgium are somewhat less likely than buyers in other countries to pick a favorite vendor prior to talking to sellers. In Ireland, for instance, buyers engaged the winning vendor first only 61.6% of the time. Excluding Ireland and Belgium, the average across other European countries was 82.2%. While lower than other regions, the narrative remains the same: most buyers choose a winner before engaging with sellers.  

In the chart above, buyers in Belgium and Ireland are statistically less likely than those in other countries to purchase from the vendor at the top of their shortlist at first contact. However, they are still likely to have a preferred vendor before engaging directly.
There are two ways that the typical buyer making first contact with the ultimate winner can be interpreted:

Interpretation 1: Buying teams move through more than 67.7% of their buying journey (average: 8 months) without forming a consensus on a favored vendor. By this time, they have completely or mostly established their requirements 88% of the time but have not identified a preferred vendor. At this point, they decide to reach out to vendors, beginning with a random vendor from their list. That first conversation is so compelling that they buy from that vendor 78.5% of the time.  

We do not find this a compelling explanation.

Interpretation 2: Buyers devote more than 67.7% of their buying journey to identifying a short-list and a favored vendor. By this time, they also completely or mostly establish their requirements. Only then do they reach out to vendors to confirm that choice, starting with the preferred vendor. They end up buying from the initially preferred vendor 78.5% of the time. 

The most likely explanation is clearly that buying groups have already established their requirements and chosen a favorite in the race for their business prior to talking to sellers. 

How Long Is the Short List?

Across Europe, the average shortlist is made up of four vendors. Within Europe, buyers in Belgium tend to evaluate one more vendor (4.6) than buyers in the Netherlands (3.5) do. This trend is statistically reliable 

While this may seem minor, our research shows that the number of vendors being evaluated has a substantial impact on the size of buying groups and the length of buying cycles. More vendors mean larger groups and longer cycles. Evaluating just one extra vendor adds two people to a buying group and extends the cycle by two months. 

Buying Groups in Europe

One of the most important developments in the field of B2B revenue generation over the past decade is the recognition that, for all but the smallest purchases, the buyer isn’t an individual but a group—each member playing a distinct role in the buying process.  

Globally, buying groups comprise 10 to 13 individuals depending on the region.

Europe
North America
APAC
Buying Group Size
9.5 people
10.6 people
12.8 people

In Europe, buying groups range from just under eight to over 11 people, though most of the differences shown in the chart below are not statistically reliable. Buying groups in the Netherlands are reliably smaller than those in Belgium and Ireland. 

As we have noted earlier, when buying groups have more vendors to evaluate, they often add more people to the buying group to help share the workload. As mentioned previously, buyers in Belgium tend to evaluate one more vendor than their peers, and accordingly, their buying teams tend to be on the larger side.  

In the chart above, buying groups in the Netherlands are reliably smaller than those in Belgium and Ireland.

More on Buying Cycle Length

As mentioned earlier in this report, buying cycle length across European markets vary. Buyers reported average buying cycles ranging from 8 months to 11.5 months in duration. Buyers in Belgium and the UK have statistically longer cycles than buyers in the Netherlands.  

Buyers in Belgium and the UK have statistically longer cycles than buyers in the Netherlands.

As detailed in our global report, there are a handful of factors that largely determine how long buying cycles will be. Those are:  

  •  Buying group size
  • The number of vendors buyers evaluate 
  • The number of interactions buyers have with vendors
  • Purchase cost
  • The importance of the solution being purchase 

The Influence of Buying Group Size

By far the most important of these factors is buying group size.  

Buying group sizes observed in our European data are consistent with what our global results predict. Buying groups in Belgium, for instance, are slightly larger than average and have correspondingly longer buying cycles compared to other European countries.  

The Influence of Vendor Count

The most important influence on the length of the buying cycle is the number of vendors a team evaluates. As buying groups consider more vendors, they add members to the team, which slows the process and extends the cycle. 

In our research last year and again in our global research this year, we found that adding just one vendor to the typical shortlist of four extends the buying cycle by over two months. A statistical mediation analysis showed that this increase comes via a direct and an indirect effect.  

First, there is a simple direct effect, in that increasing the size of the decision-making group simply slows the pace at which it works. Second, adding members to the buying group causes each member of the group to consume more information from vendors, as they research to develop and support their preferences. More content consumption simply takes more time and stretches out the cycle.  

As we have seen earlier, buyers in Belgium tend to evaluate more vendors than buyers in other countries. Their buying cycles are commensurately longer.

The Influence of Purchase Cost

Purchase cost has less influence on the buying cycle than group size or vendor count but still has both direct and indirect effects. For every $100,000 increase in deal value, the buying cycle extends by nearly 13 days—both because larger deals tend to involve bigger buying groups and because each group member consumes more content on the way to deciding.

In Belgium, typical deal sizes are close to the European average of $200,001 to $300,000, suggesting that longer buying cycles there are driven by evaluating more vendors and using larger buying groups, not by deal size. 

None of the differences in solution cost shown above are statistically reliable. 

Understanding Buyer-Seller Interactions

How many interactions do buying group members have and what drives the volume?

In the following discussion, the term ‘interaction’ is used to indicate both content consumption and human interactions.  

The key driver of how many interactions a buying group member has is the number of vendors a buying group evaluates. The number of vendors buyers evaluate influences the number of interactions each buying group member has through two channels, one direct and one indirect.

Direct influence: Simply evaluating more vendors requires buyers to apply extra scrutiny to each vendor they assess. 

Indirect influence: When buyers add more vendors, they also add members to the buying group. Larger groups generate more interactions, regardless of the number of vendors considered. In fact, over half of the increase in interactions comes from this expansion of the buying team.  

It may be that when more members are added to the buying group, more points of view are considered, more questions are asked, and more ideas are debated. As a result, each member of the buying group must do more homework during the process.  

So, when a company evaluates an additional vendor, it not only results in more meetings and communications with vendors but also makes coming to consensus as a buying group more complex.

When we examine the number of interactions buyers have with sellers across Europe, buyers in Ireland and Belgium are among the countries with the highest interaction volumes, while buyers in the Netherlands tend to have fewer. As mentioned earlier in the report, Dutch buyers typically evaluate one fewer vendor than their counterparts in Ireland and Belgium. 

While these differences do not reach statistical reliability, due to limited sample sizes (between 61 and 304 in each country), the trends align with global patterns: evaluating more vendors leads to more interactions throughout the buying cycle.  

None of the differences shown in the chart above are statistically reliable. The vertical bars represent the expected range of interactions in each region.

Surprisingly, a person’s role in the buying process (Champion, Ultimate Decision Maker, etc.) does not reliably influence how many interactions they have with vendor content and personnel. All buying group members do a substantial amount of their own homework 

In the chart above, buying group roles do not consistently influence how many interactions an individual has over the course of their buying journey.
In the chart above, one’s level in the organization does not consistently influence how many interactions an individual has over the course of their buying journey.

What types of interactions are buyers having with sellers?

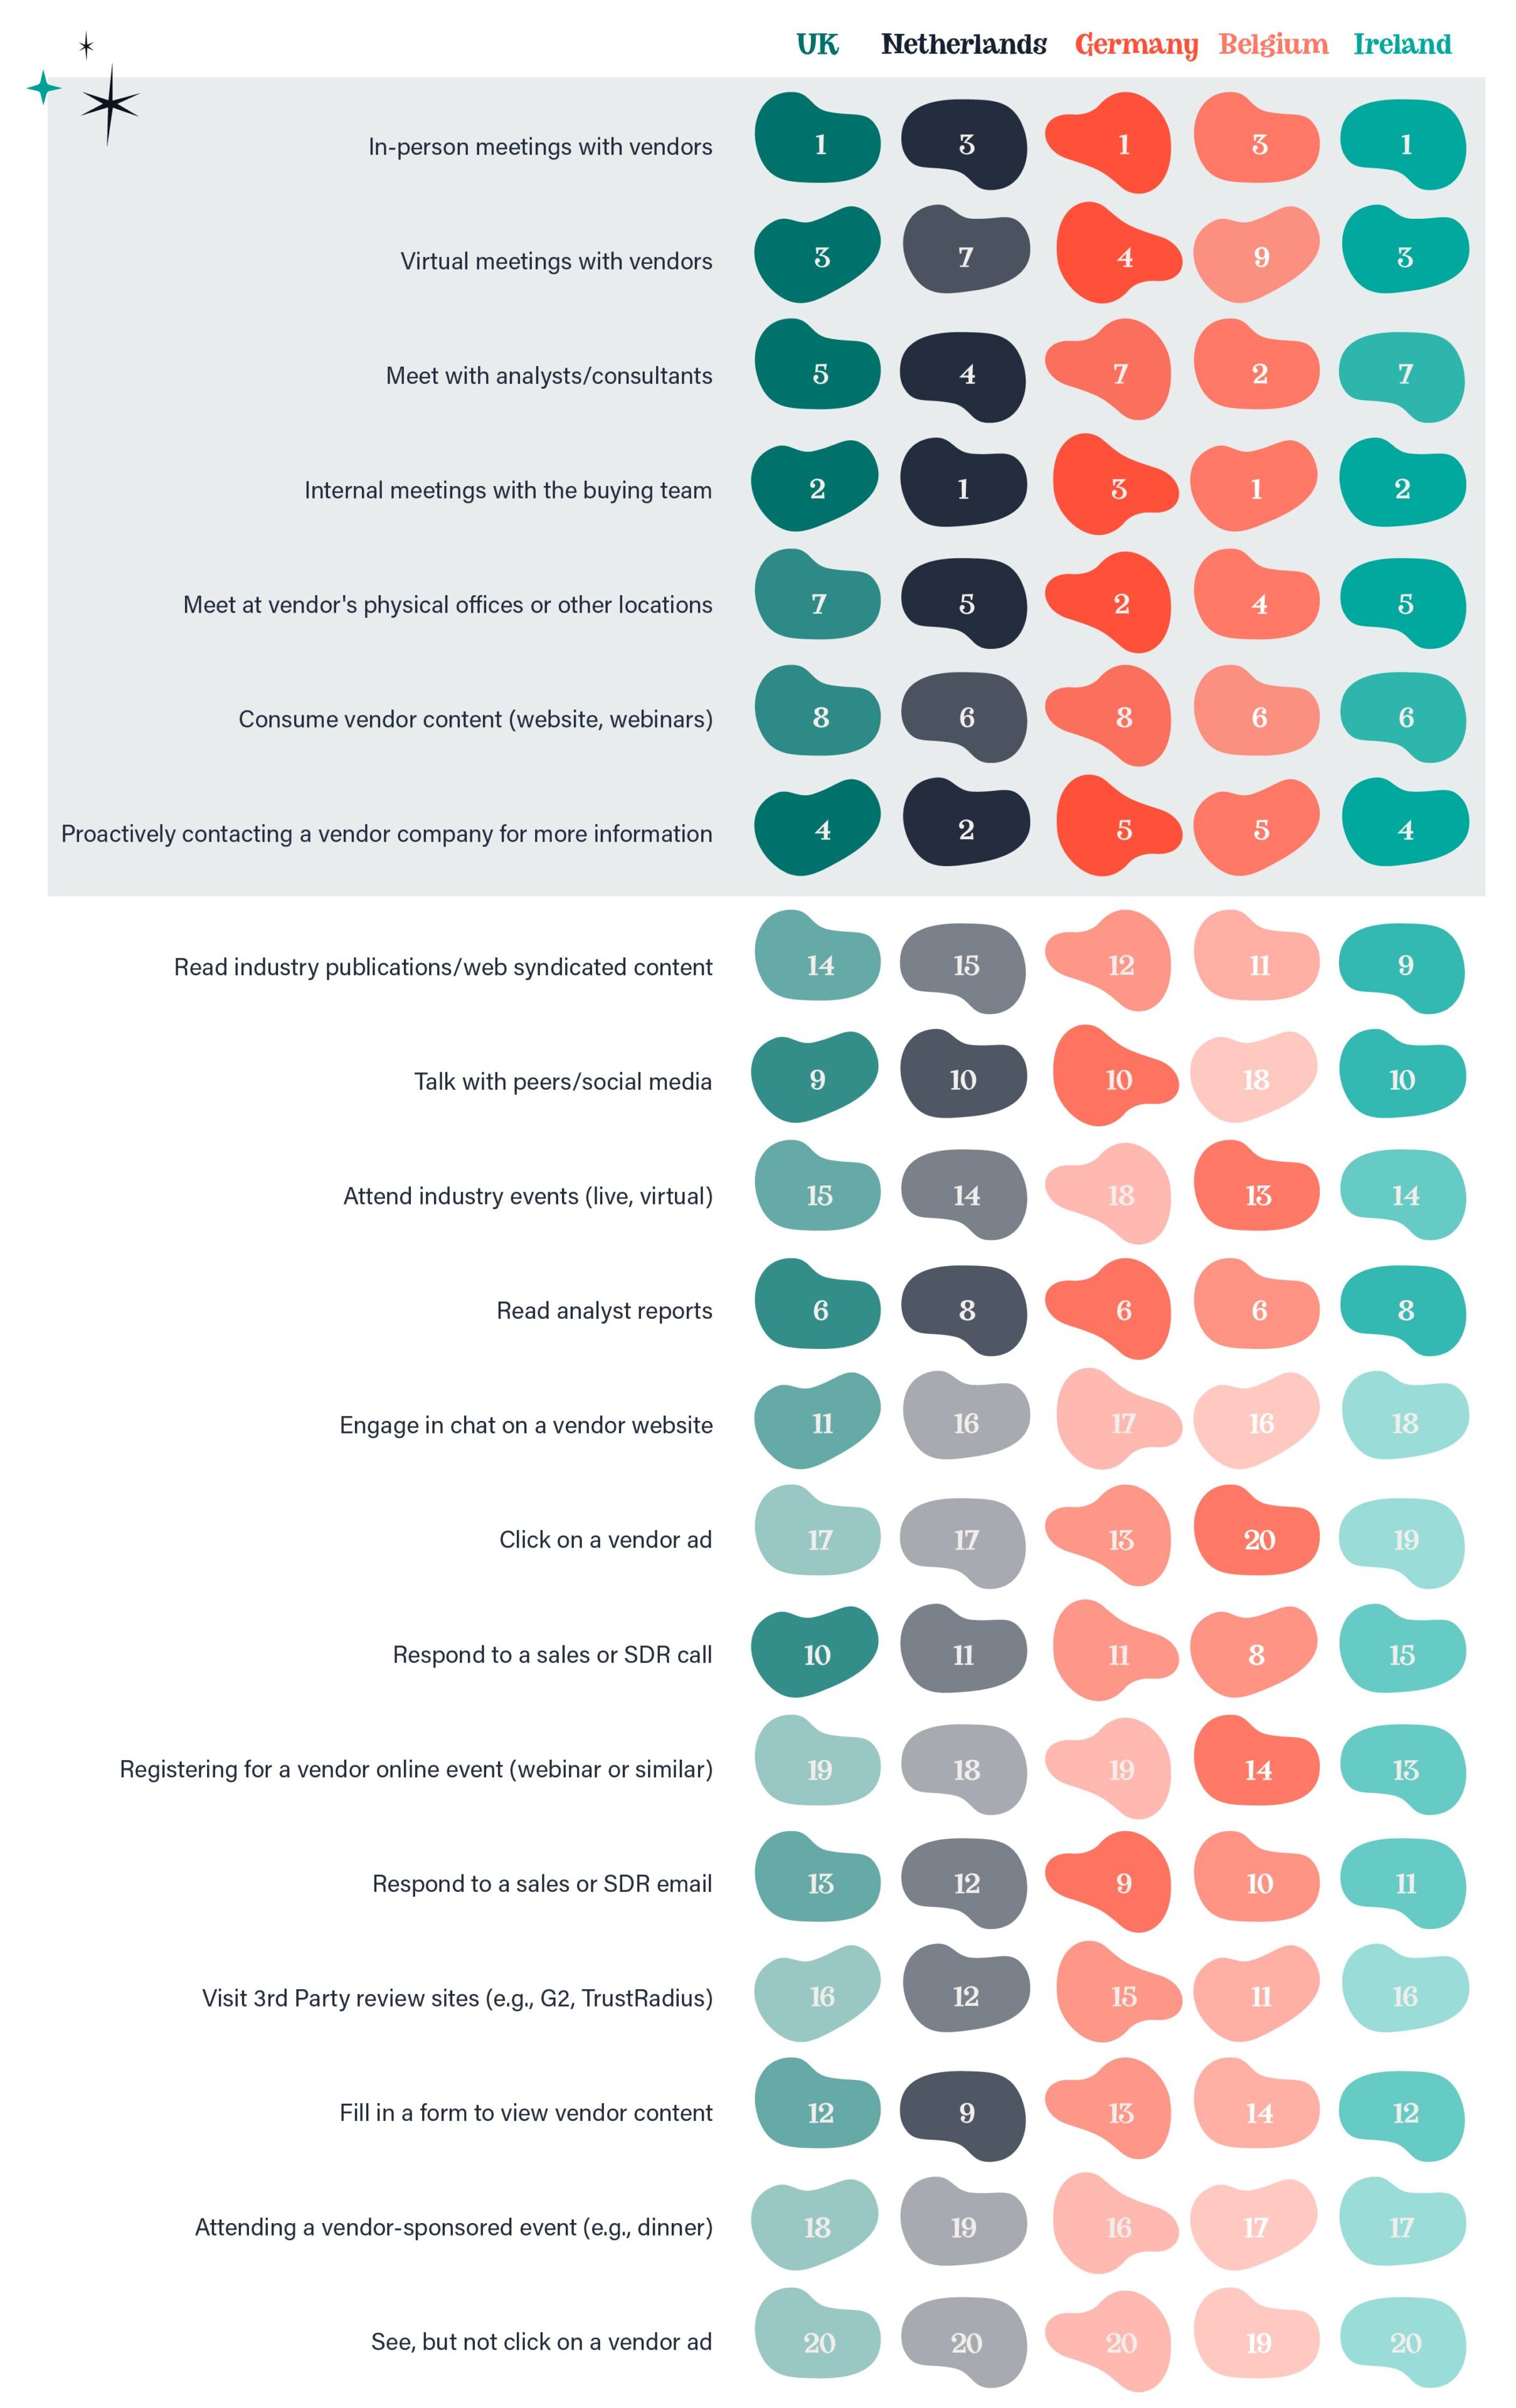
We evaluated buyer engagement with provider resources along two dimensions. First, we asked which interaction types buying group members used to advance their decision-making, creating a utilization score. Second, we asked how helpful they found each interaction, generating a helpfulness score. 

In Europe, each activity we asked about was utilized by between 55% and 92% of buyers per region – a relatively narrow range of difference. Buyers’ helpfulness ratings (on a scale from 1 to 5, where 5 indicates the highest level of helpfulness) ranged from 2.7 to 4.2, indicating that all activities are viewed as at least somewhat helpful. 

To obtain a comprehensive score that reflects both the percentage of buyers engaging in each buying activity and its respective helpfulness rating, we created a weighted score for each activity. This score is calculated by multiplying the percentage of buyers who engage in the activity by its helpfulness rating. This method ensures that both buyers’ behavior and their preferences are accounted for.  

We then ranked these weighted scores with 1 representing the most highly rated and used resource. However, as with the utilization rankings and the helpfulness rankings, all activities scored within a very narrow range, with the most and least popular differing by just over 1 point. Thus, the difference between an activity ranked 1 and one ranked 2, for example, is negligible. See our report dedicated to buyer activities and purchase drivers here

Instead of focusing on the differences in individual rankings, a group of “top” activities emerged. These activities consistently ranked in the top 10 across each sampled region within Europe. A common theme among these top activities is their focus on person-to-person interactions and meetings, including: 

  • In-person meetings with vendors
  • Virtual meetings with vendors 
  • Meetings with analysts and/or consultants 
  • Internal meetings with the buying team 
  • Meetings at vendors’ physical offices or other locations 
  • Consuming vendor content (webinars, website) 
  • Proactively contacting vendors for more information 

Beyond these top activities, there are fewer clear patterns in buyer preferences, suggesting that buyers engage in a wide range of activities and generally find them helpful. This highlights the need for providers to offer diverse resources, as no single activity, except for collaborative engagements or meetings, stands out as significantly more favored or helpful than others. 

Buyers Favor the Ultimate Winner Throughout the Cycle

We also asked buyers whether they engaged in each activity with the winning vendor, losing vendors, or both. The data show that buyers engage with a wider variety of touch points with the vendor they ultimately choose. 

Buyers reported using 50.5% to 63.8% of the available interaction types with the winning vendor, compared to just 16.9% to 39.2% with losing vendors. 

This pattern reinforces our earlier conclusion: buyers identify a preferred vendor early in the journey, and much of the process is spent validating that choice rather than critically evaluating alternatives.  

Phone-A-Friend for B2B Buyers: Buyers Work with Analysts and Consultants

As we have seen, B2B buying groups are large. But they are not the only influences on what an organization buys. Organizations frequently rely on trusted advisors — consultants and industry analysts — for input during their buying process. Across Europe, 64% of buyers reported working with either consultants or analysts during their purchase process. 

As detailed in our global report, buying teams that use outside resources tend to: 

  • Evaluate more vendors (5.1 vs. 3.2 for those without outside help) 
  • Have longer buying cycles (13.5 months vs. 6.4 months) 
  • Purchase more costly solutions ($300,001 to $400,000 vs. $100,000 to $200,000) 
  • Have larger having groups (12.8 people vs. 6.3 people) 

These four factors — Vendor Count, Cycle Length, Solution Cost, and Buying Group Size — form a complex web of influences we call the Purchase Complexity Scale — a variable which combines the scores on each factor. Each factor affects and is affected by the others, though vendor count and solution cost are the primary drivers of journey complexity.

For example, in last year’s study, we found that vendor count and solution cost tended to be highly correlated with each other, while also driving the number of interactions and the size of buying groups. The figure below illustrates these relationships.  

Impact of Key Roles on the Buying Journey

This year, we asked respondents if various stakeholders were involved in their internal buying committees. In our Global Report, C-Suite involvement tended to simplify the buying process across Europe, while Legal and Procurement had minimal impact. In contrast, IT involvement was linked to more complex purchases, longer buying cycles, and larger buying groups. 

Within Europe, we observed that the Netherlands, UK, Belgium, Germany, and Ireland were all consistent with the overall European trends, with C-Suite and Legal associated with simpler processes and IT associated with more complex purchases.  

Across all European regions we sampled, IT involvement was most common for software purchases, with particularly high percentages in the Netherlands (82.7%), and Belgium (73.0%). Legal involvement tended to be lower overall but is comparatively higher in Ireland for software (28.9%) and in the UK for services (28.4%). 

The likelihood of C-Suite involvement varies considerably by country and purchase type. In the Netherlands, the C-Suite is more engaged in hardware-machinery purchases (75.5%), while in Belgium, their involvement is minimal in software purchases (23.0%).

Procurement involvement tends to be common across hardware-machinery and software purchases, especially in regions like Ireland (60.7% for hardware-machinery and 44.7% for software), the UK (60.5% for hardware-machinery), and Germany (48.7% for hardware-machinery and 47.9% for software). 

To see how often each role was involved in purchases of various types across countries within Europe, please see the appendix. 

Decision Drivers

This year, we asked buyers about the key factors behind their organization’s choice of the winning vendor. In our Global Report, we noted that most drivers were ranked similarly, but that clearer patterns emerged when Decision Drivers were grouped into tiers. In other words, the overall rankings didn’t vary much, but certain factors consistently ranked near the top, middle, or bottom. For example, Price, Product/Solution Features, and Ease of Implementation and Use were consistently ranked near the top, though differences between the three were not statistically meaningful

The patterns within Europe are less clear. Price and Product Solution Features largely remain on top with more variation across the rest of the drivers.  

Overall, there is little difference between the highest-ranked and lowest-ranked Decision Drivers within Europe. This indicates that no single factor dominates the decision process; instead, buyers consider a variety of factors when choosing a vendor.  

The close scores may reflect a competitive market where vendors must excel across multiple dimensions (price, quality, service, etc.) to be chosen. This implies that excelling in just one area might not be sufficient; vendors need to provide a well-rounded offering. 

How Buyers Rate Vendor Personnel for Helpfulness

The last 30% of a buying process involves interactions with people from provider organizations. While favorites have largely been chosen by the time this occurs, no deals are done until vendors have been fully vetted and relationships built (or not).  

To gauge the helpfulness of the seller-side individuals involved in buying processes, we asked buyers to rate which sales roles from vendor organizations were most helpful to their purchase process. 

Mirroring our Global Report, buyers reported moderately positive ratings for all, with little difference between the most and least helpful. The same is true among countries within Europe. On a scale from 1 to 5 where 5 represents the highest level of helpfulness, ratings across Europe ranged from 3.1 to 4, less than one point on the 5-point helpfulness scale, indicating no clear “favorites.” This suggests that buyers generally consider all roles to be helpful. Not surprisingly, the BDR/SDR role is consistently the lowest rated. There is a slight tendency for buyers to prefer those in Senior Leadership roles, though this preference is minimal. 

Process Sentiment

From our research, it is clear that buying groups exert substantial effort across their buying journeys. They spend most of their purchase journey independently researching solutions and, in Europe, have more than 620 interactions with vendors alone throughout the process. And, this may represent a small fraction of their total research effort (Gartner). 

To understand whether buyers feel that the process was time well-spent, we asked buyers to reflect on their entire purchase journey and rate their experience on a scale from 1 (dissatisfied) to 5 (very satisfied). Remarkably, over 91% of buyers across Europe reported that they were either satisfied or very satisfied with their purchase process. While buying is undoubtedly an arduous process, most buyers emerge from the experience feeling satisfied. 

In the chart below, we show the satisfaction ratings that buyers gave based on their location within Europe.  

The Contracting Process

In addition to rating their overall experience, we asked buyers to evaluate the contracting phase of the purchase process, including contract negotiations, terms and conditions, and payment terms. Here, we asked buyers to note whether these parts of the process made them more or less likely to buy from that vendor in the future. Buyers answered on a scale from “much less likely” to “much more likely”.  

 As mentioned in our Global Report, European buyers were more likely to indicate that the contracting process made no difference to their future purchasing decisions compared to their North American and APAC counterparts. In North America and APAC, the contracting process tends to increase a buyer’s likely of repurchasing. Still, more than half of European buyers reported that the contracting process made them more or much more likely to buy from the vendor in the future. 

More Likely to Purchase
Made No Difference
Less Likely to Purchase
Belgium
55.7%
31.1%
12%
Netherlands
59.2%
33.9%
6.8%
Ireland
63.2%
29.5%
7.3%
Germany
68.5%
24.1%
6.5%
United Kingdom
68.4%
25.6%
6%

Chapter 4

Implications

As discussed throughout this report, the French expression ‘Plus ça change, plus c’est la même chose’ aptly captures the essence of our findings, confirming that while there are interesting nuances that distinguish European buyer behavior from the rest of the world, the core parameters of the B2B buying process remain consistent with global patterns. 

Buyer Journeys in Two Phases

No matter where buyers are located, the B2B buying process unfolds in two distinct phases: the Selection Phase and the Validation Phase (see here for a full discussion of the two-phase buying process). 

In the Selection Phase, which spans more than two-thirds of the buying journey, buying groups come together, gather and evaluate information, and build a consensus short list of potential partners, with a favorite at the top. Buyers are diligent in completing their research before connecting with sellers. Over 80% of the time, it’s the buyers—not the sellers—who initiate first contact, only after they’ve set their shortlist and defined their requirements.  

In the Validation Phase, which comprises the final 30% of the buying journey, buying groups validate their consensus choice by reaching out to shortlisted vendors, starting with their favorite. More than 80% of the time, the vendor on the top of the short list at the start of the validation phase wins the business. Further, requirements had largely or completely been set during Selection Phase over 78% of the time, yet again indicating that buyers rarely change their minds once they connect with sellers to begin the Validation Phase. 

While all buyers in Europe go through both phases, regional trends indicate subtle differences in their approach and timing. Although many of these trends are not statistically reliable due to limited sample sizes, the buying patterns we observed within Europe align with global patterns in the following way: where buyers evaluate more vendors, they tend to use larger buying groups, require more vendor interactions, later vendor engagement, and have longer buying cycles.  

The difference in journeys between the Netherlands and Belgium beautifully illustrates this pattern. Differences in those journeys can be seen in the table below. 

Netherlands
Belgium
Vendors
3.5
4.6
Buying Group Size
7.6
11.4
Buying Cycle Length (Months)
8
11.5

To thrive in an environment where buyers assess more vendors than average, sellers should focus on helping buyers narrow their shortlist. By highlighting strengths and providing comparisons with one or two key competitors, providers can establish trust and help buyers streamline their decision-making process. Reducing the number of vendors a buyer evaluates will shorten the buying cycle, decrease the number of required buying team members, and cut down the buyer’s workload and interactions with each vendor.  

Chapter 5

Appendix

Methods

The Survey Sample

Our Global Study included 2,509 B2B buyers across three geographic regions: North America, Europe, and Asia-Pacific (APAC). Participants from Europe made up nearly 30% of our global sample (29.77%).  

In this current report, we focus only on the 674 respondents from Europe. The table below shows where these participating buyers are across Europe. 

Country
Number of Respondents
Proportion of Sample
United Kingdom
304
45.1%
Ireland
98
14.5%
Belgium
61
9.1%
Germany
108
16.1%
Netherlands
103
15.2%
Total
674
100%

To qualify for the survey, participants must have bought at least $10,000 USD in annualized value within the last 24 months (the average respondent in Europe participated in such a buying process 7.5 months prior to taking the survey). The annualized deal size made by participants in Europe was $200,001 to $300,000 USD. Buyers in Europe work for companies that have experienced an average of 37.9% revenue growth over the past year. They also represent companies of various funding types, including privately funded (32%), Private Equity (PE)-backed (26%), publicly traded (37%), and Venture Capital (VC)-backed companies (4%). 

Tech & Software companies were the largest share of participants (32%), followed by Professional Services (22%) and a relatively even distribution across Business Services (15%), Financial Services (15%), and Manufacturing (16%). No one in our European sample held Individual Contributor roles. Forty-one percent held VP and above positions, followed by Manager roles (39%), and Director roles (20%).  

Key Role Involvement

Ready to see 6sense in action?

Picture of Kerry Cunningham and Sara Boostani

Kerry Cunningham and Sara Boostani