2025 B2B Buyer Experience Report

How AI Is (and Isn’t) Disrupting Buying Journeys

Discoverarrow_forward

Executive Summary

Our prior research showed that B2B buyers select a favored vendor before engaging sellers — and that pre-contact favorite wins the deal roughly 80% of the time. That core truth still holds in 2025. What has changed is the timing of that first contact.

This year’s global study of nearly 4,000 B2B buyers found that:

  • Buying cycles are shorter. Average cycle length dropped from 11.3 months in 2024 to 10.1 months in 2025.
  • Buyers are contacting sellers earlier. The point of first contact (POFC) shifted from 69% of the journey to 61% — a difference of roughly six to seven weeks.
  • Yet decisions remain locked in before first contact. Ninety-five percent of the time, the winning vendor is already on the Day One shortlist, and four out of five deals are still won by the “pre-contact favorite.”

Two external shocks explain these changes:

  • Artificial Intelligence. Nearly 90% of buyers report AI features are now part of the solutions they acquired. The need to validate what AI capabilities vendors actually provide — including pricing, security, implementation — is pulling buyers into earlier conversations.
  • Economic Uncertainty. Nearly half of buyers said economic pressure shortened their cycles, and 62% said it drove earlier seller engagement. Many sought to commit funds quickly before budgets could tighten.

Despite these disruptions, buyers remain in control. They are more experienced than ever, averaging eight to nine prior purchase journeys per category. And they still set preferences well before first contact, meaning that sellers encounter buying groups whose members are deeply experienced and whose choices are largely decided.

Acknowledgments

We thank our partners for the 2025 Buyer Experience study and report: 2X, MarketOne, LeadFabric, and Green Hat. As you are about to read, this year’s edition of the research presented us with surprises and challenges. Each of our partners has helped us increase the scale of the research, while also providing invaluable input and inspiration toward the design and interpretation of this year’s research. We are grateful.

01

Introduction

Introduction

Over the past year, the promise of AI and specter of economic uncertainty have dominated business discussions. Our 2025 study of buyer behavior comprises two surveys totaling more than 4,000 responses, and it captured a marketplace in a state of flux, buffeted by these powerful forces.

Last year, we described the 70/30 Buying Journey, which divides the buying process into two main phases: the Selection Phase and the Validation Phase. The Selection Phase, which accounts for the initial 70% of the journey, finds buyers researching, debating, and forming preliminary consensus on a preferred vendor. The Validation Phase, which follows, begins with buyers reaching out to sellers and culminates in the purchase. Notably, about 80% of the time, the favored vendor at the end of the Selection Phase is the same one buyers ultimately purchase from after the Validation Phase.

In this year’s report, we delve into how the promise of AI and the looming specter of economic uncertainty are distorting the contours of what we had termed the “70/30 Buying Journey”, while leaving its key dynamics intact.

The Promise of AI

Across boardrooms, SLT meetings, and LinkedIn feeds, AI is discussed in terms that are equal parts fear and reverence:

  • Is this the birth of our dystopian  —  or our utopian  —  future?
  • Will it make us all more productive, or redundant altogether?
  • Are buyers already relying heavily on LLMs for their buying research?
  • Will buyer agents soon be doing deals with seller AI agents, leaving revenue teams out of the picture entirely?


What we discovered in our research for the 2025 Buyer Experience Study is that AI is reshaping buying in not one, but two important ways.

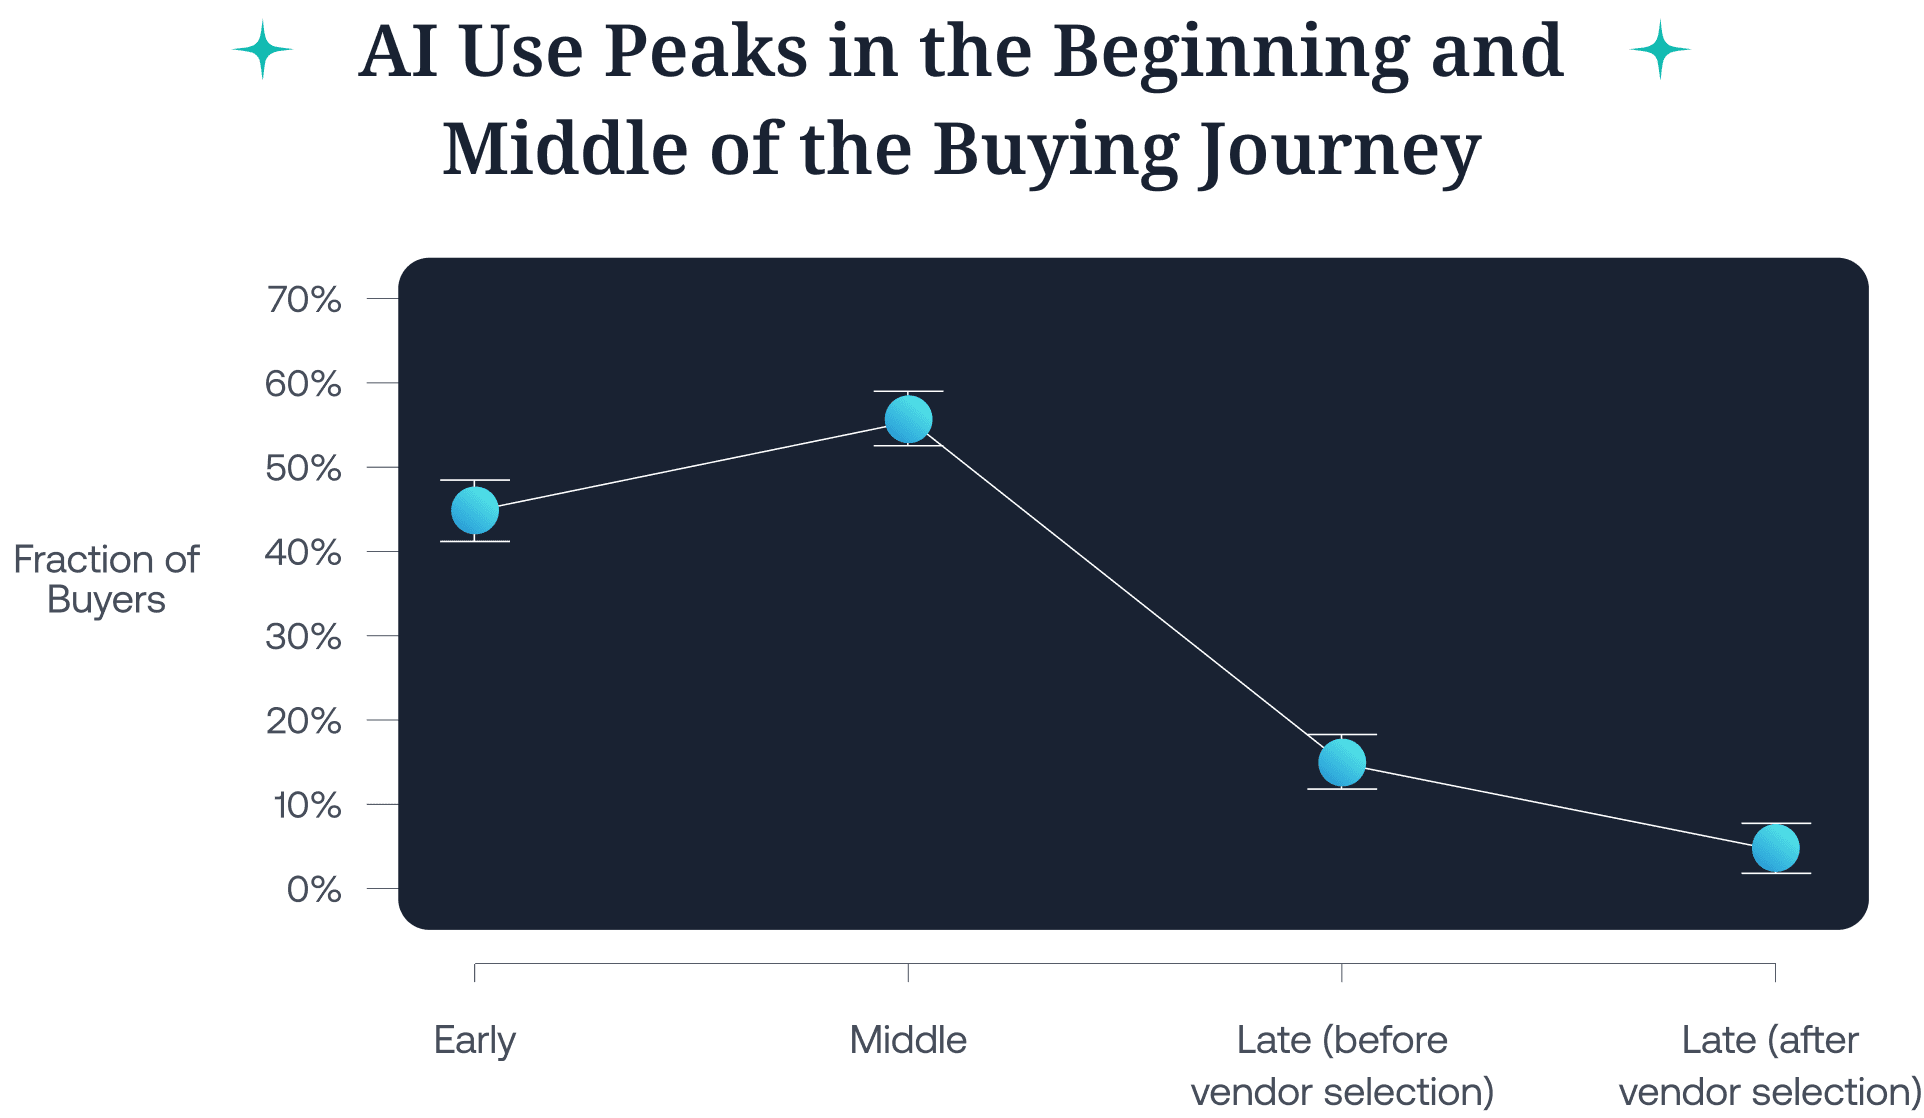
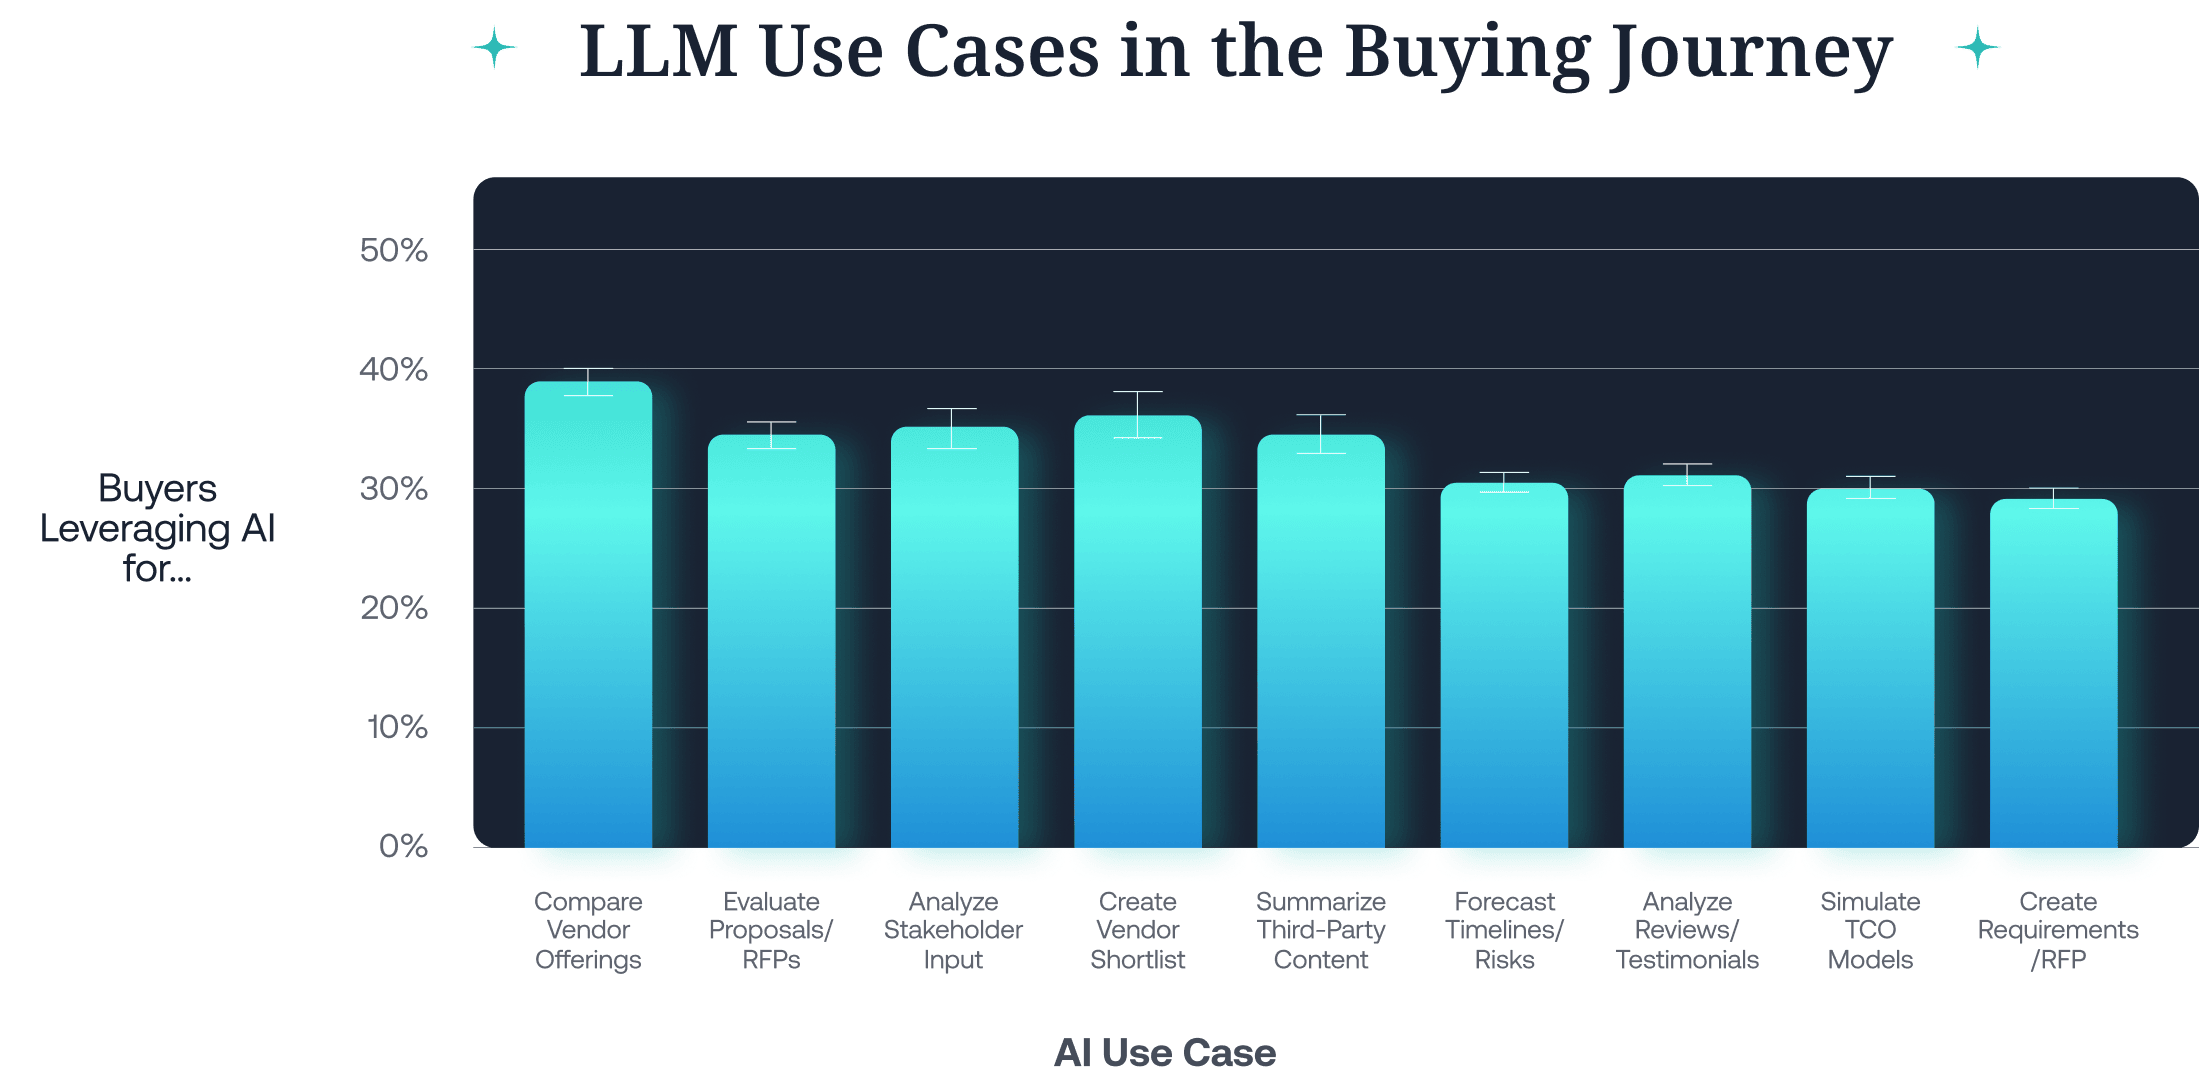
  1. First, there’s the use everyone’s been watching: how buyers are using AI as they research and evaluate solutions. Our report describes in detail how buyers are utilizing AI in their shopping.
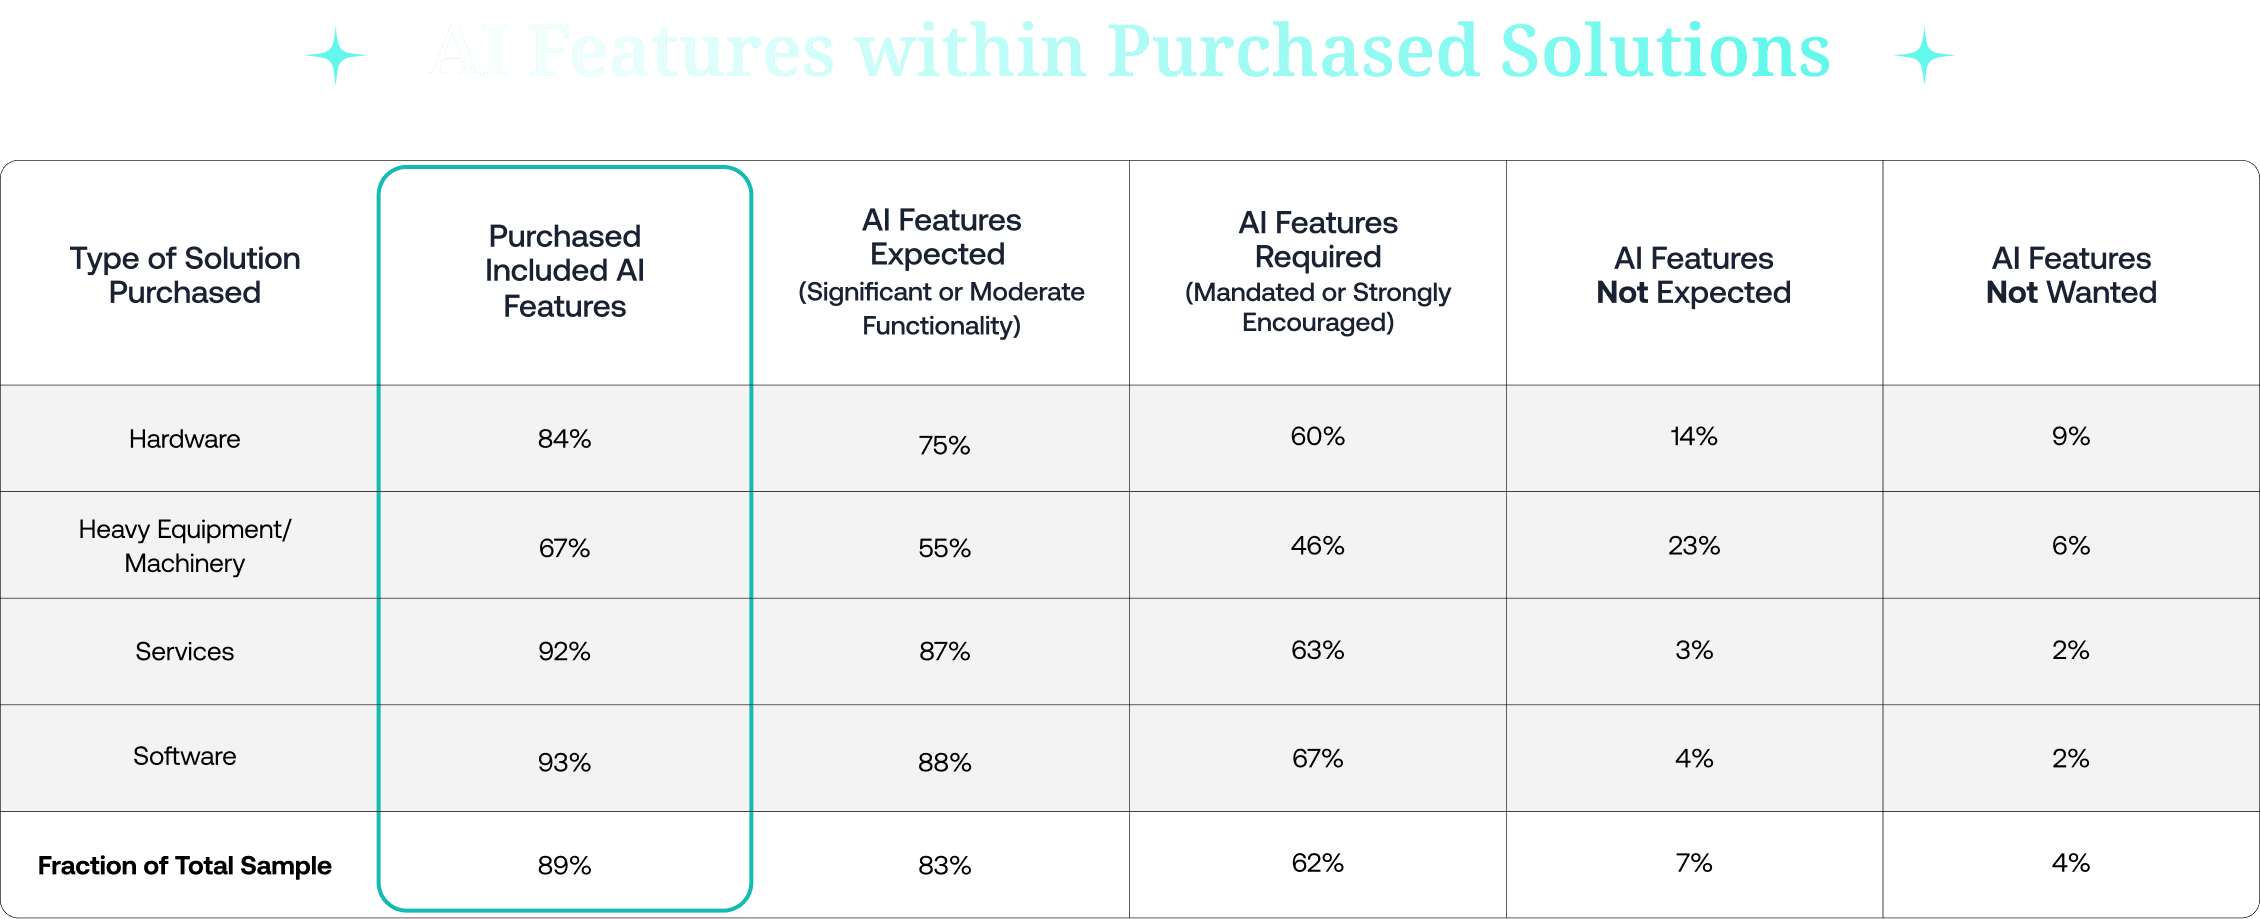
  2. But the second — and currently more important — shift is that AI has become a core element of nearly every solution companies are acquiring, and buyers have to account for that in their evaluations.

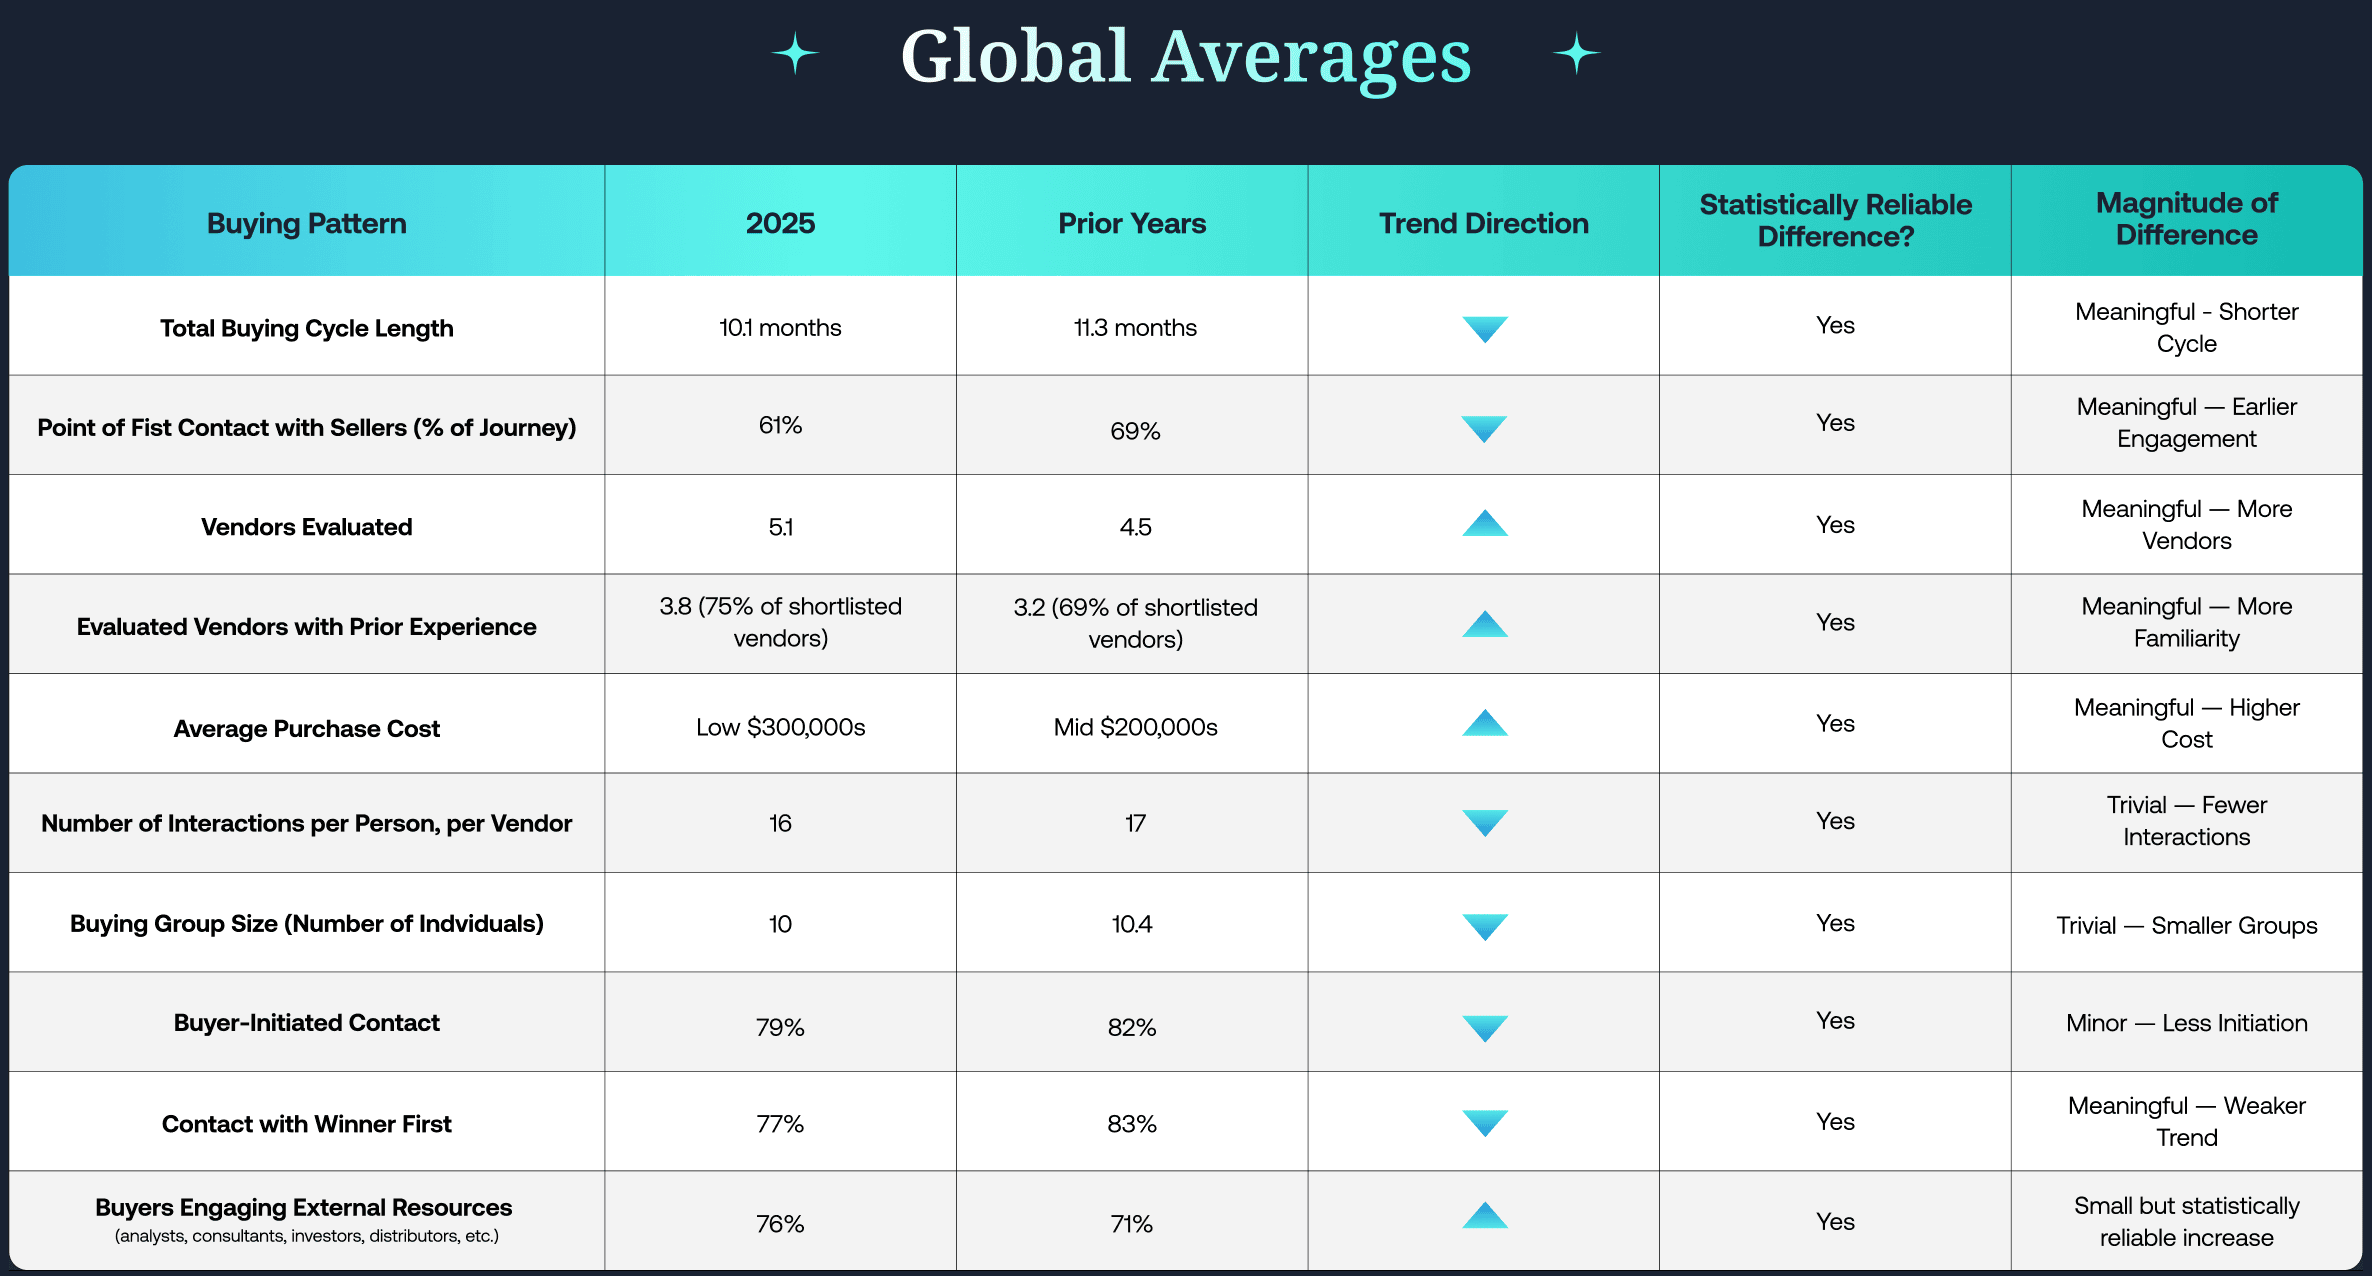
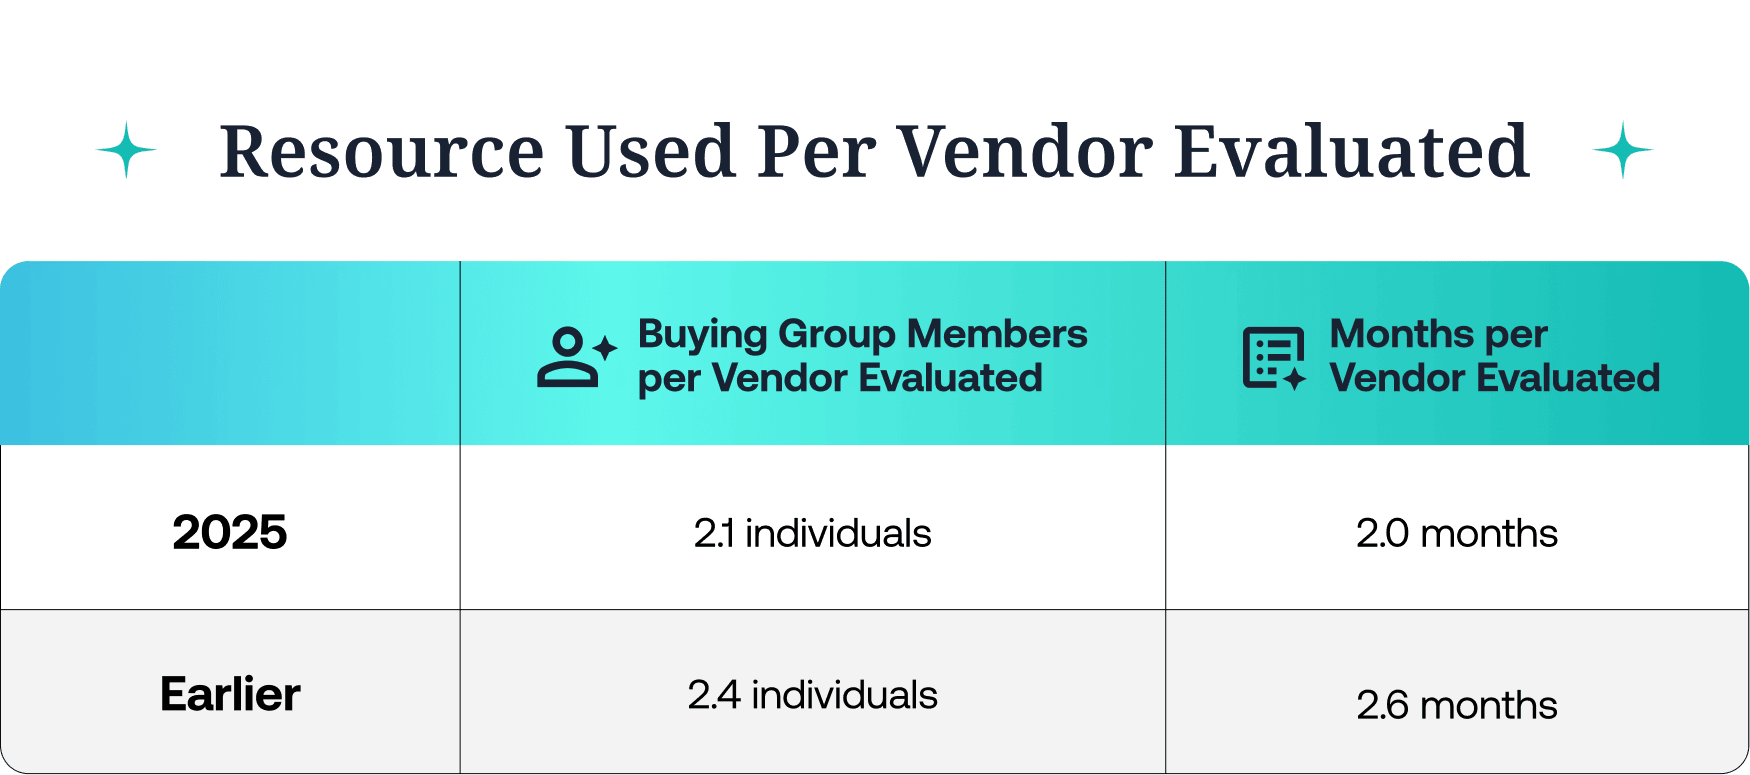
In our earlier Buyer Experience Reports, we have emphasized how the buying journey has been abstracted from the sales cycle. Results from two years of research and just over 5,000 participants across three major global markets have shown us that:

Buyers are deeply experienced in the solution categories that impact their roles.

&

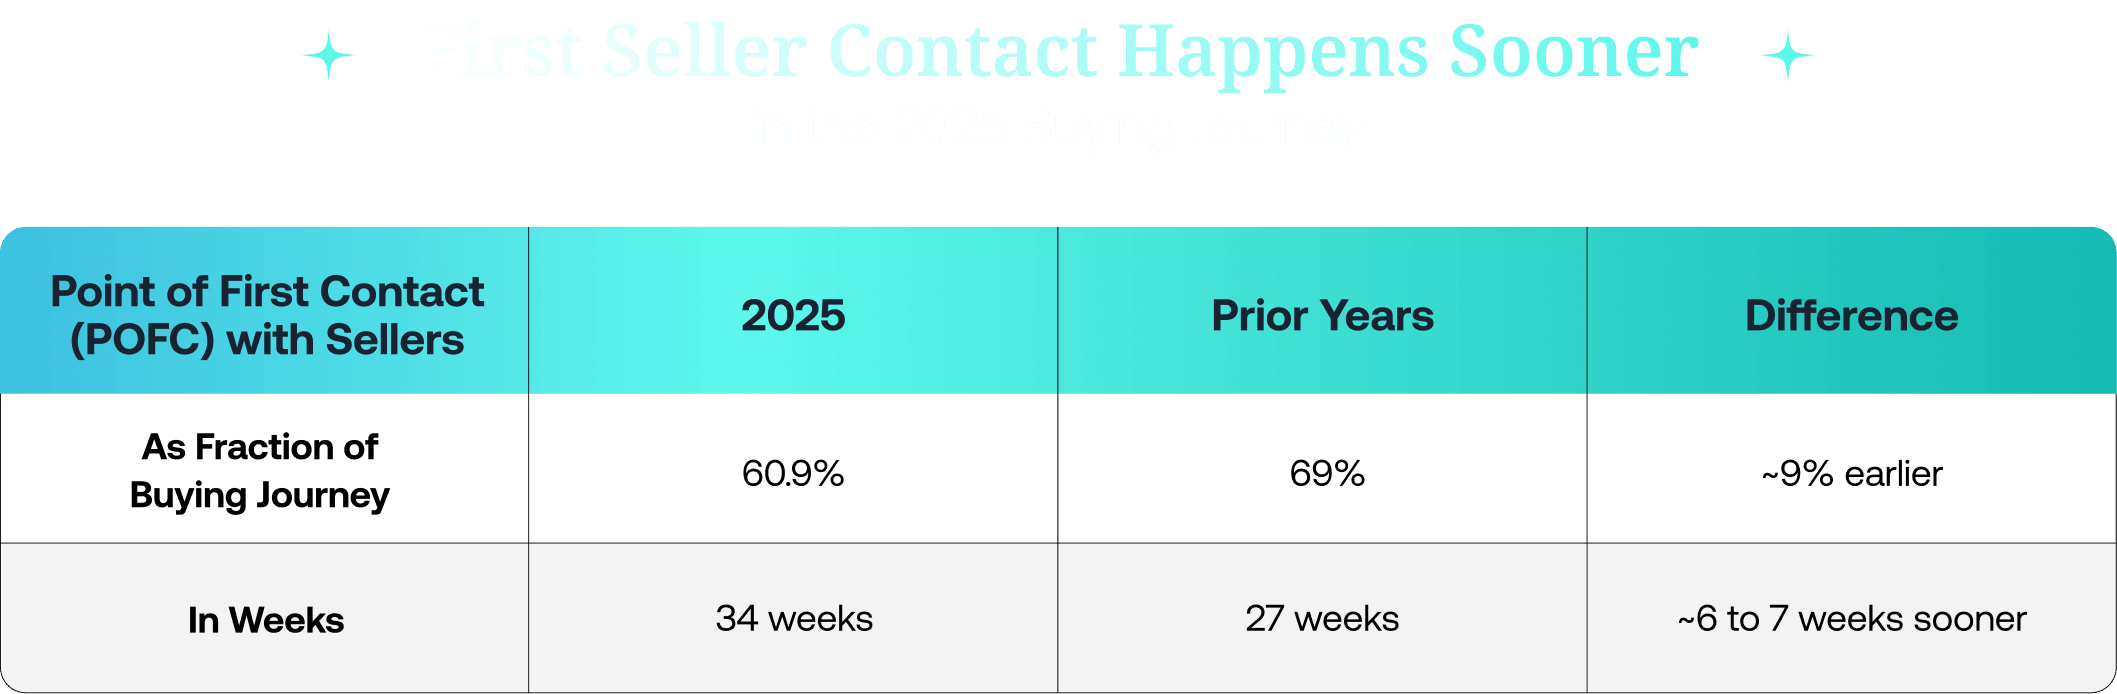
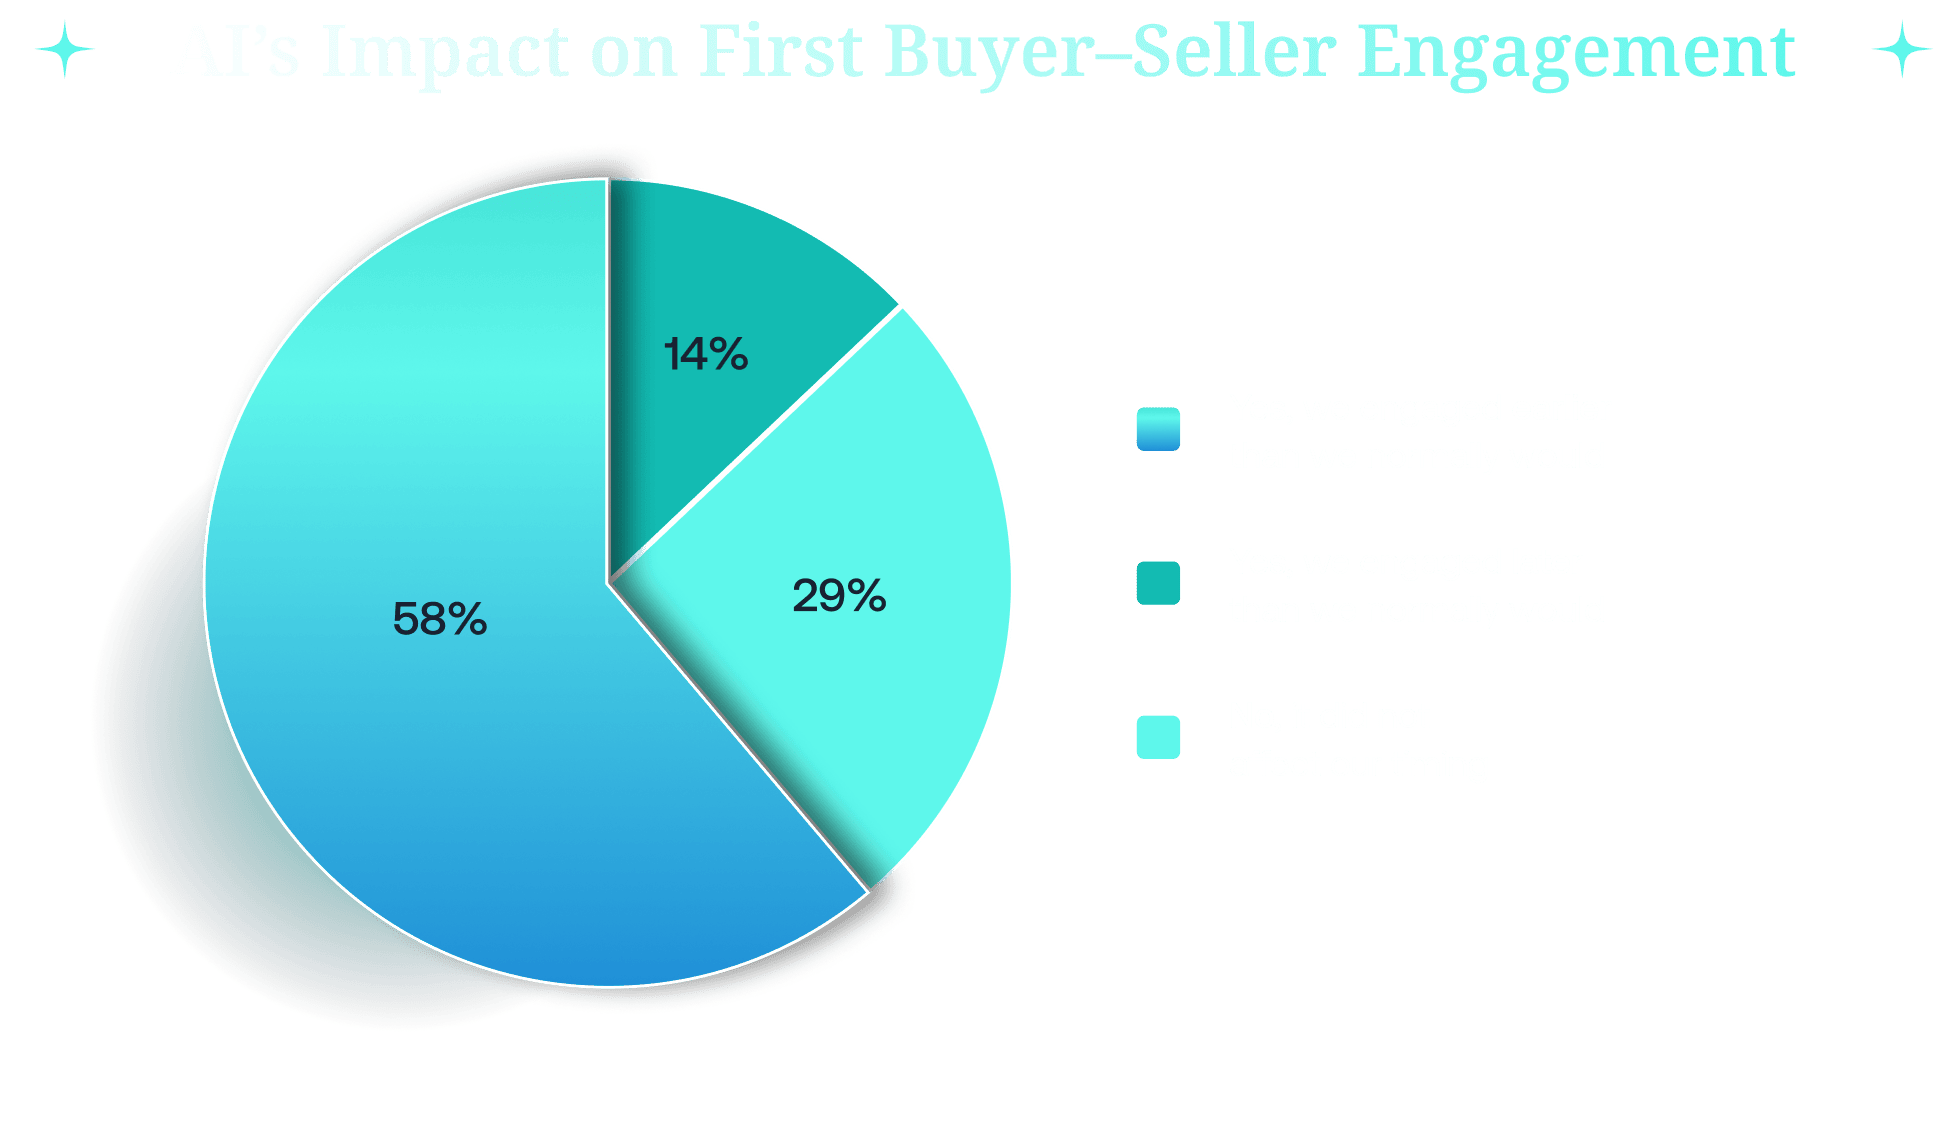
They are able to execute two-thirds of their buying journeys — including choosing winning vendors — before engaging with sellers.

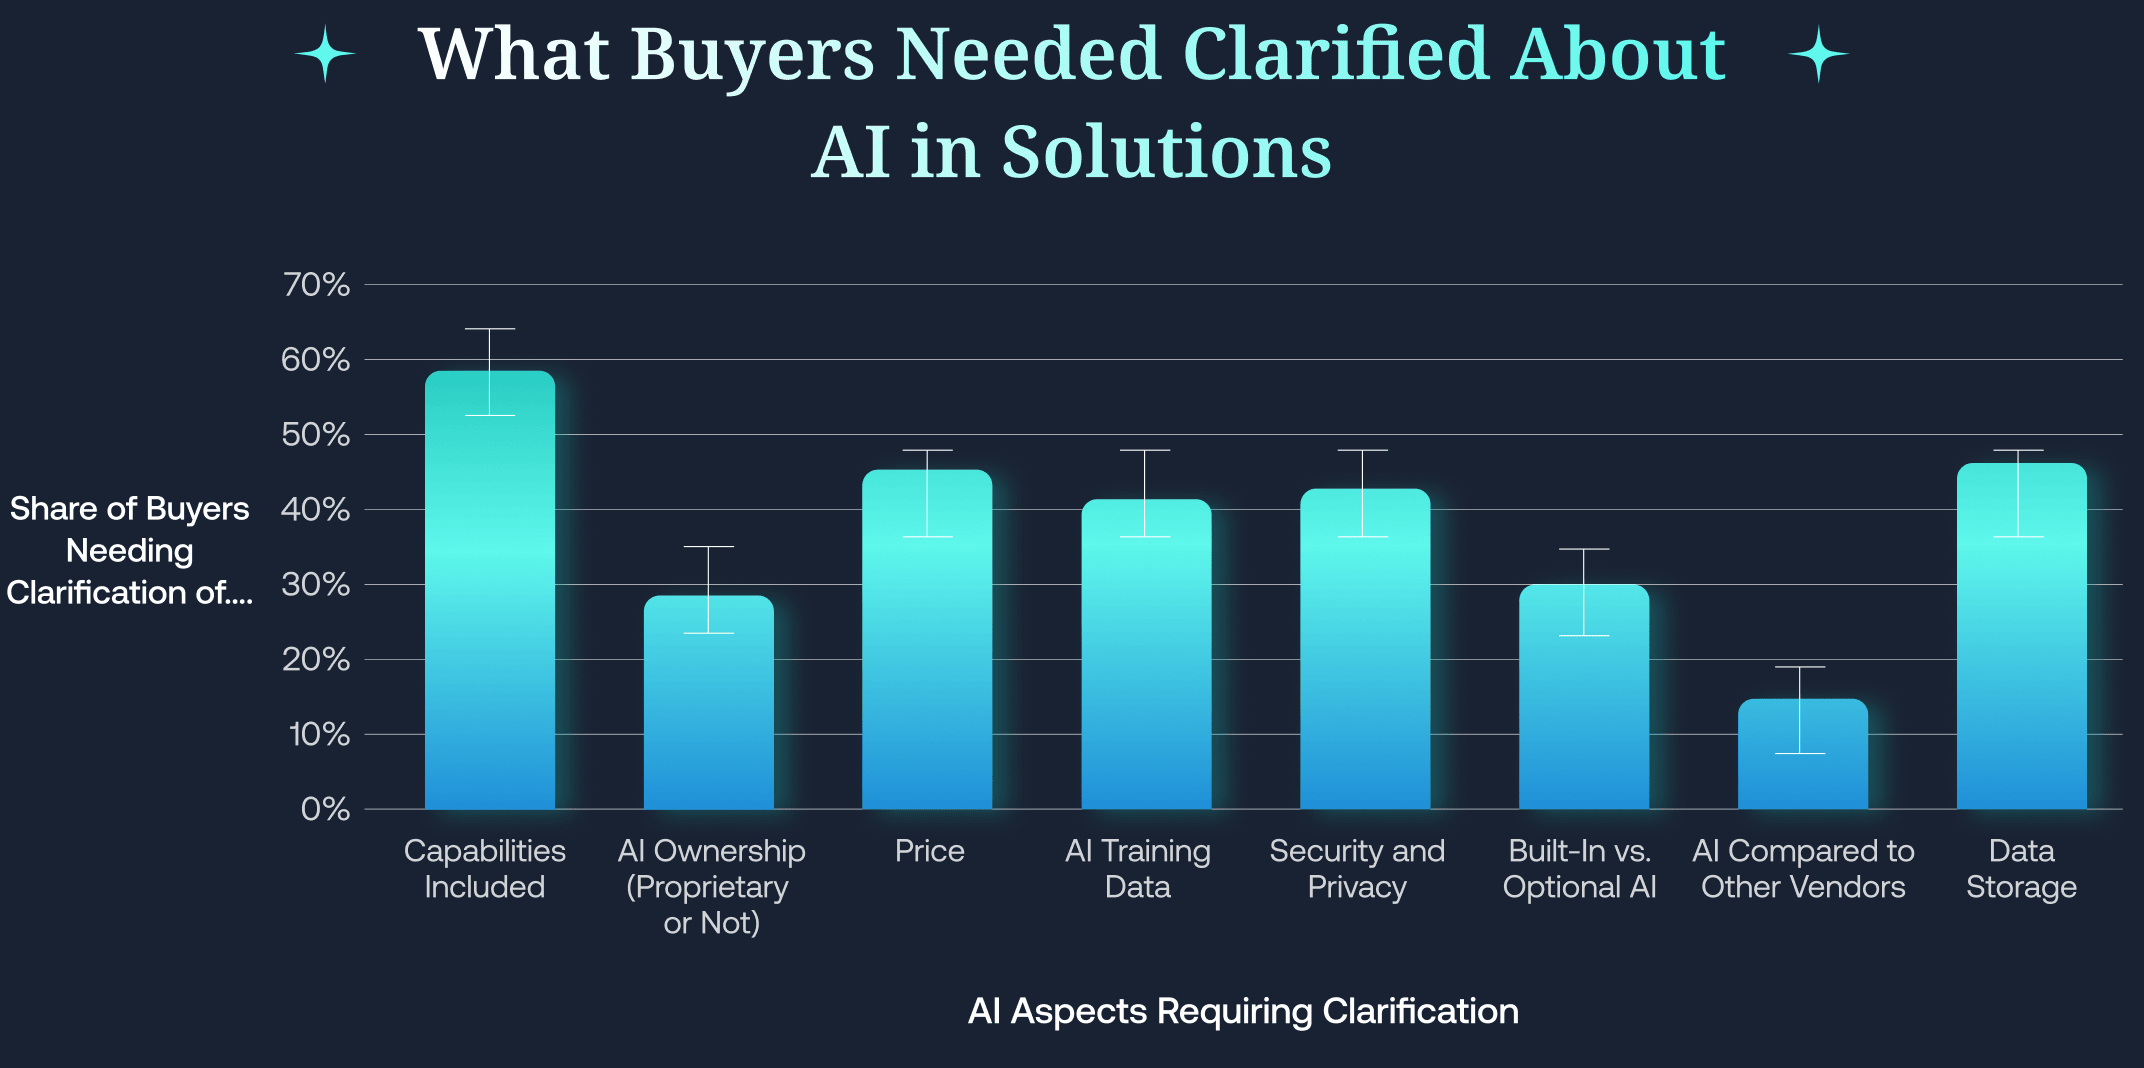
However, buyers of nearly every B2B solution now have to understand whether AI is embedded in those solutions, and, if so, what it is doing. They need to know how AI is changing a vendor’s capabilities, pricing models, implementation timelines, and data security.

Simply put: a buyer’s due diligence now includes answering vital questions about how AI is being implemented in solutions they buy, whether technology or services, and even physical goods.

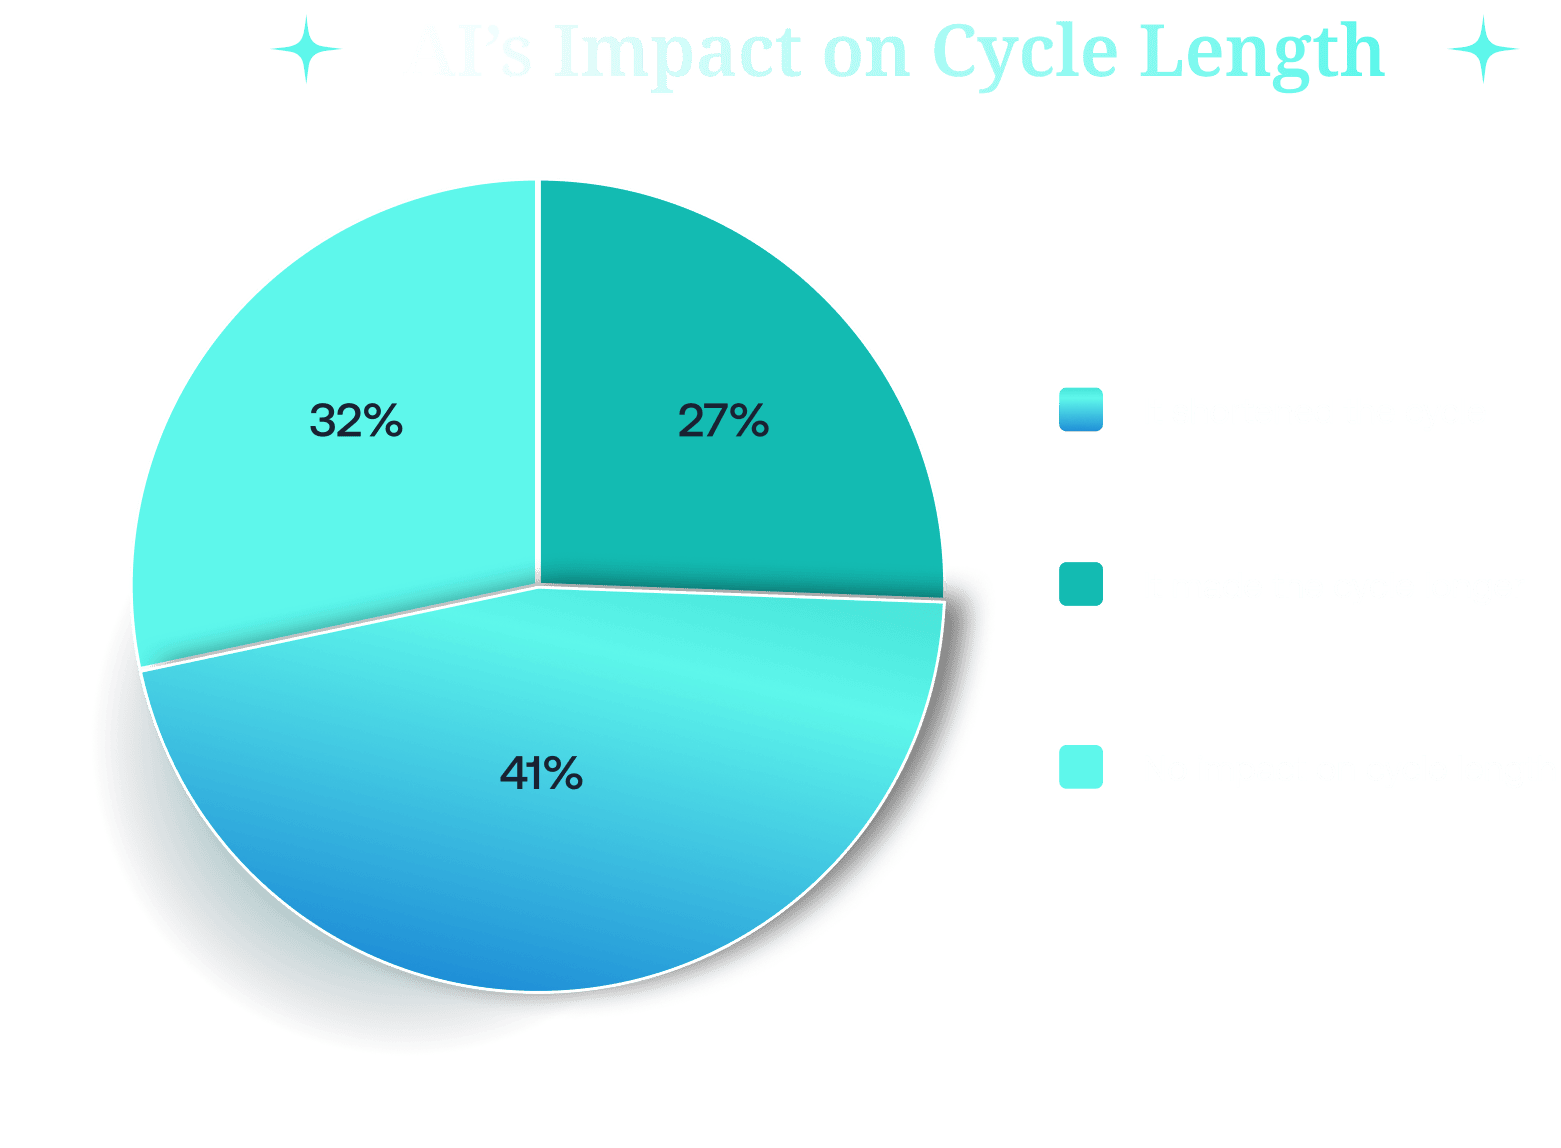
Buyers’ experience in a given category is of little use in this new terrain, and the information they need is not readily available on vendor websites. Later in this report, we discuss how this is warping buying processes.

The Specter of
Economic Uncertainty

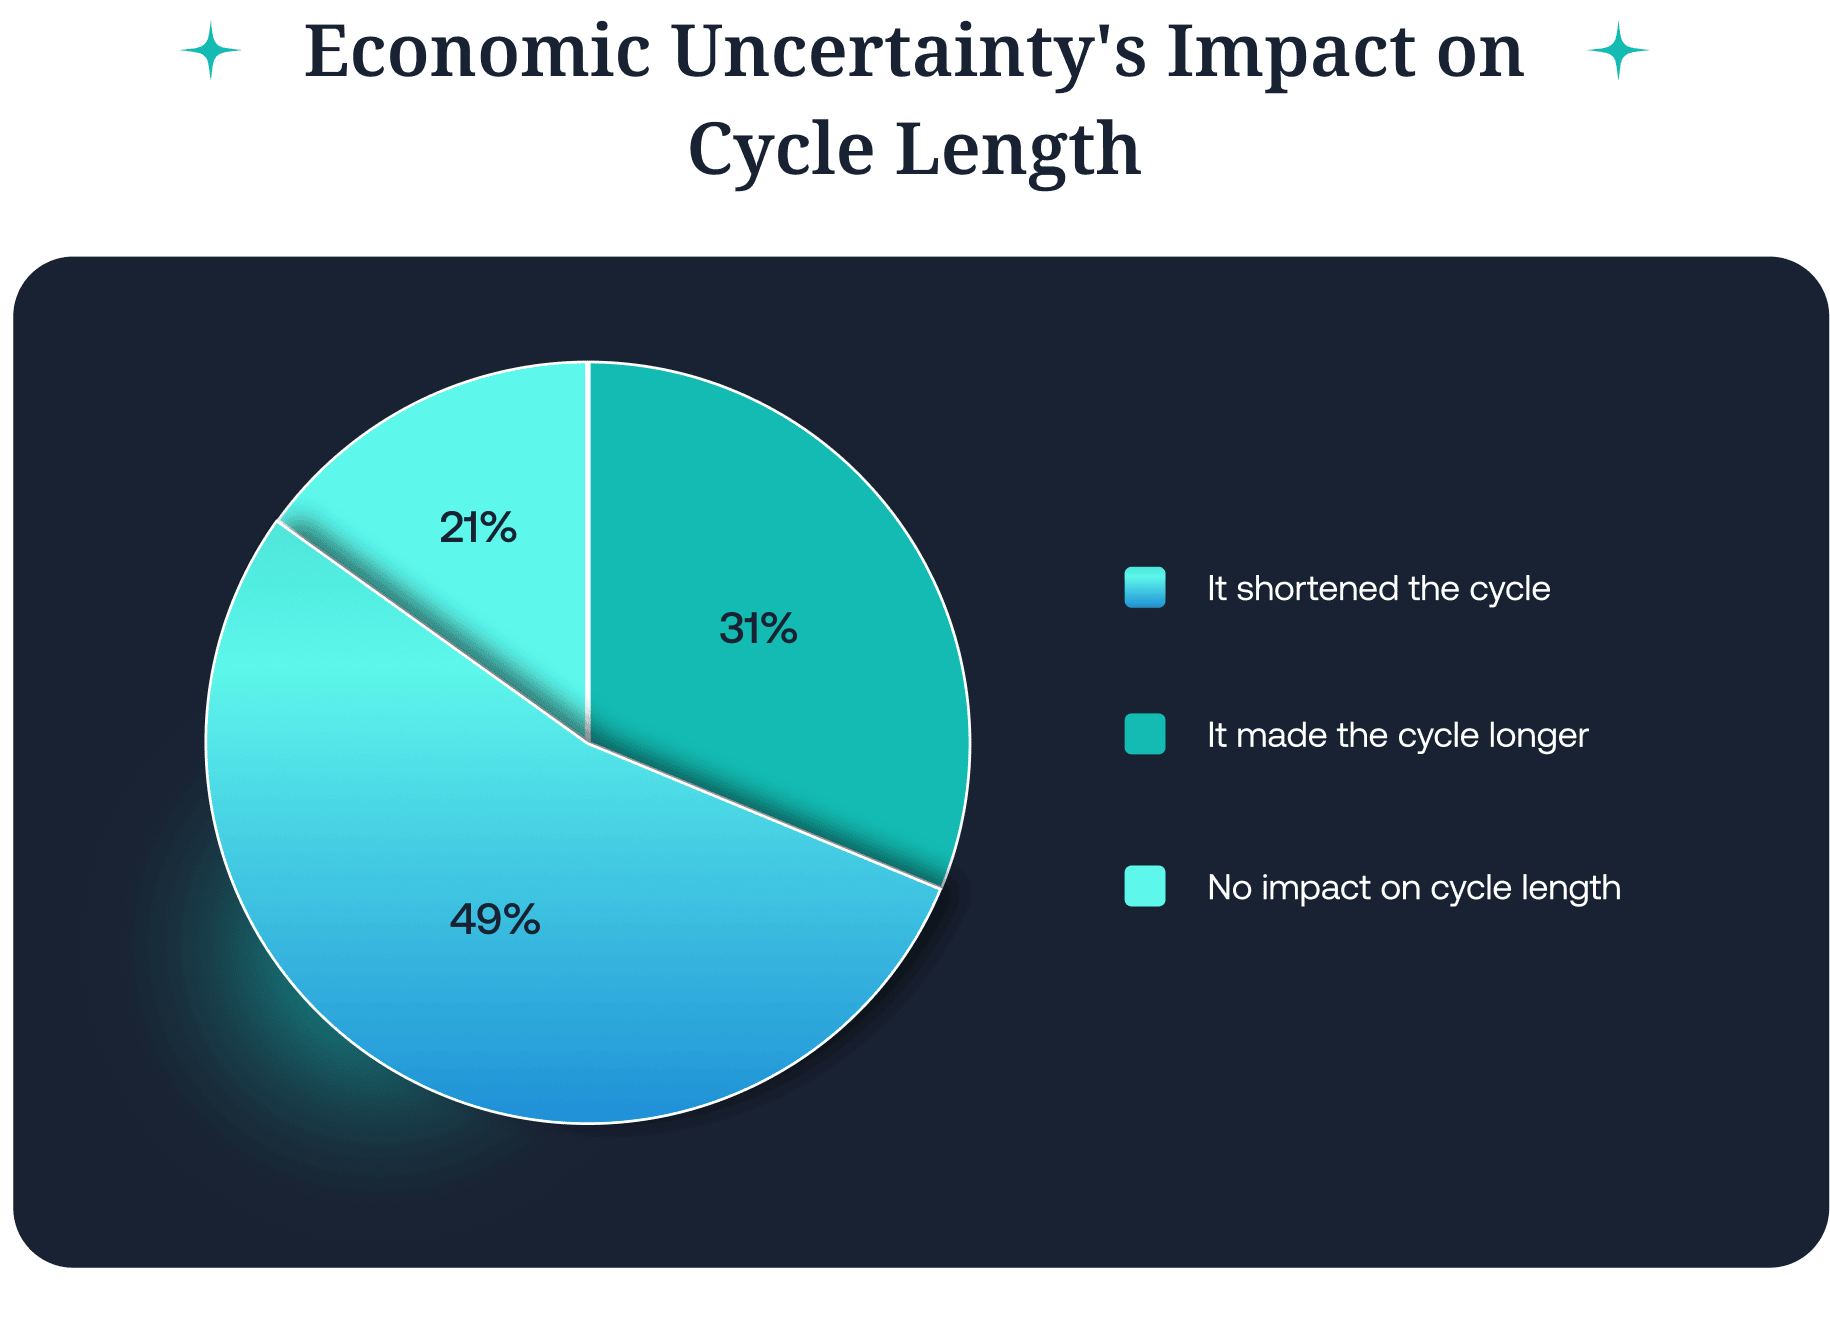
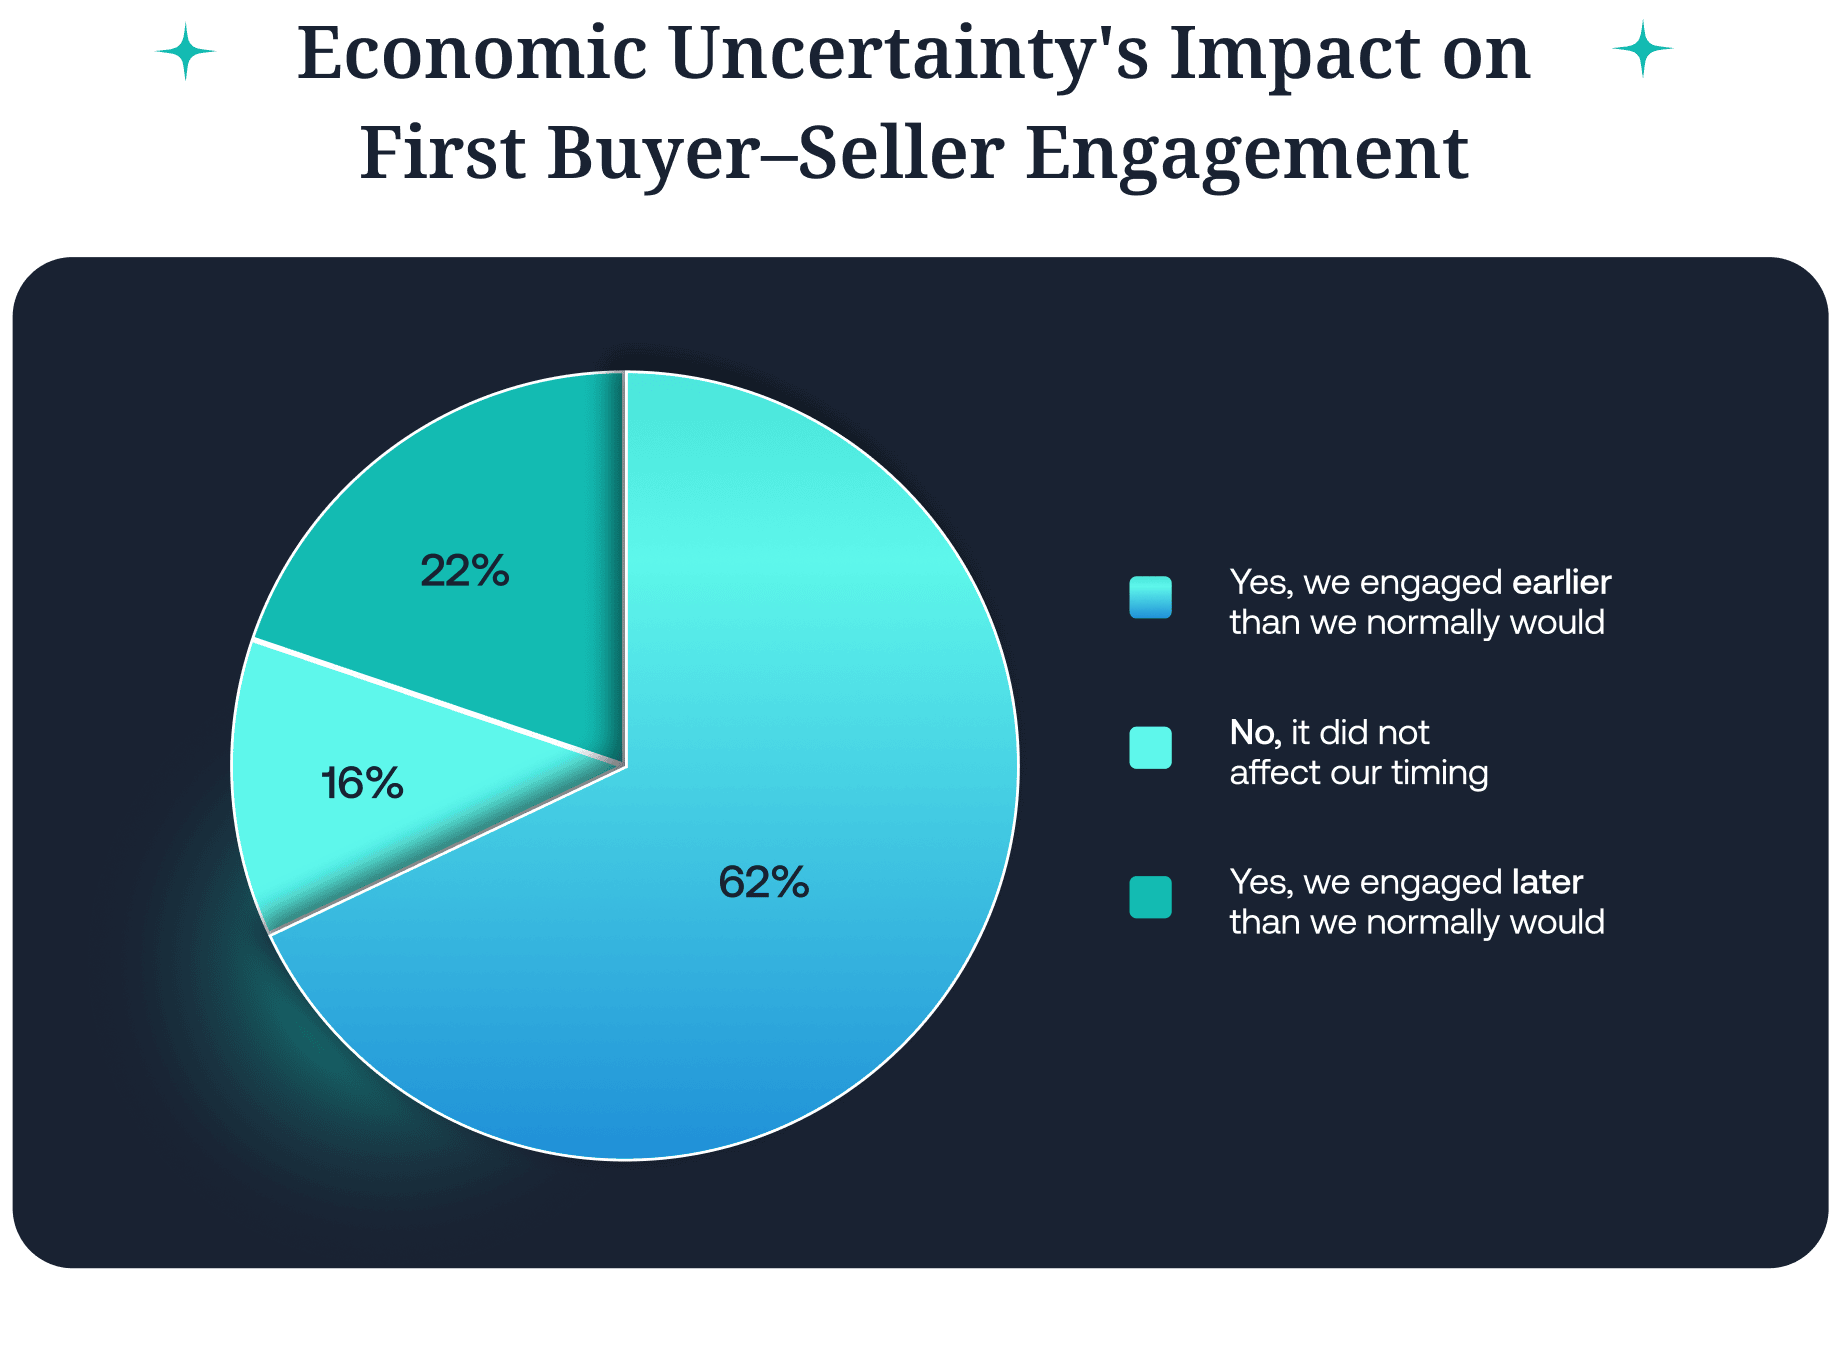
Alongside the rise of GenAI, persistent macroeconomic uncertainty continues to keep many organizations in a defensive crouch — slowing hiring, tightening budgets, and raising the bar for new investments.

Our interest, naturally, is to understand whether buyers are pulling back with caution and skepticism – or, conversely, moving quickly to spend before budgets tighten further.

Our 2025 Buyer Experience Report answers these questions.

What you will read in this report is that buyers are still in control, still human, and surprisingly consistent in how they move through the buying process — even as the world around them transforms.

However, transform it has, and buyer behavior reflects that, distorting a key aspect of the buying journey we have been reporting on for two years.

02

Methods

This year’s study collected nearly 4,000 responses from buyers across North America, APAC, and EMEA.

Technology (42%) and services (38%) organizations together make up the largest share of participants, followed by manufacturing (14%) and smaller contributions from healthcare, telecommunications, and government. The median purchase cost across buyers fell between $200,000 and $300,000, with a minimum spend of $25,000 in the past two years required for participation.

A companion survey on AI within solutions and economic conditions contributed an additional 766 responses, referenced in the findings below. Further details on our sample of buyers can be found in the appendix.

03

Findings

Summary of 2023 and 2024 Buyer Experience Study Findings

Key Insights

  • Buying groups are large, experienced, and their journeys span nearly a year.Typical purchases involve 10+ people, take close to a year, and almost always draw on prior vendor experience.
  • Vendor selection is largely decided before sellers are engaged. By Day One, buyers already shortlist ~4 of 5 vendors — nearly all of whom they’ve had prior experience with — and ultimately purchase from that list 85% to 95% of the time.
  • Sellers enter late, and only on the buyer’s terms. Buyers delay contact until two-thirds of the way through their journey, initiate outreach themselves over 80% of the time, and overwhelmingly reach out first to the vendor they intend to buy from.

In 2023 and 2024, we set out to map the modern B2B buying journey by gathering direct feedback from thousands of buyers across roles, regions, and industries.

We wanted to understand what buyers are actually doing — not just what vendors believe they’re doing — during the decision-making process.

Over those two years, a remarkably consistent picture emerged:

  • B2B buyers are groups that average 10+ members (on $250,000 average deal size).
  • The typical buying journey in B2B takes nearly a year.
  • Buyers evaluate an average of nearly 5 (4.5) vendors. They have prior experience with about 4 (3.2) of those and fill 4 (3.4) spots on their shortlist on Day One of the buying journey. In 85% of cases — rising to 95% in 2025 — buyers ultimately purchase from one of the four vendors on their Day One shortlist.
  • On average, buyers don’t engage with sellers until they are two-thirds of the way through their journeys.
  • Sales development (SDR/BDR) outreach plays a minimal role in influencing the Point of First Contact (POFC) with buyers; in most cases, buyers are deliberately ignoring unsolicited outreach until they’re ready.
  • When buyers do engage, they initiate that contact over 80% of the time, reaching out to vendors only once they have established purchase requirements and ranked their shortlists in order of preference.
  • The vendor buyers contact first has a massive statistical advantage: ~80% of the time, the vendor buyers reach out to first wins the deal, strongly indicating that buyers identify a favorite vendor prior to contact and reach out first to that provider.
  • Buyers are not blank slates. Regardless of their role in the buying process or seniority in the business, buyers say they have prior personal experience with at least one of the vendors on their shortlist 97% of the time.

Within the careers of most B2B marketing leaders, buyers had no choice but to engage with sellers to begin their buying journeys. With little to no direct access to product information, they had no choice but to engage. But for many years now, buyers have been able to chart most of the journey themselves — engaging sellers only after they have formed strong opinions that need to be validated. As a result, sales cycles today don’t begin until buyers initiate contact with sellers, and buyers put that moment off until they are nearly two-thirds of the way through their buying journey.

That was the baseline heading into 2025. But as new technologies and market pressures take hold, this year’s research suggests the balance is starting to tilt back toward sellers — subtly, but measurably.

2025 Findings: The Song Remains the Same, But the Rhythm Has Been Disrupted

Key Insights

  • Buying cycles are shorter even as more vendors are considered. Despite evaluating slightly more vendors than in past years, buyers completed their journeys over a month faster on average.
  • Buyers are contacting sellers earlier. The point of first contact shifted from about 69% of the journey in 2024 to 61% in 2025 — roughly 6 to 7 weeks sooner.
  • Despite these changes, buying still happens on buyers’ terms — with major decisions made before sellers are called.Despite compressed cycles and earlier engagement, nearly 80% of seller conversations are still buyer-initiated, and the vendor contacted first continues to win 8 out of 10 deals.

Summary of 2025 Findings

Buyers are Contacting Sellers Earlier than Before.

  • The most significant change in buyer behavior is that the point of first contact (POFC) between buyers and sellers is happening earlier.
  • In relative terms, buyers’ first engagement with sellers shifted from about 69% of the way through the buying journey in 2024 and 2023 to 61% in 2025.
  • In absolute terms, that translates to contacting sellers roughly 6 to 7 weeks sooner.

Buyers Are Engaging Earlier to Evaluate Vendor AI — Not Because They Are Using AI.

  • 94% of buyers are using LLMs, but this has not changed their reliance on vendor content or third-party experts.
  • 58% of buyers said that the need to evaluate how vendors are implementing AI inside their solutions caused them to engage earlier.

On Day One, the Shortlist Is Near Complete — and the Winner Comes from It 95% of the Time

  • Buyers now evaluate an average of 5 (5.1) vendors.
  • They have prior experience with 4 (3.8) of those and fill 4 (3.6) spots on their shortlist on Day One of the buying journey.
  • Buyers choose from one of the four vendors on their Day One Shortlist 95% of the time (up from 85% last year).

Buyers’ Top Choice at the End of the Selection Phase Is Still the Ultimate Winner in the Validation Phase in Most Cases

  • This year’s study validates that buying occurs in two stages. The Selection Phase precedes contact with sellers and culminates with the choice of a preferred vendor. The Validation Phase involves live contact with vendors and results in a final selection.
  • 94% of buyers said they ordered their shortlist according to preference during the Selection Phase prior to engaging with sellers.
  • The Selection Phase winner is the final winner 77% of the time, but that trend has weakened slightly (prior years = 83%), a shift we’ll unpack later in the report.

Buyers Bring Extensive Experience to the Buying Journey

  • Last year, we found that buyers were more experienced than we had previously understood. This year, we explored that topic in substantially more depth, including how often buyers have been through prior purchases in their product category (an average of 8 to 9 times).
  • In 2025, buyers also reported prior experience with an average of 3.8 of the 5 vendors on their shortlist (up from 3.2 in previous years) and filled a larger share of their shortlist on Day One of the buying journey.

Buying Cycles Are Compressed Despite More Vendors Evaluated

  • Buyers in our most recent study are considering more vendors, even as the total cycle length trends slightly shorter. This represents a meaningful shift in behavior. In prior years, each vendor added or subtracted from a short list made a difference of two months in buying cycle length. This year, buyers evaluated roughly half a vendor more on average compared to last year (4.5 vendors versus 5.1). If prior trends had held, this would have added about a month to the process. Instead, the average buying cycle compressed by just over a month.
  • We explore what might be compressing cycles below.

Same Buying Group Sizes Despite More Vendors Evaluated

  • Even though buyers are evaluating more vendors this year, buying group size hasn’t grown. This also breaks from prior years, where considering additional vendors typically meant larger teams as well as longer buying journeys.
  • Buying group size is still strongly correlated with how many vendors a buyer evaluates (2025: r=.635), but that correlation is meaningfully weakened from prior years (Earlier: r=.683).

Deal Size and Purchase Complexity Trending Up

  • The average cost of solutions purchased is up somewhat, and purchase complexity may be slightly up, but those are nuanced findings we’ll explore later.

Buyer-Led Engagement Still Dominates

  • In 2025, buyers initiated 79% of engagements, compared to 82% in prior years, a trivially small difference.


Together, these results reinforce the core truth of the modern B2B buying journey: buyers are confident and independent — but new dynamics are reshaping when they engage.

Why Are Things Different? Buying Cycle and Point-of-First-Contact (POFC) Compression

Key Insights

  • The overall drop in average cycle length this year is partly due to sample composition.More short-cycle physical goods purchases and fewer long-cycle software and services purchases helped lower the overall average.
  • However, buying cycles are genuinely compressing across all major solution categories as well.Buyers are spending less time per vendor whether they’re evaluating software, services, or physical goods.
  • Buyers are using fewer group members and spending fewer months per vendor.Group members per vendor evaluated dropped slightly (2.4 to 2.1) but reliably, and time spent per vendor fell from 2.6 to 2 months.

This year, we observed two important shifts in buyer behavior: the buying cycle has shortened, and buyers are initiating contact with sellers sooner.

To understand what might be causing these changes, we examined correlations, then conducted multiple regression analyses entering all correlated variables in our data set as predictors of both cycle length and point of first contact (stated as percentage through the buying journey when first contact with sellers occurred).

Buying Cycle Length – Is the Observed Compression Real?

Yes, but it’s complicated.

Globally, the length of the buying cycle dropped from nearly 11 ½ months (11.3) to just over 10 months (10.1). The region seeing the greatest compression was Asia–Pacific (APAC), which fell from 13 months to just under 11 (10.9).

As the table above shows, there are notable differences between regions.

As in prior years, a small number of factors have a meaningful impact on the length of a buying cycle. The most powerful driver is the size of the buying group, followed closely by the number of vendors evaluated (Vendor Count).

Buying group size is the strongest influence and explains nearly a quarter of the variation in buying cycle length.

Vendor Count matters in two ways:

  1. Direct effect – adding more vendors directly increases the length of the buying cycle.
  2. Indirect effect – adding more vendors leads to an increase in the size of the buying group, which in turn increases the length of the buying cycle.

Purchase cost also exhibits a reliable influence on buying cycle length, but, on its own accounts for less than 1% of unique variance in cycle length.

Below, we show how much of the variation in cycle length each factor explains on its own.

Table 4 below illustrates how the number of vendors evaluated affects the size of the buying group and the length of the buying cycle.

As the table above shows, the number of buying group members per vendor evaluated was essentially unchanged from last year (a statistically reliable but a trivial difference). The bigger shift came in time spent per vendor: in prior years, buyers devoted about 2.6 months per vendor, while this year that figure dropped to 2.0 months. With buyers evaluating roughly five vendors on average, this reduction translates into a buying cycle that is more than a month shorter.

Another important factor that influences buying cycle length is the type of solution being purchased (Solution Type). Here, buying cycles for manufactured goods are reliably shorter than those for other solution types.

  • Buying cycles for physical goods are on average 4.8 months shorter than services, and 2.8 months shorter than software.
  • Software purchases are also about 2 months shorter than services.

The mix of solutions purchased in this year’s sample helps explain, in part, why overall averages are down. In some regions, most notably APAC, there were more physical goods purchases represented in this year’s study compared to previously. In APAC, physical goods purchases increased from 20% to 32% of deals (average cycle length 7.3 months), contributing to an overall shorter cycle length in the region. In previous years, software purchases made up about half of APAC deals (average cycle length 14.2 months), whereas this year they represent only about 20%. This is likely more a function of our sample than of broader market trends.

In North America and Europe, Services purchases made up a larger of our sample population in 2025.

While some solution types do require longer or shorter journeys than others, we also see genuine cycle compression within each category. Plotting cycle length per vendor evaluated shows that buyers are spending less time per vendor across all three solution categories. This effect is most pronounced in software purchases, which have historically been among the longest buying journeys alongside services.

In summary, buying cycles are compressed across all major solution categories — buyers are spending less time per vendor whether they’re evaluating software, services, or physical goods. At the same time, the overall drop in average cycle length seen in the 2025 survey is partly due to sample composition: this year’s mix includes more short-cycle physical goods deals and fewer long-cycle software and services deals.

Point of First Contact (POFC) Compression

As with the length of the buying cycle, we built multiple regression models to identify influences on the point of first contact (POFC) between buyers and sellers.

Unlike our Cycle Length models, POFC models predicted only a small share of the observed change in point of first contact. Globally, the POFC dropped 9 percentage points.

If the prior POFC had held, the point of first contact would have been at 34 weeks – just over 7½ months – in 2025. Instead, the average was just 27 weeks – just over 6 months – a roughly 6 to 7-week difference. Together, the 30 variables we measured together accounted for only 12% of the 6 to 7-week difference, amounting to about 6 days.

The remainder of the difference could not be explained by variables we had in our original survey.

These findings raised an immediate question: why now? Buyers have had the tools, experience, and confidence to conduct most of their evaluations independently for more than a decade.

What could be prompting them to step into vendor conversations earlier in their buying journeys?

Based on our qualitative observations and conversations with B2B leaders, three plausible factors emerged:

  1. AI as a buying process tool – Much has been written over the past year about how buyers might or might not be using AI to aid in their buying journeys, noting a decline in web traffic on B2B vendor websites as an indication that buyers are using and stopping at LLMs in their evaluations.
  2. The need to evaluate AI inside solutions – not just GenAI’s use in the buying process, but how AI capabilities are being embedded into products and services.
  3. Persistent macroeconomic uncertainty – driving some organizations to move faster, either to secure budget before it disappears or to respond to shifting business conditions.

3 Things to Know

  • On average, buyers are contacting sellers about 6 to 7 weeks sooner. The point of first contact dropped from 69% of the journey in 2023–2024 to 61% in 2025.
  • Statistical models can only explain a small fraction of the shift. Even with nearly 30 variables tested, only about 12% of the change could be explained — leaving most of the difference unexplained by purchase characteristics like cost, industry, or solution type.
  • Theories behind change: AI and economic uncertainty.Are these two dynamics prompting buyers to move faster?

Are Buyers Substituting LLM Usage for Vendor Engagement?

No. Not yet, at least.

While we found that 94% of buyers are using LLMs in their buying process, that usage does not appear to be diminishing reliance on vendor interactions, digital or otherwise. In particular, we ask buyers each year to estimate how many interactions they had with the winning vendor across their buying journey. These interactions included both content and human interactions. Buyers this year reported have an average of 16 interactions per person with the winning vendor – one less than in 2024 and statistically identical number to 2023. For a deeper dive on how buyers are using LLM’s to aid their research click here.

Why isn’t LLM usage changing buyer interaction patterns?

There are multiple factors that may be leading to stasis in buyer-seller interactions in the present.

First, the typical purchase being reported in our survey had a median annual value of $200,000 to $300,000. Such purchases, even for the largest companies, represent significant investments, and, as such, significant risks for the individuals making the vendor selections. Even were LLMs fully trustworthy sources of information today, many if not most users would likely still be reluctant to trust without verifying all relevant information for themselves.

For companies experiencing a decline in web traffic attributable to LLMs, it is likely the traffic that has gone missing is not from in-market buyers, but from the professionally curious and from future buyers. This is not to say that marketers should be unconcerned about the decline of web traffic. However, that decline is unlikely to impact current pipeline production. To read how buyer experience may also mitigate the impact of LLM-induced traffic loss click here.

Second, another factor that may be buttressing the volume of direct interactions between buyers and vendors is the need to assess how vendors across all solution categories are implementing AI in their solutions. As we’ll detail below, the need to evaluate how potential vendors are implementing AI in their solutions is causing buyers to engage with vendor sellers earlier.

3 Things to Know

  • LLMs are widely used as a tool within the buying journey.94% of buyers report using LLMs during their buying process to do things like analyze sentiment in customer reviews and process information.
  • However, LLMs are not replacing vendor interactions.Buyers still report double-digit interactions with each vendor they evaluate (16 interactions per person with the winning vendor – one less than in 2024 and statistically identical number to 2023).
  • High-stakes purchases still require direct validation.GenAI is not yet at a stage where it can be fully trusted to guide purchases of $200,000 to $300,000. If you were making a purchase of that size for your organization, would you leave the decision solely to an LLM? Today’s buyers show that while they are using LLMs, these tools have not yet replaced the traditional work of the buying journey.

Is the Potential Presence of AI Inside Solutions Impacting Vendor Engagement?

Yes.

To test our hypothesis that both the presence of AI in solutions being evaluated and global economic uncertainty were leading to earlier buyer engagement, we surveyed B2B buyers in North America (n=557) and the UK (n=209).

First, we established whether buyers expected and required that the solutions they were evaluating would have an AI component. While expectations did vary by solution type, most buyers expected the solutions they evaluated to include an AI component. Across all respondents, about 95% said AI was at least a consideration in their purchase, and in many cases (62%), buyers were mandated or strongly encouraged to select solutions with AI features.

For example, machinery buyers were less likely than others to expect or require AI. Still, even in this category, a majority anticipated AI capabilities, and nearly 70% ultimately ended up purchasing solutions that included some form of AI feature.

Not only was AI expected, but buyers had significant expectations for its performance. On average, they anticipated AI features would take on two to three distinct roles (e.g., automation, predictive analytics, personalization, etc.).

With nearly all buyers at least considering AI — and most showing a strong appetite for what they expected it to handle — we then examined whether buyers brought specific AI-related questions or concerns to vendors. Unsurprisingly, many (62%) did. Their concerns included the very basic question of what capabilities are included (55%) and how much, if anything, they would cost (46%). Nearly half of buyers also needed clarification on how models were trained, how data would be stored, and what privacy and security issues the AI capabilities introduced.

Fifty-Eight Percent of Buyers Engaged Earlier In Order to Evaluate AI Capabilities

Next, we examined whether the need to clarify how AI was implemented in the solutions they were evaluating caused buyers to engage differently than in prior years. To understand this, we asked buyers, “Did uncertainty about AI-related features or claims influence the timing of your team’s first engagement with vendor sellers or SDRs?”

The results here were unambiguous: 58% of buyers reported that they engaged with vendor representatives sooner than they would have otherwise in order to address their questions about how AI was implemented.

This uncertainty triggered the reversal of the two-decade trend toward greater buyer independence, and it reflects the fact that prior category experience (buyers bring a lot of it to the table) offers little guidance in evaluating AI’s impact on capabilities, particularly with respect to pricing, implementation, and security. Compounding the issue, most vendor websites do not yet provide the clarity buyers seek on these topics — leaving direct engagement as the only viable path for buyers.

3 Things to Know

  • Most solutions now include AI features.89% of buyers purchased solutions with AI features — highest in software (93%), but even nearly three-quarters of heavy machinery/equipment purchases.
  • Buyers need clarity on AI capabilities that vendor websites don’t provide.62% of buyers needed sellers to answer AI-related questions, from training data, security, and privacy to basic capabilities and costs — information rarely clear on vendor websites.
  • Uncertainty about AI is pulling buyers into earlier conversations with sellers.58% of buyers engaged vendors earlier than they otherwise would have, reversing the long-standing trend toward greater buyer independence.

Not Just AI Uncertainty, Economic Uncertainty

The second hypothesis we tested was that economic uncertainty might also cause cycles and the point of first contact to be compressed.

Nearly half of buyers (49%) also said that economic uncertainty had led to shorter buying cycles. Organizations with approved budgets may have been eager to spend budgeted funds quickly, before potential pullbacks due to tariffs, cost-cutting, or other macroeconomic risks.

Not only were cycles compressed, but 62% of buyers said that they engaged with sellers earlier due to economic uncertainty, again accelerating the buying process.

Read more about how economic uncertainty is affecting the B2B buying journey here.

Our supplemental survey gave us not only an explanation for the changes we observed in the main study, but also a rare glimpse into how large-scale external forces can bend long-standing patterns in B2B buying. This also suggests that rather than a permanent realignment, changes may prove to be situational adjustments — though still adjustments that every revenue team must now recognize and adapt to.

Is Economic Uncertainty Impacting Vendor Choice?

Yes.

Nearly 70% of buyers in our study said concerns about economic conditions affected their vendor choice, specifically pushing them toward more conservative selections (e.g., known vendors, incumbents). Of those, just over one-third (34.6%) said their choices had been significantly impacted, and 40% somewhat impacted. Buyers reported that they had become more concerned about price and more conservative in their choice in equal measure.

3 Things to Know

  • Economic uncertainty is compressing cycles and accelerating contact.Nearly half of buyers (49%) said economic conditions shortened their buying cycles, and 62% engaged sellers earlier as a result.
  • Vendor choice is being directly impacted. Nearly three-quarters (70%) of buyers said economic concerns shaped their vendor selection, with 35% reporting a significant impact and 40% a moderate one.
  • Buyers are becoming more price-sensitive and conservative. Across functions, buyers reported greater scrutiny of costs and more cautious decision-making.

Uncertain? Yes. Undecided? Not So Much: The ‘Plus ça Change’ of B2B Buying Today

Key Insights

  • Buyers rank their shortlist before initiating contact with vendors.
    94% of buying groups put their shortlist in order of preference before engaging with sellers. They contact the preferred vendor first and purchase from them in nearly 80% of cases — making second place or below a steep uphill climb.
  • First contact reflects preference, not persuasion.
    When buyers had not ranked their shortlist prior to speaking with sales (applies to only 6% of buyers), the first vendor they spoke with won just 57% of the time. If first conversations were highly persuasive, that number would be much higher.
  • AI and economic uncertainty have not changed how buyers decide on a winner. Buyers are still in control. Despite earlier buyer-seller engagement, buyers still initiate contact close to 80% of the time, reach out to their preferred vendor first, and purchase from them in nearly 80% of cases.

In 2024, we introduced the Two-phase Buying Journey. In the first phase, the Selection Phase, buying groups evaluate options, largely establish their purchase requirements, and arrive at a consensus favorite vendor. The first two years of our Buyer Experience research found that this phase occupies a consistent two-thirds of the buying journey, irrespective of how long the buying cycle was.

Phase Two, the Validation Phase, begins when buyers engage sellers or SDRs directly for the first time (at the Point of First Contact, or POFC). In about 80% of cases, buyers are the ones who initiate that contact. Not surprisingly, they are overwhelmingly like to begin those conversations with the Selection Phase favorite.

Given the heightened uncertainty buyers reported this year — and its substantial impact on the timing of first contact with sellers — one might reasonably expect buyers to be less certain about their vendor preferences before engaging in those conversations.

As shown in figure 10 below, buyers this year were just as likely to establish their purchase requirements in advance of the POFC as in prior years.

This year, we asked buyers the most direct question we have asked to date, namely: “Was your team able to put your shortlist in order of preference prior to engaging with sellers or SDRs?”

A resounding 94% of buyers answered yes. Nearly all buyers enter their first seller conversations with a shortlist already ordered according buying group preference. This means that before engaging with sellers, the buying group has created an internal ranking of vendors — making second place or below at the time of the first meeting a steep uphill climb.

The data show just how steep. First, consistent with prior years, 79% of buyers reported that they, not vendor representatives, initiated the first buyer-seller interactions (prior years = 82%). Buyers are clearly still taking charge of when that first interaction occurs.

Given how closely buyers control that first interaction, it stands to reason that they would also choose carefully the order of their first meetings with vendors. Our earlier studies have shown that buyers speak with the ultimate winner first more than 80% of the time. This year’s study reiterated that finding. In the initial survey, 77.0% (n=3,744) of buyers saying that their first vendor conversation was with the ultimate winner. In our supplemental survey (n=766), 81% of buyers said they spoke with the winning vendor first.

While unlikely, this finding might indicate that persuasive initial conversations influence buyers more than their prior preferences, with first vendors winning 80% of the time due to compelling interactions.

To test this, we examined the rare cases where buyers said they had not ordered their shortlist before speaking with sellers. If buyers had not ordered their shortlists in advance, the first vendor to speak with the buyer should come out on top even more often than 80% of the time. However, when buyers have not identified a leader prior to the first conversations, the first vendor they spoke with won just 57% of the time.

Buying groups spend months ordering their shortlists as a group, and they do that before their first seller conversations nearly every time. And even where there are important considerations that need to be validated after that first interaction, that leader at the point of first contact is the ultimate winner nearly 80% of the time. There is still meaningful room for change in buyer preferences after the POFC, but being second or worse at that juncture is to be avoided.

It is clear: being the first vendor contacted is an indication that you are the preferred vendor, not the cause of becoming the preferred. And while buyers in this year’s research expressed greater uncertainty about vendor selection and engaged sellers earlier, this finding suggests that the real opportunity to shape outcomes still occurs before the POFC.

The implication for revenue teams is stark: earlier engagement alone will not win deals if the buying group’s ranking is already set. The competitive advantage lies in becoming the preferred choice before the POFC — through brand presence, reputation, and influence earlier in the buying journey — so that when uncertainty does drive buyers to engage, they are engaging with you first and from the top position.

AI-related questions and economic uncertainty may prompt earlier outreach, but that enlarged window is still primarily used to confirm existing preferences — not to reset them.

How Buyers Stage their Decisions and Post-POFC Wiggle Room for Sellers

As we have seen, buying groups clearly arrive at a meaningful consensus about which vendor they would prefer to buy from prior to first contact with sellers. However, when asked if they were open to changing their initial consensus, nearly half the buyers we surveyed said they were either Very Likely or Somewhat Likely to change their decision after the initial consensus. In practice, however, slightly more 20% actually changed their minds after engaging with sellers. It may be that buyers overestimate the extent to which they were open to changing. Most buyers identify the ultimate winner before engaging sellers and validating that choice with sellers simply doesn’t change the outcome very often.

We also asked buyers what would cause them to change their preliminary consensus. Price and tech fit emerged as the most common reasons. In practice, however, buyers typically resolved these questions in favor of their original preferred vendor. Among those who said they were Very Likely to switch from their initial favorite, price was far and away the most common reason for switching (53.5% compared to technical fit at 22.9%). Yet even in this group, most buyers ultimately stayed with their initial choice, suggesting that price concerns were often addressed sufficiently to preserve the original preference.

3 Things to Know

  • Buyers express willingness to reconsider their top-ranked vendor.
    Nearly half of buyers said they were either Very Likely or Somewhat Likely to consider a different vendor after reaching group consensus.
  • Price and technical fit are the main triggers for reconsideration.
    Technical fit (29%) and price (28%) were the top reasons buyers considered switching vendors after reaching initial consensus on a preferred choice.>
  • In practice, buyers rarely change their initial choice. Only about 20% of buyers actually switched vendors after establishing consensus.

Use of LLMs & External Resources

Key Insights

  • Buyers’ use of LLMs peaks in the middle of the buying journey.
    Buyers already know their vendor options well. Instead of using LLMs to discover providers at the outset, LLM use peaks in the middle of the buying journey to compare offerings and synthesize information.
  • LLMs are mainly used to analyze and summarize vendor information.
    The top use case is comparing vendor offerings, followed by tasks like RFP drafting, cost simulations, and implementation planning.
  • Many buyers expect AI to change how they use external resources, but it’s not happening yet. Nearly 80% of buyers expect AI to either augment or replace their reliance on hired external help such as analysts or consultants. However, that hasn’t happened yet — 76% of buyers hired outside help this year, up from 71% last year.

Earlier in this report, we discussed our findings that nearly all buyers reported using LLMs to research solutions (94%), but using LLMs has not reduced the number of interactions they are having with vendors.

We also asked buyers to tell us how they used LLMs, and, how LLMs might fit into their future buying practices.

When Buyers Are Using LLMs in the Buying Journey

As Figure 13 illustrates, buyers are clearly using LLMs earlier rather than later in their journeys. It may surprise many readers to see that buyers are using LLMs more toward the middle than the beginning of their journeys. To understand this, it is worth reflecting on an earlier section of this report, where we described how buyers are overwhelmingly likely to have prior experience with the brands they are about to evaluate. As such, in established product categories it is unlikely that buyers are going to LLMs or to standard search engines at the outset of their journey to discover vendors in their category of interest.

LLM Use Cases

In Figure 14 below, the most common use case for LLMs is to compare vendor offerings (i.e., creating comparison tables and the like). The next six use cases on the list are statistically equivalent and used by around one-third of buyers. Categorizing the use cases makes it easier to understand how buyers are using them.

We can think of each use case as belonging to either one of two categories:

1) synthesizing and summary information or 2) generating new information.

Each of the top use cases (with the exception of “forecast implementation timeline”) can be thought of as synthesizing and summarizing use cases. Creating an implementation time, simulating total cost of ownership, and creating RFPs are all use cases that require the LLM to generate net new content. On the whole, these are still less utilized than synthesis and summarization use cases.

To read more on how buyers are using LLMs to aid their research, click here.

LLMs and the Future of Buying

In addition to asking buyers how they are currently using LLMs in their journeys, we also asked how they expect AI to affect their reliance on external resources such as analysts, consultants, and other hired help. Just over half (51%) of our respondents foresee AI augmenting their use of these resources, while 28% expect AI to replace it. About 20% said they anticipate no change. With roughly 80% expecting at least some impact on how they hire (or don’t hire) outside help, it will be important to track how this influence evolves in future waves of the study.

For now, however, buyer behavior looks much the same in how they use content, engage vendors, and draw on external resources — if anything, reliance on external resources has grown. This year, we expanded our definition of outside help beyond analysts and consultants to include investors, distributors, and VARs. Seventy-six percent of buyers reported engaging at least one of these groups, up from 71% who reported using analysts or consultants last year.

Buyers’ Extensive Experience Evaluating Relevant Categories

Key Insights

  • Contrary to popular claims, age shows little impact on buying behavior.
    Buyers ranged from 21 to 70 years old (median = 39.6), but age had only trivial correlations with buying journey dynamics. Older buyers reported slightly more evaluation experience and somewhat more interactions with vendors, but not earlier seller contact.
  • Nearly all buyers have extensive prior experience.
    On average, buyers have been through 8 to 9 purchase journeys within the solution category they reported on, and 97% have prior experience with at least one vendor on their shortlist.
  • Past relationships heavily influence vendor choice. 85% of buyers report prior experience with the winning vendor, and 75% say they personally know sellers from the vendor organizations they evaluate.

Buyers Bring Years of Professional Tenure

This year, we asked buyers to report their age. Much has been written about how younger buyers might behave differently from older buyers, so we set out to see if there were differences we could identify.

In short, the answer is largely no. In our study, age ranged from 21 to 70 (median = 39.6). Age was correlated with most buying journey measures, but the correlations were almost all trivially small. As expected, older buyers reported more prior experience evaluating and purchasing solutions. There was also a very slight tendency for older buyers to engage with sellers later in the journey, and to have slightly more total interactions during their journeys.

Finally, as shown in Figure 15, age played a small role in the use of large language models (LLMs): those who did not use an LLM were on average 4.5 years older than those who did. However, those who did not use an LLM represented only about 6% of the entire sample.

There are no meaningful age-related differences in how important buyers felt LLMs were. Buyers in the 51 to 60 age range rated LLMs slightly – but reliably – less useful than their younger counterparts, but that decline was reversed for buyers aged 61 to 70.

One explanation for the minimal role that age plays in buying journey dynamics is that buying journey dynamics are likely driven by the company’s rules and norms, and by those imposed by the buying group.

Another factor concerning individuals who are part of buying groups is the degree to which they have prior experience in the category and with the vendors they were evaluating. Last year, we asked buyers whether they had prior experience with one or more of the vendors they were evaluating: 97% of buyers said they did.

This year, we went further, asking buyers what type of prior experience they had, how many times they had evaluated vendors in the category of solution they were describing in the survey, and how many of those journeys had ended in a purchase.

Buyers Have Evaluated Vendors in A Category Eight Times or More

The average buyer reported that they had been involved in a staggering 8 to 9 (8.6) purchase journeys within the category in question for the survey. This would suggest that a typical buyer of 40 years of age, will have been in a buying process roughly once every two years throughout their careers.

All buyers were highly likely to buy from a vendor they had previously purchased from. And a nearly equal number of buyers personally knew a seller from one of the vendors they were evaluating. Buyers from all buying roles have similar levels of experience with vendors and are all likely to know vendor sellers prior to their current buying journey.

Continue reading about buyers’ significant experience evaluating vendors here.

As the table below shows, all buyers were likely to have previously both evaluated and purchased from the vendor they most recently bought from. Having been evaluated and purchased before is a strong competitive advantage.

Physical goods buyers were substantially more likely to have previously evaluated and purchased from the vendor who won their business in the most recent buying journey the described to us. Buyers of services were more likely than software buyers to have bought from a vendor they had previously evaluated but not purchased from.


04

Implications

Implications

Key Insights

  • The buying journey has compressed from 70/30 to 60/40 — but the fundamentals of buying remain unchanged. Buyers are engaging vendors earlier, largely to validate AI capabilities, yet decisions still hinge on the same two phases: Selection (first ~60%) and Validation (final ~40%).
  • Preliminary consensus remains the strongest predictor of outcomes.The vendor ranked first at the end of the Selection Phase goes on to win about 80% of the time, showing that most deals are still effectively decided before sellers are contacted.
  • Revenue teams must adapt to win before the first conversation.
    Deals are most often won or lost in the Selection Phase, long before seller contact. Teams need to sense and act on early signals, provide high-value self-serve content, and measure success by shortlist placement and win rates — not raw leads.

The 2025 Buyer Experience Report confirms — and sharpens — our understanding of how modern B2B purchases unfold. The global patterns we’ve observed over three years are confirmed: buying groups are consistent in how they form, evaluate, and decide, regardless of region, industry, or deal size.

The 60/40 Journey – Preliminary and Ultimate Choices

Once again, buyers spend most of their journey conducting independent research, which culminates in a preliminary vendor choice. This choice is made before engaging vendors. What’s different this year is the timing of that first engagement. The two phases of the buying journey – Selection and Validation – have shifted from a roughly 70/30 split to a 60/40 split. This compression is primarily because buyers need to validate AI capabilities in what they are evaluating, and they need seller conversations to do that.

Before engaging with sellers, though, buyers are still choosing – and engaging first with – the ultimate winner nearly 80% of the time.

It is critical to understand that the need to clarify AI capabilities has moved the point of first contact earlier in the journey, but it has not materially changed what takes place in the two phases.

The preliminary vendor consensus — the vendor ranked first at the end of the Selection Phase — still predicts the final outcome about 80% of the time. That preliminary decision has simply moved earlier.

  • Selection Phase (first ~60%): Buying groups form, align on problem definition, research independently, and converge on a shortlist — with a clear favorite.
  • Validation Phase (final ~40%): The favorite vendor’s position is tested, often with AI capabilities under the microscope, before final decision.

Global economic uncertainty also compressed buying cycles, as companies sought to spend funds before looming budget cuts. Even more than the AI-related uncertainty, this change is likely to be temporary and may already have largely run its course as 2025 comes to a close.

Clarifying the Role of Sellers – Paying It Forward

The fact that most buyers choose a winner before first contact with sellers doesn’t diminish the seller’s role. Sellers have a narrow but important opening to shift preferences after the Selection Phase, succeeding about 20% of the time. We also found that buyer’s nearly always have experience with vendors they are evaluating, and nearly as often know sellers from those organizations personally. This suggests that a seller’s role transcends current sales cycles – and, in fact, performance in current sales cycles may have a greater impact down the line than in the present. Another way to frame this finding is that sellers are critical brand assets — even in lost deals – which exert a strong influence on future buying journeys.

Backing this up, prior experience remains a powerful lever in the buying process. In 85% of successful purchases, buyers had direct experience with the vendor. Notably, 68% of buyers already knew a seller from the ultimate winning vendor. While buyers also knew sellers from non-winning vendors, these prior relationships still give sellers a significant advantage.

Our findings here suggest two imperatives for B2B organizations:

  • Even if you are the last vendor to make the list and have little chance of winning the current deal, getting on the list and making a good impression is vital for future success
  • Because buyers gravitate to familiar sellers, vendor organizations should prioritize retention of effective sellers.

A Clear Mandate for B2B Revenue Teams

  • Invest in capabilities to sense, interpret, and act on buying group signals early.
  • Create and surface self-serve, high-value content that answers Selection Phase questions.
  • Equip sellers and CSMs to build preference outside of active cycles.
  • Measure success by shortlist placement and win rate — not raw lead counts.

In the modern B2B journey, the deal is most often won or lost before the first conversation — even more so in an AI-focused buying climate. The question for every revenue team is not whether to adapt, but how quickly and effectively they can do so.

05

Appendix

Appendix

Methods

This year’s Buyer Experience Study drew just under 4,000 respondents to the main survey. To dig deeper into how AI and economic uncertainty were shaping buying behaviors, we also ran a companion survey that brought in an additional 766 responses.

Who Took Part

Respondents represented a wide mix of levels and roles inside their organizations. Nearly half (49%) were VP-level or higher, with another quarter (25%) in manager roles and about one in five (21%) serving as directors. Individual contributors made up just under 5%. In terms of buying responsibilities, about half of participants (52%) were the ultimate decision makers for their organizations. The rest were distributed across procurement (15%), influencers (14%), champions (10%), and financial ratifiers (10%).

Where They Work

Technology (42%) and services (38%) dominated, with additional representation from manufacturing (14%), healthcare (3%), government (1%), and telecom (2%). Company revenues spanned from under $1 million to over $10 billion, with the largest clusters falling in the $10M–$100M (24%) and $100M–$500M (25%) ranges. Roughly one in four respondents came from public companies, one-third from private firms, and the rest from private equity–backed (31%), venture capital–backed (6%), or government organizations (3%).

Where They’re Located

Nearly half came from North America (46%), with Continental Europe contributing 20%, Asia–Pacific 14% and 20% came from the UK and Ireland.

What They Purchased

Respondents in this year’s study represented buyers of physical goods, services, and software. Services accounted for the largest share of purchases (41%), followed by software (33%) and physical goods (26%). The median purchase cost for services fell between $300,000 and $400,000. For software and physical goods, the median purchase landed slightly lower, between $200,000 and $300,000.