


Acknowledgments
We thank our partners for the 2026 Buyer Experience study and report: MarketOne, LeadFabric, and Green Hat. As you are about to read, this year's edition of the research is our most ambitious yet. Each of our partners helped us increase the scale of the research while also providing invaluable input and inspiration for its design and interpretation. We are grateful.


Introduction
The Journey as We Feel It
In the 1930s, researcher Wilder Penfield operated on epilepsy patients while they were awake, so they could report back what they felt as he probed their brains with an electrode. A poke in one region caused a sensation on the lips, while poking a few inches away might evoke the fragrance of freshly cut grass. Patient by patient, he poked, prodded, and mapped how our sensations are represented in the brain.
When researchers used those coordinates to draw a body, the result resembled no human anyone had ever seen: enormous lips, oversized hands, and a wildly disproportionate tongue mounted on a shrunken torso and spindly legs. Many will remember it as the sensory homunculus from Psych 101.
View Full Introduction
Penfield had discovered that more sensitive body parts are apportioned more brain real estate. Fingertips are highly sensitive, so they receive abundant brain space; the small of your back gets a meager share.
The sensory homunculus accurately shows how much neural territory the brain devotes to each body part. But as a picture of an actual human body, it is grotesquely misleading.
B2B revenue teams carry a homunculus of the buying journey built from what their systems have been able to observe. For roughly a decade, ad clicks, form fills, inbound leads, CRM stages, and similar signals supplied the coordinates. Revenue teams rendered those visible events in vivid detail and treated them as the whole journey. The activity those tools could not capture became the homunculus’s shrunken torso.
For four years, we have studied B2B buyer behavior to map the parts of the journey that conventional revenue systems leave out. That research allows us to redraw the journey to scale. Almost every part changes when buyer-controlled activity receives the same attention as the activity marketers and sellers have relied on for more than a decade.
First, we know that buyers spend roughly 60% of their buying journey in what we call the Selection Phase, deliberating internally about category value and vendor selection. During that time, nearly all buyers set requirements and choose a preliminary winner. In the journey homunculus most marketers still operate under, the Selection Phase doesn’t even exist. Drawn to scale, the Selection Phase comes to dominate the image.
Meanwhile, the Validation Phase, which corresponds to the sales cycle, shrinks to fit its actual role. The form-fill contracts from a massive event to almost nothing: just 35% of buyers used their own contact information. And because 82% of first vendor conversations are initiated by the buyer’s team, successful MQL follow-up also shrivels in this new homunculus.
We had already redrawn much of the buying-journey homunculus to these proportions last year. This year adds another substantial revision. Nearly all buyers stay current on relevant solution categories between evaluations, and most change their vendor preferences during that time. Buyers are therefore never completely out of market. The long inter-cycle period—previously invisible in the model—must now take its place in the homunculus. The new homunculus reveals that the model revenue teams have used was not merely incomplete; it systematically enlarged the parts of the journey sellers could observe and shrank the parts buyers controlled privately. Buyers did have a secret life, as this report’s title suggests. But buyers did not hide it from us. Their journeys were there to see all along. Our outdated model of the journey—our antiquated homunculus—hid that reality from us.
The rest of this report redraws the modern buying journey homunculus to scale.
Executive Summary
Experienced buyers begin journeys with informed opinions
Most buying journeys don't begin with discovery. This year's study once again found that B2B buying typically takes place within familiar categories and is managed by buying groups with deep category experience.
A new finding this year is that roughly three-quarters of buying journeys start with a buying group that already holds multiple opinions about relevant vendors. Most buying journeys, then, are not journeys of discovery but journeys of deliberation. That tracks with what we see in ancillary research: more than 60% of the software companies ranked in the top five of their category on G2, and over 90% of the top 500 companies in both manufacturing and services, are themselves more than 15 years old.
View Full Summary
Vendor opinions evolve between buying cycles
We have also added substantial depth to our understanding of what happens outside of buying journeys. More than 90% of buyers — even those in support roles — said they keep current on relevant solutions between evaluation cycles, and for nearly three-quarters of buyers, their view of vendors in a category changes at least somewhat between cycles.
Selection is deliberation; validation is a stress test
Consistent with prior years, the active buying process still comprises two phases: Selection and Validation. In the Selection Phase the group deliberates the differences its members brought to the cycle and answers two questions: is this category worth the investment, and can the group agree on a preferred vendor? Buying groups find aligning on category value as difficult as, or slightly more difficult than, selecting a vendor within it (56%). For buying processes that failed, finance buying group members report that justifying the category is substantially harder (74%) than selecting a vendor.
The mechanics of the journey remain remarkably stable and buyer-controlled. Buyers first engage sellers roughly 59% of the way through an average 10.3-month cycle, after 91.4% have already ranked their shortlist; the pre-contact favorite ultimately wins 82% of the time. The Validation Phase is therefore almost entirely a stress test of a preliminary decision, not where most buying decisions occur.
When buying groups do switch after initial consensus, it's largely a matter of fit: their view of how well the solution fit their needs changed (41.3%), followed by price (17%) and security/compliance concerns (15%). Less than 2% say the switch occurred because a buying-group member changed position after seller contact, suggesting that vendor switches are far more often driven by solution-related considerations than by shifts in stakeholder support.
LLMs have not displaced established sources of influence
This year we took a deeper dive into how buyers are influenced between and within buying journeys. The most surprising finding: buyers do not rate LLMs as particularly influential, either before or during buying journeys. Between journeys, buyers are still largely influenced by pre-LLM sources — vendor websites, analysts, and peer networks. They've simply added a new source to consult along the way.
During the Selection Phase, before buyers speak with sellers, buyers cite their own knowledge and conversations with teammates as the most influential sources. While most buyers use LLMs (81%), just 17% to 21% cite them as an influential source of information during their decision process. Taken together, these experiences still show that buyers are individuals who live inside complex, interwoven networks of influence — many of them other trusted humans, plus the information sources they've come to depend on over the past two decades.
LLMs and agents have not yet truly "revolutionized" B2B research and vendor selection, despite the hype and despite the fact that most buyers use them. That conclusion should not be confused with buyers' expectations for AI inside the solutions they purchase: AI capabilities featured in 80% of purchases, and embedded AI was strongly encouraged or mandated in 58% of evaluations. The distinction is between AI as a product requirement, now mainstream, and LLMs as an independent source of vendor influence, which remains secondary. When buyers already know the categories and vendors, discovery isn't the important part of the journey — most of it is spent collecting information to deliberate, justify, and validate existing preferences.
Buyers control when they become visible to sellers
Buyers control not only when they speak with sellers, but also when sellers can identify them. Only 35.2% used their own contact information when completing a form, and the buyer’s team initiated 82% of first vendor contacts. Lead-based models therefore mistake observable activity for the beginning of the journey: by the time buyers identify themselves, most consequential work has already occurred. Moreover, most form-fillers use fake or substitute contact information, which invalidates the lead before it ever reaches a seller.
Positive motivations produce more successful journeys
Buying journeys are largely spurred by internal needs and perceived possibilities for a function or company. Journeys that result in purchases tend to have more positive motivations (grow vs. avoid shrinking) than journeys that fail.
Most no-decision outcomes are pauses, not endings
The new analysis of stalled and abandoned evaluations changes how no-decision outcomes should be understood. These journeys aren't simply larger, more expensive, or more complex than successful purchases; they're more often marked by weaker category experience, reactive triggers, and greater difficulty justifying the category. Nor are most of them dead: 78% of buyers expect to revisit the purchase within 12 months.
Table of Contents
Implications for Go-To-Market Teams
Four years of research point to one primary implication: the standard B2B revenue operating model is increasingly misaligned with how buying actually happens. That misalignment has widened for nearly two decades as buyers have become less reliant on sellers while revenue teams have continued to organize around the moments when buyers become visible.
The need for ICP visibility
To succeed, revenue teams need a line of sight into every potential opportunity within their ideal customer profile (ICP) segments. Buyers stay current on solution categories between evaluation cycles, so teams must be able to see and influence accounts that are not currently in market. But those accounts should not all receive the same treatment. Investment should reflect each account’s realistic near- and long-term revenue potential. That requires teams to segment buyers by journey status and execute the right treatment for each account. Across an entire ICP and all relevant personas, that level of differentiated orchestration would be impossible without agentic capabilities.
Revenue teams should manage category reputation as a continuous operating discipline, not a campaign activated when accounts enter market. Because buyers remain attentive between cycles and carry evolving vendor perceptions into the next evaluation, brand, content, customer advocacy, analyst relations, communities, events, and seller interactions are all part of the same long-horizon preference-building system. The practical objective is not merely to create awareness, but to enter Day 1 of the next buying cycle already understood, trusted, and preferred.
Buying journeys begin with discovery? Not so much
The research shows the buying journey is more about buying group members deliberating over category and vendor value than about discovering new vendors and objectively evaluating new information. That elevates the importance of identifying key buying-group members — particularly supporting roles — and delivering messaging that helps align the group behind a solution throughout the journey, and even before it begins. Developing and executing marketing programs that use buying-group and buying-journey intelligence needs to be a top priority, not a nice-to-have layered on top of demand generation as it exists today.
Because most buying groups begin with inherited disagreement (71% enter the buying process with two or more conflicting vendor preferences), providers should design for consensus rather than assume a single champion can carry the decision. That means mapping the likely prior beliefs, objections, success criteria, and risk concerns of each major supporting function, then making supporting materials available (findable, ungated, shareable) to support group deliberation. The aim is not to manufacture unanimity; it is to reduce the cost of reaching a defensible collective decision.
Solution type influences buying group composition
Buying group orchestration should be category-specific, not built from a universal committee template. Software providers should anticipate unusually heavy IT involvement; physical-goods providers should design more explicitly for procurement; and most providers should expect finance to be a central supporting function. Persona strategy should therefore begin with the likely functional topology of the purchase, then adapt messaging, proof, and engagement sequences to the scrutiny each function applies.
Buying and LLMs: not talking about a revolution
Industry commentary often treats LLM discoverability as the new center of B2B buying. Our data show otherwise. Buyers have not shifted solution discovery and research almost entirely to LLMs, nor have they abandoned traditional sources. Yet that belief has already led parts of the industry to question the value—and even the continued existence—of intent data. Buyers in our research still consult the sources they have always used. They visit vendor websites in categories that matter to them. They consult third-party sources directly. And they do both within and between evaluation cycles.
Most solution categories—and many of the vendors within them—were discovered long before the current buying journey began. Even when buyers enter an unfamiliar category, they are most likely to encounter it gradually through colleagues, peer networks, conferences, and other professional channels. LLMs do introduce buyers to new vendors, but only 26% report using them for that purpose. That is an important development. It is not a revolution in B2B buying.
Once buyers engage sellers, the seller’s first job must be to identify where they stand on the shortlist, and to surface the assumptions behind the preliminary ordering of that shortlist. For brands in the pole position, the job is to help the buying group validate their decision criteria and preliminary choice. Buying groups often put a vendor in first place conditionally — provided, say, that it comes down in price to match the second-place vendor.
Trailing brands must understand the buying group’s decision criteria, gauge solution fit, and identify where the group’s view of vendor strengths and weaknesses can still change. By first seller contact, buyers have largely or entirely established their decision criteria (85%), so sellers are unlikely to change how the group will decide. Their job is instead to show how their solution best satisfies the requirements buyers have already set. Generic discovery performed after requirements are established risks forcing buyers backward; rigorous validation helps them move forward.
The new/old job for B2B websites
B2B websites should always have done more than declare the superiority of the company’s solutions. And now that buyers can read summarized information in LLMs, websites cannot be mere information repositories either. Buyer attention while on vendor websites is almost certainly more fragile than ever, and tolerance for unhelpful hyperbole and marketing speak will likely keep declining. B2B companies need to provide experiences that are genuinely interesting and valuable to potential buyers. That information needs to serve not just the primary buyer persona but also key supporting personas: the purchasing, IT, and finance representatives.
Two category-level scenarios shape buying journeys
Buyers either already have the category of solution on offer, or they do not. That simple distinction has a profound impact on how the buying group decides. New-capability journeys often require stronger support for why the organization should invest, broader stakeholder alignment, and longer planning horizons. Importantly, even when a solution is a new capability for a company, it is a mistake to assume that the buying group members are blank slates with respect to that category. They often bring substantial category and vendor experience from prior roles and organizations, even when their current company does not own the capability. What changes is the burden of justification.
The second dimension is the maturity of the solution category itself. Buying-group members are typically highly experienced with Established and Maturing solutions, having bought and used them repeatedly across multiple roles. But familiarity does not guarantee that the group will approve another investment in the category; buyers must still justify its value in the current company. Emerging and First-of-its-Kind categories carry a different burden. Providers must give buyers comparison frames that show how the new category addresses a meaningful business need and how its benefits and costs compare with current or adjacent solutions.
Accentuate the positive reasons for acquiring your solution
Journeys motivated by growth, scaling, and capability expansion succeed more often than journeys triggered by contract pressure, leadership change, dissatisfaction with a current vendor, or market shocks. The triggers are not psychologically equivalent: buyers pursuing an opportunity may be more willing to work through journey friction than buyers reacting to a threat. Our survey of B2B home pages suggests that most providers already emphasize the benefits of acquiring and using their solutions. Even so, providers whose solutions can credibly support both positive and defensive motivations may benefit from biasing their positioning toward growth and adaptation.
Optimism and anxiety do not buy the same way. Revenue teams therefore need two distinct persuasion systems: one that helps the buying group justify the category, and another that helps it choose the provider. Category justification requires quantified business outcomes, change rationale, implementation confidence, and materials that finance and executive stakeholders can use internally. Vendor preference requires differentiated fit, proof, and confidence that the provider can deliver. Treating those as one message leaves the harder decision — whether to invest at all — under-supported.
Double-jeopardy for services providers
Services providers need a distinct GTM design because they face a double burden: buyers are less likely to have prior purchase experience with the roster of contenders, and they find the categories harder to justify. Services marketing therefore must make an intangible offer concrete through diagnostic frameworks, outcome evidence, delivery-method transparency, practitioner credibility, and references that reduce perceived execution risk. Competing only on firm differentiation leaves the category-value problem unsolved.
The extended buying group
The buying group extends beyond the formal W2 group, so influence strategy must extend beyond direct buyer engagement. Analysts, consultants, investors, resellers, distributors, and systems integrators can alter confidence and momentum even when the transaction remains direct. Analyst relations teams tend to focus on point-in-time events like the publication of Waves and Quadrants, while devoting little effort to understanding how analysts talk with their clients about solutions and categories day to day.
Revenue teams should identify which outside actors commonly enter their category's evaluations, read their blogs, LinkedIn posts, and other pronouncements, to understand what they value and how they advise their audiences.
Buying journey attrition is easily the biggest opportunity
The largest revenue opportunity in this study is also one of the most obvious: most buying journeys that begin in earnest—even those that run for months or quarters—still end without a purchase. At any given time, roughly a third of an ICP is in the Selection Phase, but only 6% continue into Validation (see, Nuancing the 95/5 Rule). Attrition, not competitive loss late in the journey, is therefore the largest revenue blocker in B2B. Some buyers default to continuation or renewal, which still produces a sale for the incumbent. But retaining the existing solution often means the incumbent failed to win an upgrade or expansion. Buyers say agreeing on the value of the category is as hard as, or harder than, choosing a vendor within it. Yet most marketing organizations concentrate on winning share among buyers who have already justified the category. Revenue teams can identify what buying groups struggle to justify and use that intelligence to prevent attrition. Our analysis of stalled and abandoned evaluations sharpens the point: failed journeys are not meaningfully larger, more expensive, or more complex versions of successful ones. They begin from different motivations and are more often propelled by reactive pressure and external disruption than by business opportunities.
Paused evaluations should enter a structured recycle motion rather than a generic nurture stream. Because returning groups expect budgets, stakeholders, requirements, external resources, and vendor sets to change, teams should preserve the original buying-group context, monitor for those specific changes, and re-enter with materials tailored to what blocked the first attempt. The second cycle is not a repeat of the first; it is a revised decision system with new boundary conditions. Buying group members are usually experienced with the category and the brand; paused buyers certainly are, and should be treated accordingly. Successful providers will find and, where necessary, create new content and experiences to help the buying group seal the deal next time around.
New customers are won only after many tries
Successful purchasers are typically not on their first attempt to buy that solution for their organization (8.9 prior category evaluations); failed purchases tend to have fewer prior attempts (6.8% prior category evaluations). This suggests that B2B organizations selling into net-new accounts should build that reality into their revenue plans. As we know at 6sense, sales to new customers rarely happen on the first try — this may be one of the most important, underappreciated facts in B2B. By way of corollary, most failed buying journeys aren't really dead; they're paused, and they're likely to return with different budgets, stakeholders, requirements, and sometimes vendors.
Navigating the research
The report begins with a summary of the findings and their implications. The sections that follow present the evidence and analysis behind those conclusions.
Below, the findings section is organized around two central aspects of buyer reality: Buyer Psychology and Journey Mechanics.
Buyer Psychology examines buyers’ state of mind as they enter and move through buying decisions — past experience, trust, caution, motivation, and preferences. Journey Mechanics then focuses on how those factors materialize in buying behavior, from shortlist formation and requirements-setting through validation, external influence, and attrition. Together, the two perspectives form a useful frame: Buyer Psychology is what buyers bring into the journey, and therefore what revenue teams must account for when planning GTM strategy; Journey Mechanics is how that plays out in practice, with clear implications for how GTM teams architect buyer identification, engagement, and conversion.
The distinction isn’t always clean, and some topics touch both sections. Where that happens, we cross-reference. This report highlights the findings we believe are most important for understanding modern B2B buying behavior; it doesn’t cover every result from this year’s research. Throughout, we point to deeper, topic-specific analyses for readers who want to go further on a given finding.
Buyer Psychology
The conventional wisdom holds that B2B buyers crawl "under a rock" between purchases, surfacing only when a new need forces their hand. When they do surface, the thinking goes, they spend weeks or months discovering vendors and educating themselves on available solutions. The latest version of that common wisdom holds that when buyers do begin searching, they do it mostly by asking a chatbot, to the exclusion of more traditional sources.
The conventional wisdom is deeply flawed.
The evidence points to a different starting point: buyers enter most journeys as experienced category participants, carrying accumulated beliefs, vendor memories, and inherited preferences with them. They will deliberate with colleagues about whether the category is justified for their business; if it clears finance, IT, and purchasing scrutiny, the group must still agree on which of the highly familiar vendors will win.
The average buyer is a seasoned mid-career professional
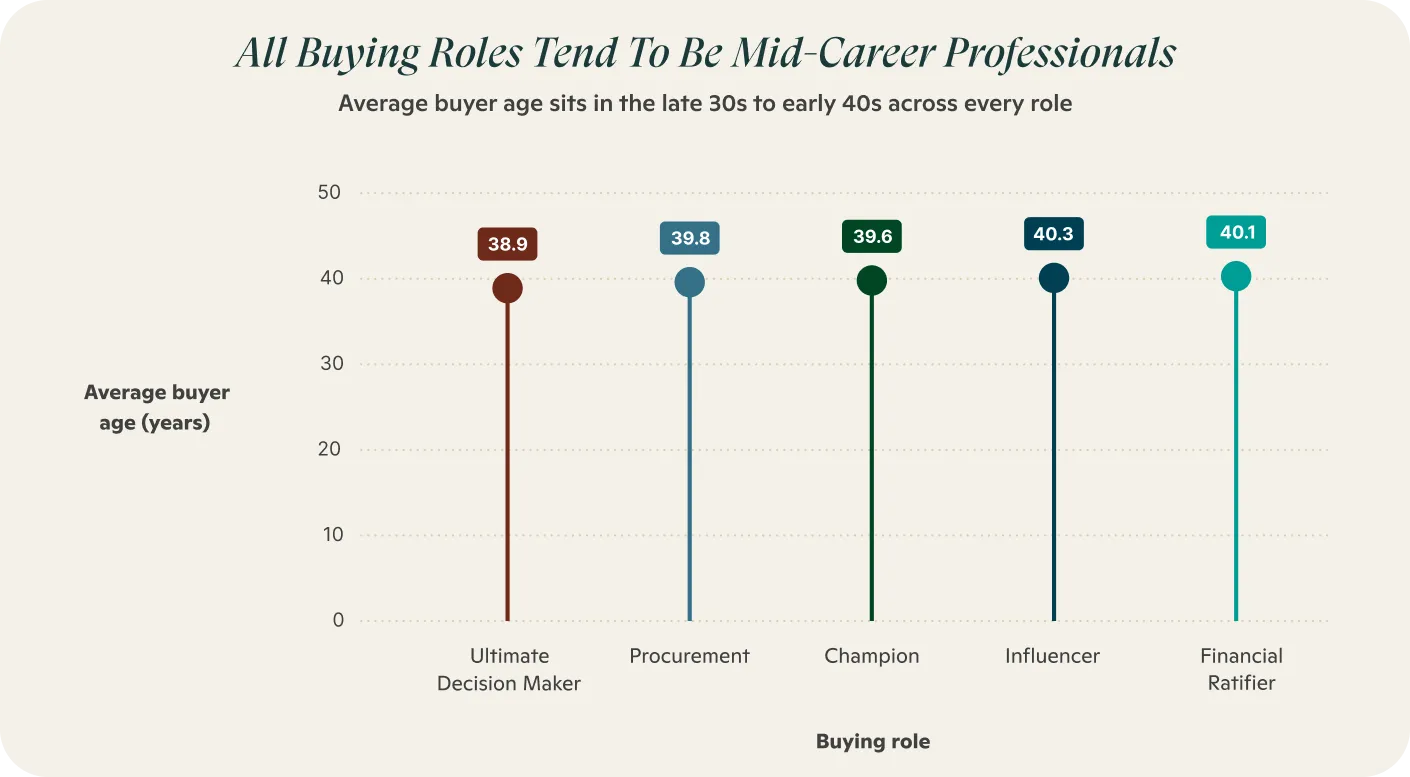
Buyers in all buying roles are deeply experienced. Buying-group members average roughly 40 years of age in every buying role — mid-career professionals who are not encountering business categories, vendor claims, buying processes, or internal decision dynamics for the first time. They enter buying journeys with prior knowledge, established beliefs, and previous experience already shaping how they evaluate options.
Buyers are navigating familiar terrain
One of our most important findings over the past two years is that B2B buyers are highly experienced in most categories: 85%+ of purchases occur in Established or Maturing categories, and every buying-group role brings meaningful experience to the categories it evaluates. Most vendors these buyers evaluate have also been around for a decade or more — even in software, the most volatile segment, roughly 90% of companies are at least 10 years old, and 64% are more than 15.
| Company age | Manufacturing Top 500 (est.) | Services Top 500 (est.) | G2 Top Vendors (unique companies) |
|---|---|---|---|
| 0–5 years | 0.0% | 0.1% | 1.6% |
| 6–10 years | 0.4% | 0.4% | 7.0% |
| 11–15 years | 1.0% | 1.7% | 27.3% |
| 15+ years | 98.6% | 97.8% | 64.1% |
For most buyers, the category is familiar terrain they have navigated for years. They re-enter it with prior beliefs, vendor impressions, and evaluation habits already formed. Familiarity does not mean that every vendor is equally well known, that the decision is easy, or that buyers can automatically justify the category for their current organization. It does mean that most journeys begin with memory and existing perception—not with Google or ChatGPT. The data bear that out.

Category familiarity creates continuous attention
Since first asking the question two years ago, we’ve understood that buyers enter the buying process with a pre-determined shortlist — which implies they stay current on the category between cycles. This year we validated that directly: 96% of buyers said they keep up with their category between evaluations, and the channels they rely on most are traditional and largely vendor-controlled.
| Channel | Buyers Using Channel (%) Between Evaluations |
|---|---|
| Vendor websites | 35.9% |
| Industry events and conferences | 33.4% |
| Product review sites | 31.4% |
| Industry publications or media | 31.3% |
| Informal conversations with sellers | 24.1% |
| Social media | 23.9% |
| Peer recommendations | 23.8% |
| Analyst firms | 22.9% |
| Podcasts | 19.7% |
| Vendor communities | 18.7% |
| Large language models | 15.0% |
That ranking cuts against much current thinking about AI and buyer behavior. Buyers are not disengaging from relevant categories between cycles; they are paying attention continuously through many of the same channels they have relied on for years. LLMs are the least-cited source of new information, not the default one.
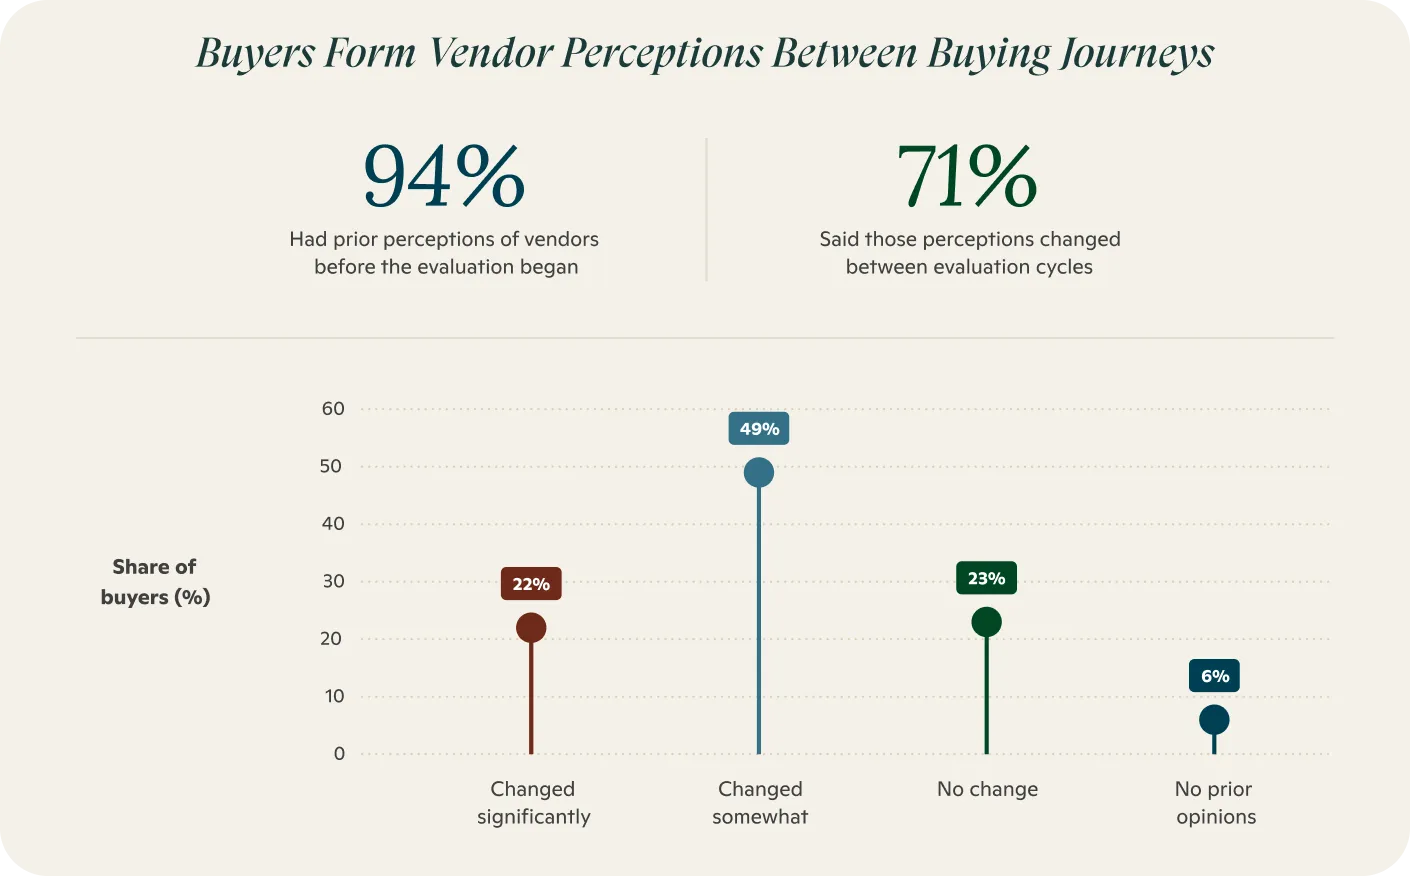
Continuous attention changes the starting conditions of the next evaluation. Between cycles, 71.5% of participants said their view of vendors changed somewhat or significantly, and 94% entered the current cycle with pre-existing vendor perceptions. The context makes those numbers unsurprising: most solution categories have existed for a decade or more, most buying-group members have been working for nearly two decades, and likely participants in future buying journeys already monitor the category. Their evolving perceptions become Day 1 opinions in the next cycle.
Buying groups begin with inherited disagreement
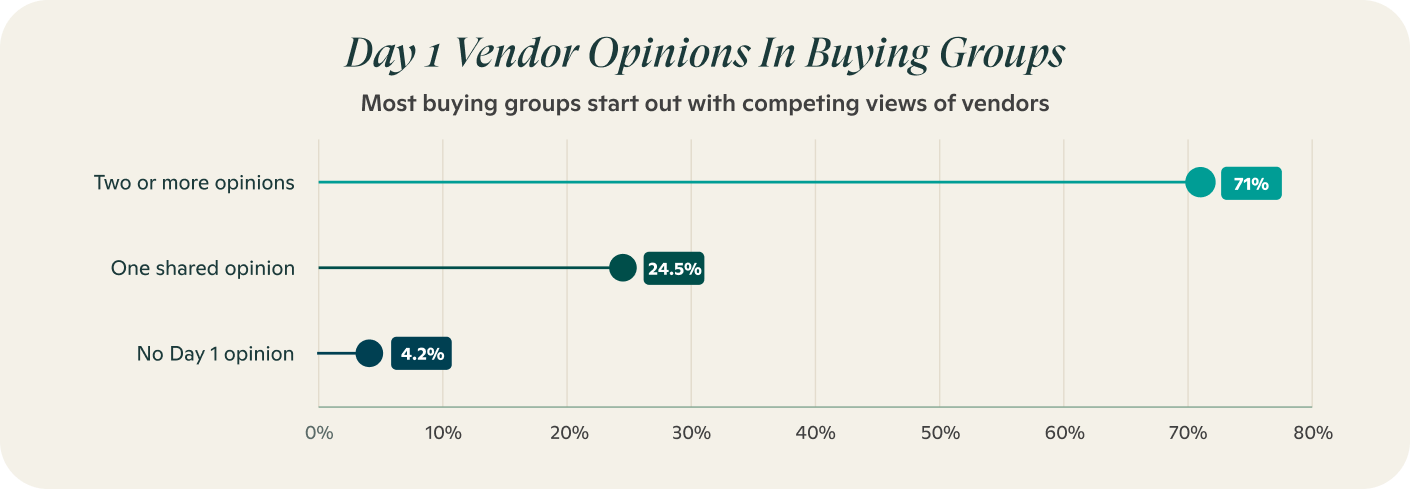
Buying groups rarely begin an evaluation from a neutral state. They average 10 members, and in 71% of journeys the group enters with preferences for two or more vendors already represented among its members. Another 24.5% begin aligned around a single vendor. Only 4.2% begin with no vendor preference represented across the group. The implication: the buying journey is rarely a process of discovery and is instead a process of deliberation among informed, opinionated professionals. The question isn't whether the group can discover vendors — it's whether the group can resolve the experiences, beliefs, loyalties, doubts, and assumptions its members already brought with them.
The category familiarity paradox: familiar does not mean easy to justify
Buyers know the terrain, but the group still has to agree it is worth crossing
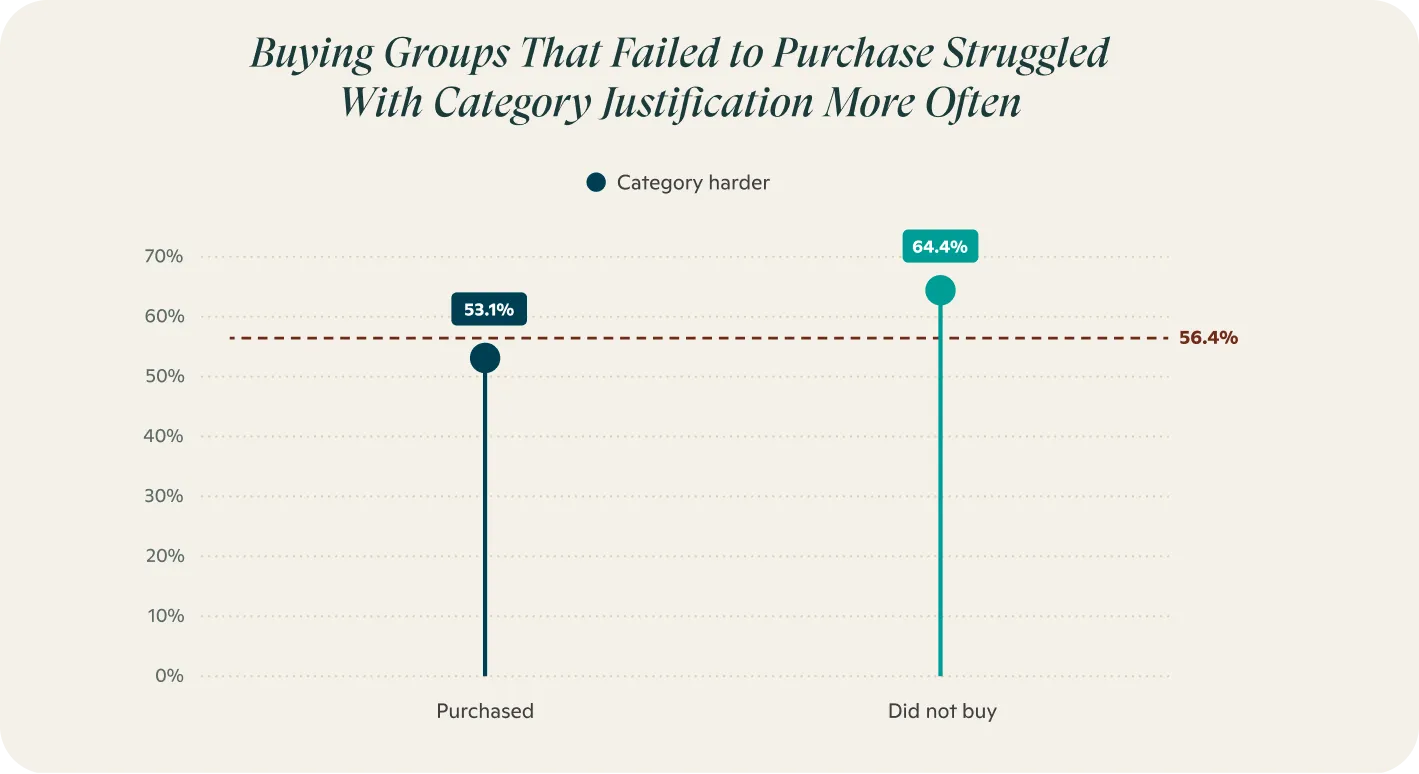
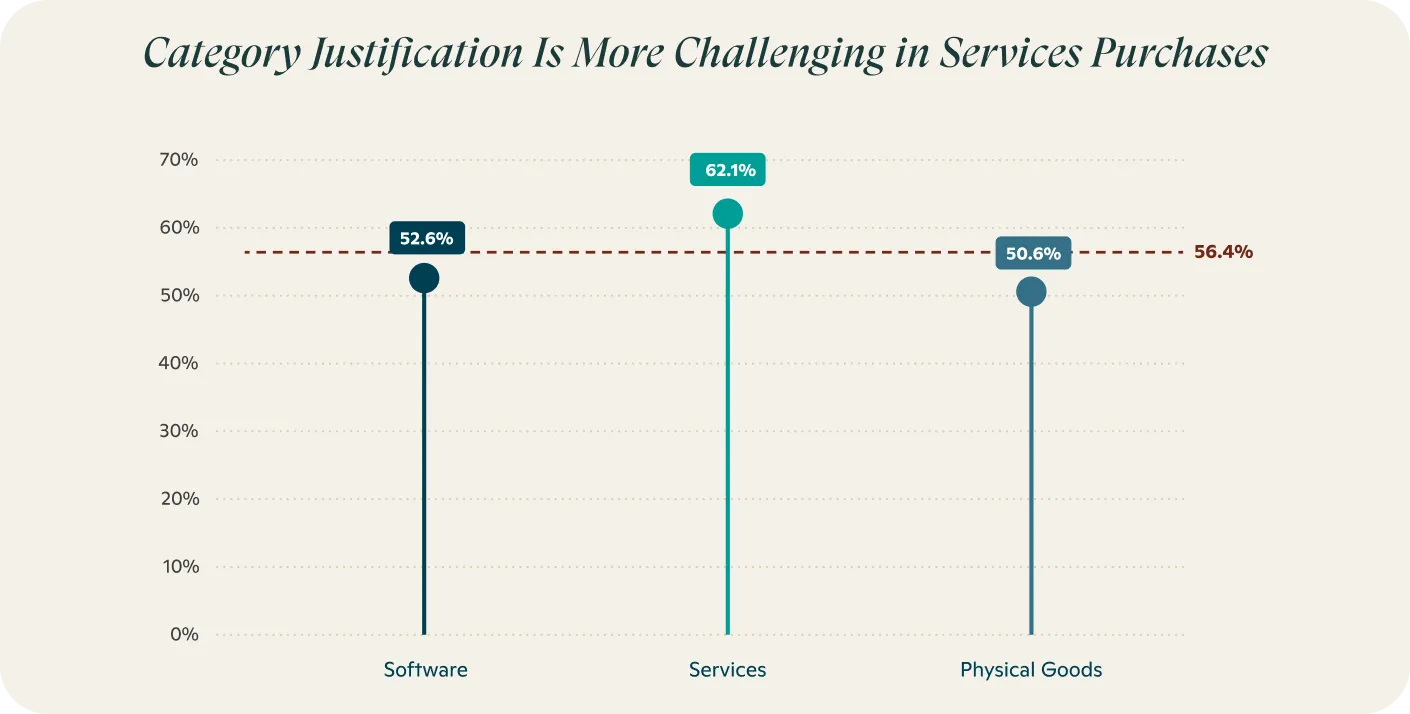
Familiarity with solution categories and vendors may not breed contempt, but it certainly doesn’t breed alignment. Category familiarity doesn’t mean all buying-group members agree the category is worthy of investment — a department head may have had numerous positive experiences with a category while a finance colleague believes the category itself is flawed. In many buying journeys, the hard question isn’t which vendor should win, but whether the category deserves investment at all: 56.4% of buyers say agreeing on the category, not the vendor, was harder, and that difficulty is more pronounced in failed journeys and in services deals.
New capabilities to the company are not necessarily new to the buying group
This paradox extends to how "new" a purchase really is. We asked buyers two related questions: whether the purchase was meant to provide a new capability to the organization, and how they'd categorize the solution category itself — Established, Maturing, Emerging, or First of its Kind.
| Capability type | Established | Maturing | Emerging | First of its kind |
|---|---|---|---|---|
| New capability | 48.8% | 34.9% | 12.5% | 3.8% |
| Existing capability | 60.1% | 29.9% | 8.4% | 1.6% |
A purchase can be new to the organization without being new to the people evaluating it. When buyers said a purchase would add a new capability, nearly half still classified the category as Established and another third as Maturing; only a small minority called it Emerging or First of its Kind. Buyers considering new capabilities also reported the same number of prior category evaluations (8.5) as buyers replacing an existing capability. They may therefore be solving a new problem for the current company inside a category they already know and hold opinions about. Prior experience elsewhere informs the evaluation, but it does not eliminate the need to justify the category formally in the present organization.
The decision not to buy is more likely in less mature categories
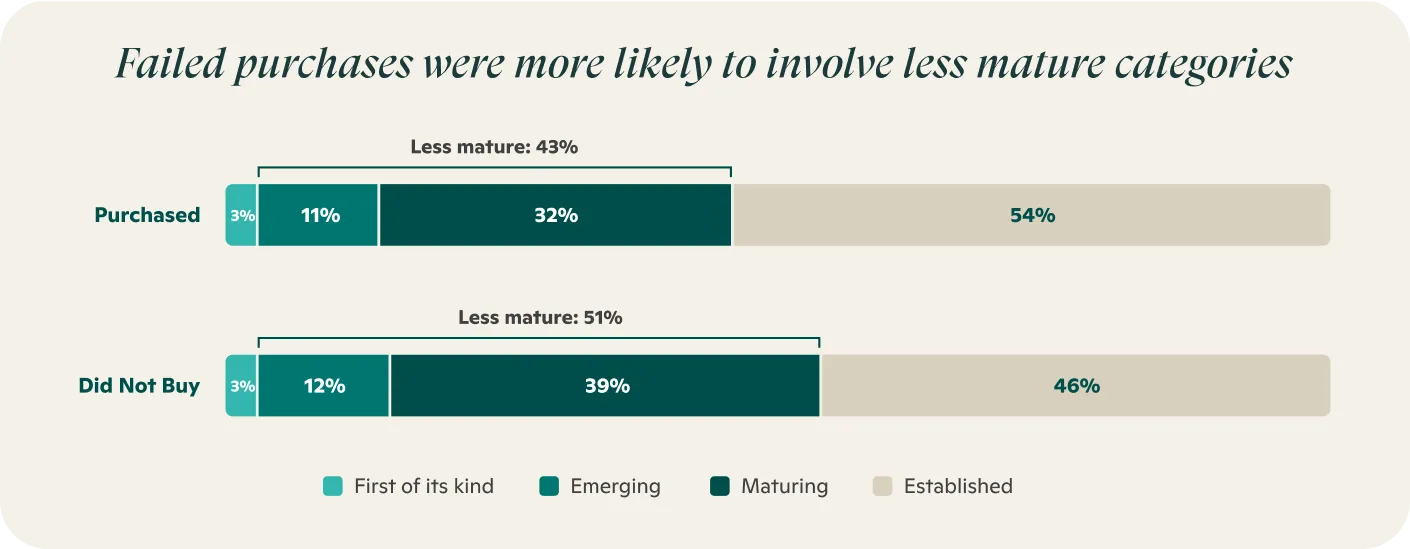
Failed purchases in our research were more likely to involve less mature categories (50.8%) than completed purchases (43.1%). Providers in less mature categories cannot succeed merely by showing that they are the best vendor in the category. They must also give buying groups the evidence and language needed to justify the category itself.
Evaluation triggers
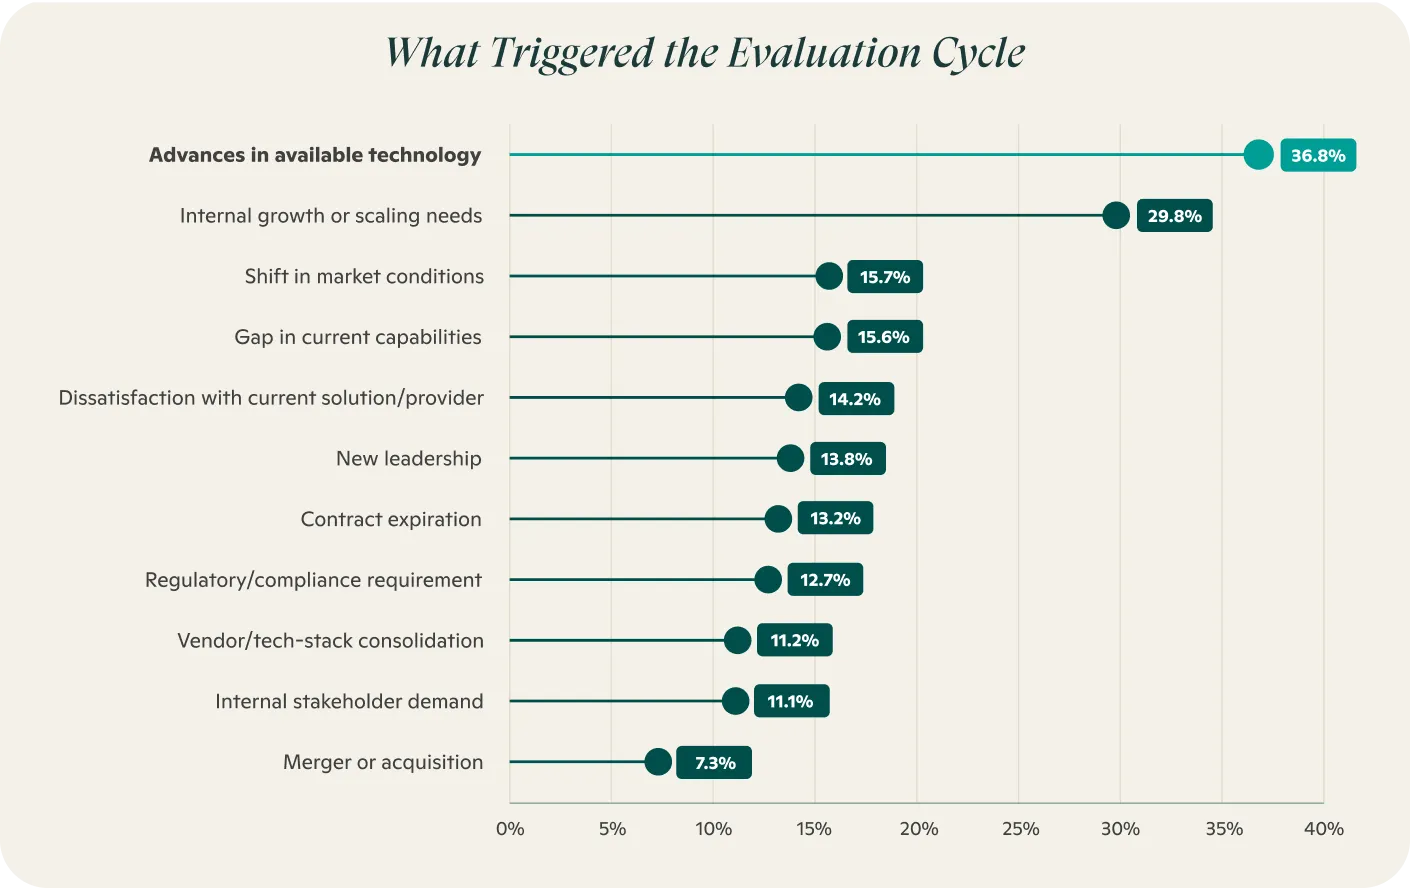
Evaluation triggers capture the circumstances that set a buying journey in motion. New this year, we asked buyers what triggered their journey, allowing them to select their top two triggers from a fixed list.
Technology advances and growth needs drive most buying journeys
Taking advantage of advances in what's possible, together with accounting for business growth, are far and away the most common reasons buyers enter a journey; other triggers are roughly half as common. Event-based triggers such as new leadership or M&A activity are themselves rare. When they occur they may strongly spur a buying cycle, but as a share of all journeys started they remain modest.
Positive motivations appear more often in successful purchases
This year, 62% of buyers said they were primarily motivated to pursue a benefit, 20% balanced benefit and risk avoidance, and 18% were primarily avoiding a negative outcome. Successful journeys are more often driven by the pursuit of benefits, while stalled or abandoned evaluations skew more reactive (see table below).
| Purchase motivation | Purchased | Stalled or abandoned |
|---|---|---|
| Pursue benefits | 64% | 55% |
| Balanced | 19% | 23% |
| Avoid negative outcomes | 17% | 22% |
Because benefit-seeking motivations appear more often in successful purchases, B2B providers may benefit from positioning solutions as tools for growth and adaptation rather than primarily as protection against risk.
The impact of embedded AI and economic uncertainty on buyer mentality
Economic uncertainty is shifting from urgency to constraint
Economic uncertainty is shaping buying cycles differently than it did last year. In 2025, it mostly created urgency: 61% of buyers said uncertainty moved seller engagement earlier, and shortened cycles outnumbered lengthened cycles by nearly two to one. In 2026, that effect weakened. Only 51% reported earlier engagement, and fewer buyers reported that it shortened their cycles. Uncertainty now appears to be changing how buyers decide more than when they engage: 73% became more price-conscious, and 61% became more conservative in their vendor choice.
Buyers expect AI inside the solutions they evaluate
Embedded AI remains a major evaluation factor, though it eased slightly: 80% of purchases involved AI capabilities (down from 89% last year), and embedded AI was strongly encouraged (37%) or mandated (21%) in most evaluations — increasingly a form of productivity insurance under uncertainty.
AI expectations moderate the role of economic uncertainty
The desire for embedded AI also interacts with economic pressure: 43% of buyers expecting significant AI in the solution said the economy shortened their cycle, more than 50% higher than the rate among buyers expecting limited AI functionality (28.1%) — a sign that AI-driven productivity or cost relief is itself an urgency lever.
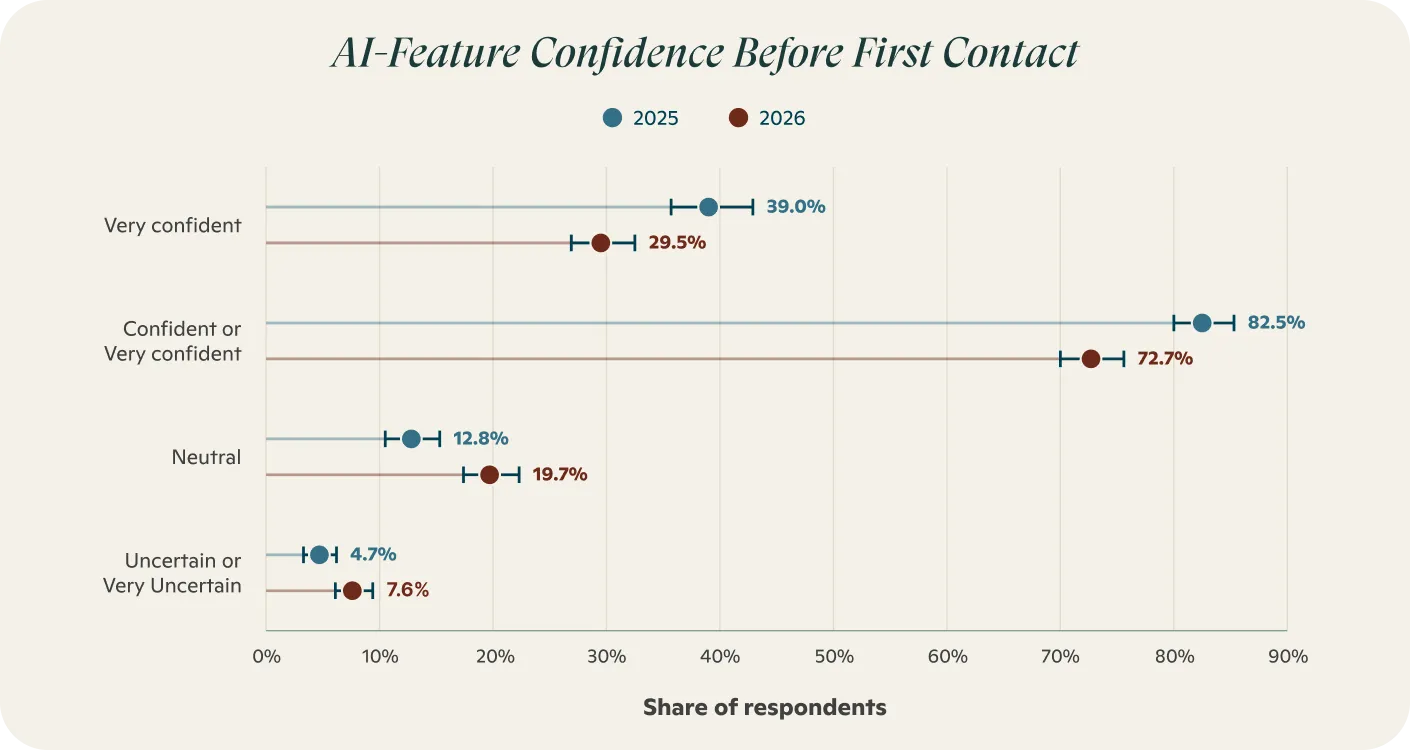
Buyers are less confident that they know how AI is being deployed in solutions
Buyers have also grown less confident, not more, that they understand how providers are actually deploying AI inside their solutions — a gap providers can close with clearer content.
Automation and prediction lead the list of desired AI use cases
The shape of buyer desire is shifting, too: buyers are notably less likely to be looking for process automation and content-creation capabilities than they were last year, though automation and predictive analytics remain the two most-wanted AI use cases by a clear margin, and these priorities are remarkably consistent across departments.
| Desired AI use case | 2025 | 2026 | Reliable difference? |
|---|---|---|---|
| Automation | 64% | 56% | Yes |
| Predictive analytics | 56% | 55% | No |
| Personalization | 47% | 43% | No |
| Chatbot | 48% | 45% | No |
| Content creation | 37% | 31% | Yes |
Journey Mechanics
Buyer Psychology explained what buying groups bring into an evaluation: experience, category memory, and pre-existing vendor preferences. Journey Mechanics shows what follows. Those prior beliefs compress discovery, move the central disagreement inside the buying group, and turn seller contact into validation of a decision already taking shape.
The buying journey is structurally stable but more front-loaded than previously understood. Buying groups still move through recognizable Selection and Validation phases. Buyers arrive with prior opinions, organize the shortlist, set requirements, and identify a likely winner before first contact with sellers. Year over year, these mechanics changed only subtly: groups stayed large, vendor sets stayed narrow, winners were usually known early, and first live seller contact still landed well past the midpoint of the journey.
The two-phase evaluation cycle
Formal buying journeys have two phases: Selection, before live buyer-seller contact, and Validation, after it. Sellers do not merely enter late; buyers keep them out until the group has completed most of the consequential work. Before first contact, buyers form the shortlist, clarify requirements, rank vendors, and—in 91.4% of journeys—identify a preliminary winner. Vendor contact occurs, on average, 59.2% of the way through a 10.3-month cycle. That point has moved earlier over several years, but most of the journey remains seller-free. Even with earlier engagement this year, the preliminary favorite became more—not less—likely to win. Validation is therefore less a fresh competition than a stress test of a choice already taking shape.
| Selection Phase: before buyer-seller contact — 59% of the journey | ||
|---|---|---|
| Day 1 | Shortlist ordered | First contact |
| 92% Winner already on the Day 1 short list | 91% Buying groups put the shortlist in order of preference | 59% of the way through the evaluation when buyers first engage sellers |
| The buying journey does not begin at first contact. By the time buyers engage sellers, the group has usually formed a short list, clarified requirements, and often identified a favored vendor. The Validation Phase is therefore less a fresh competition than a stress test of a choice that has already been made. | ||
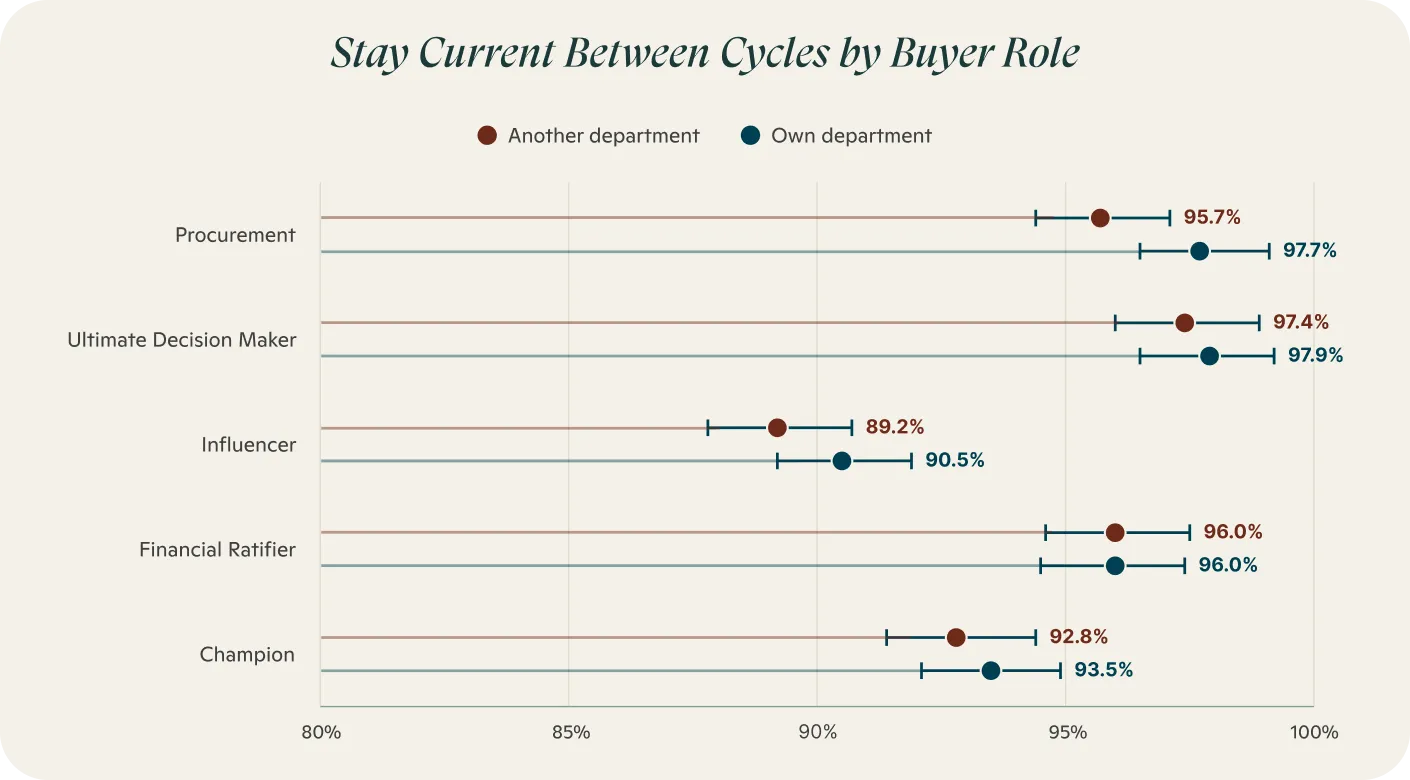
Buyers – in all buying roles – remain current in relevant categories at all times
That consistency holds across buying roles, too. As mentioned earlier, 96% of buyers stay current even between evaluation cycles — and that holds whether a buyer is considering a purchase for their own department or participating in a supporting role for someone else's. Viewed across every member of the buying group, between 90% and 98% stay current on relevant categories between cycles, and none of the modest differences we observe between roles are statistically reliable. In other words: whether a buying-group member is involved in a purchase for their own department or another's, they bring deep prior experience and stay informed between purchases either way.
Journey parameters
Buying roles produce nuanced but consistent perspectives
There is modest variation in how different buying roles experience the journey — influencers and financial ratifiers describe somewhat larger groups, longer cycles, and more difficulty justifying the category, while decision makers and procurement report slightly shorter, more contained journeys. But the core mechanics barely move: across roles, the winner is usually on the Day 1 shortlist, requirements are set before seller contact, first contact lands well past the midpoint, and the eventual winner is usually the first vendor contacted.
| Buying role | Category justification harder | Cycle length (months) | Buying group size | Point of first contact | Winner on Day-1 shortlist | Requirements set before contact | Winner contacted first |
|---|---|---|---|---|---|---|---|
| Overall | 56.4% | 10.3 | 10.2 | 59.2% | 91.7% | 84.8% | 76.6% |
| Ultimate decision maker | 55.5% | 9.8 | 9.6 | 59.2% | 92.7% | 85.6% | 76.6% |
| Procurement | 52.8% | 9.8 | 9.6 | 58.6% | 90.3% | 83.2% | 75.4% |
| Champion | 54.6% | 10.2 | 9.9 | 56.3% | 88.5% | 85.1% | 71.2% |
| Influencer | 64.0% | 12.4 | 12.7 | 62.7% | 92.5% | 84.2% | 83.3% |
| Financial ratifier | 59.5% | 11.3 | 11.3 | 60.5% | 93.4% | 84.3% | 79.5% |
New-capability journeys are meaningfully harder than replacement journeys
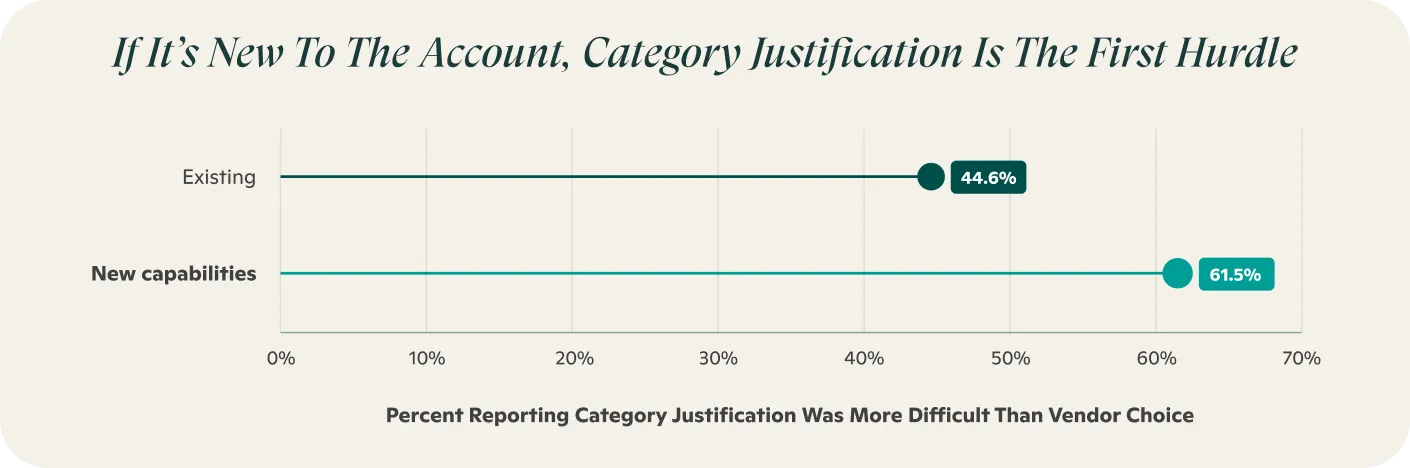
Buyers launch evaluations either to replace or upgrade existing capabilities, or to acquire new ones — and that starting point produces meaningfully different mechanics. New-capability journeys involve larger buying groups (10.9 vs. 8.4 members) and run longer (11.3 vs. 8.2 months). The largest gap is category justification: 61.5% of new-capability buyers say justifying the category was harder than choosing a vendor, compared with 44.6% of buyers replacing an existing capability. The eventual winner was also contacted first more often in new-capability journeys (79.2% vs. 70.2%).
| Capability type | Category justification harder | Cycle length | Buying group size | Point of first contact | Winner on Day-1 shortlist | Requirements set before contact | Winner contacted first |
|---|---|---|---|---|---|---|---|
| New capability | 61.5% | 11.3 months | 10.9 | 60.6% | 92.3% | 84.7% | 79.2% |
| Upgrade, renewal, or replacement | 44.6% | 8.2 months | 8.4 | 55.9% | 90.6% | 86.8% | 70.2% |
Buyers in stalled or abandoned evaluations stumble on requirements-setting and category justification
Buyers who did not end up purchasing cited category justification as a hurdle 11.3 points (roughly 21%) more often than those who did, and were 10 points less likely to have requirements set before engaging sellers — evidence these buying groups struggled to establish the value of the category itself, not just to pick a winner.
| Purchase outcome | Category justification harder | Requirements set before sales contact |
|---|---|---|
| Purchased | 53.1% | 86.7% |
| Did Not Buy | 64.4% | 76.7% |
Category maturity has only a weak effect on mechanics
Emerging and First-of-its-Kind categories follow the same broad journey mechanics as mature categories, but novelty adds friction in specific places: buyers evaluate more vendors, take longer, contact sellers late, and involve larger groups. One plausible explanation is that buyers have less established category memory to draw on and must search across adjacent categories for comparable offerings. Even so, the journey’s overall shape remains remarkably consistent across maturity levels. Corporate purchasing processes may impose a common structure that bends less for novelty than conventional wisdom suggests.
| Category maturity | % of purchases | Vendors evaluated | Cycle length (months) | Buying group size | Point of first contact | Winner contacted first |
|---|---|---|---|---|---|---|
| First of its kind | 3.2% | 5.6 | 12.7 | 12.3 | 68.9% | 82.5% |
| Emerging | 11.3% | 4.8 | 10.2 | 10.0 | 58.2% | 76.2% |
| Maturing | 33.5% | 5.1 | 11.0 | 10.7 | 59.3% | 74.4% |
| Established | 52.0% | 5.0 | 9.8 | 10.2 | 63.6% | 77.7% |
The Selection Phase is for ironing out buying-group differences
In the traditional view of a buying journey, buyers spend the early part of the journey identifying potential vendors, and only later develop requirements and form preferences. What we understand now is different: buying groups enter over 71% of journeys already holding two or more opinions about the best vendor. The Selection Phase ends — in 91.4% of journeys — when the group ranks its shortlist and moves to engage sellers; reaching that ranked consensus is effectively what ends Selection and begins Validation.
Vendor-aligned buying groups have harder, not easier, journeys
Counterintuitively, a shared Day 1 vendor preference does not make the journey easier. Groups that begin aligned on one vendor report greater difficulty justifying the category (60% versus 52% among groups with multiple Day 1 preferences), longer cycles (12 versus 10 months), and larger groups (12.2 versus 10.4 members). That pattern resists the usual explanations. Larger groups might be expected to contain more competing vendor preferences, and our prior research shows that group size and cycle length are most strongly associated with the number of vendors evaluated. Yet this sample showed no statistically reliable difference in vendors evaluated, deal size, or company size between the two groups.
The evidence cannot establish why aligned groups have harder journeys, but it is consistent with a plausible explanation: early agreement on a vendor does not resolve the separate—and often harder—question of whether the category deserves investment.
| Day 1 preference | Category justification harder | Cycle length | Buying group size | Point of first contact | Winner contacted first |
|---|---|---|---|---|---|
| Single preferred vendor | 60% | 12 months | 12.2 | 63.0% | 87.3% |
| Multiple Day 1 preferences | 52% | 10 months | 10.4 | 57.4% | 72.0% |
Buyers pick vendors they already know, and services deals face a double burden
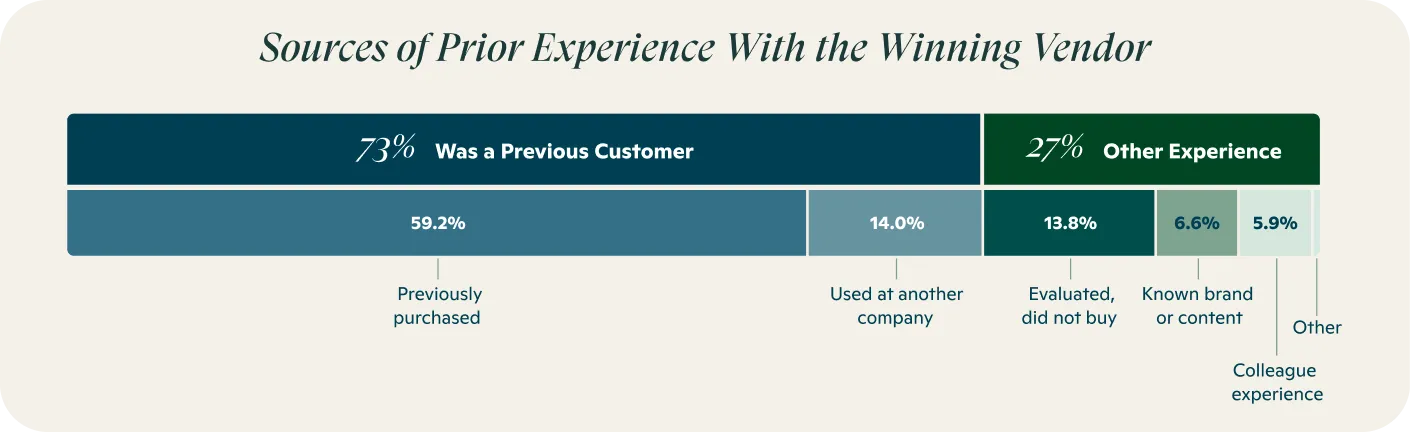
Buyers usually choose vendors they already know: in 73% of cases, prior experience with the eventual winner came from having bought it or from having used it at an organization that had purchased it, and 14% have evaluated it multiple times. Services providers face a double burden. Their buyers find category justification harder (62.1%) than software buyers (52.7%) or physical-goods buyers (50.6%), and they are less likely to have previously purchased from the eventual winner (53%, versus 60%–68% for software and physical goods). These hurdles may help explain why services represented 51.9% of stalled or abandoned evaluations but only 44.9% of completed purchases—a statistically reliable difference. Services providers face a heavier burden to establish both that the category deserves funding and that their firm is a credible choice within it.
Buyers evade sellers until they’re ready
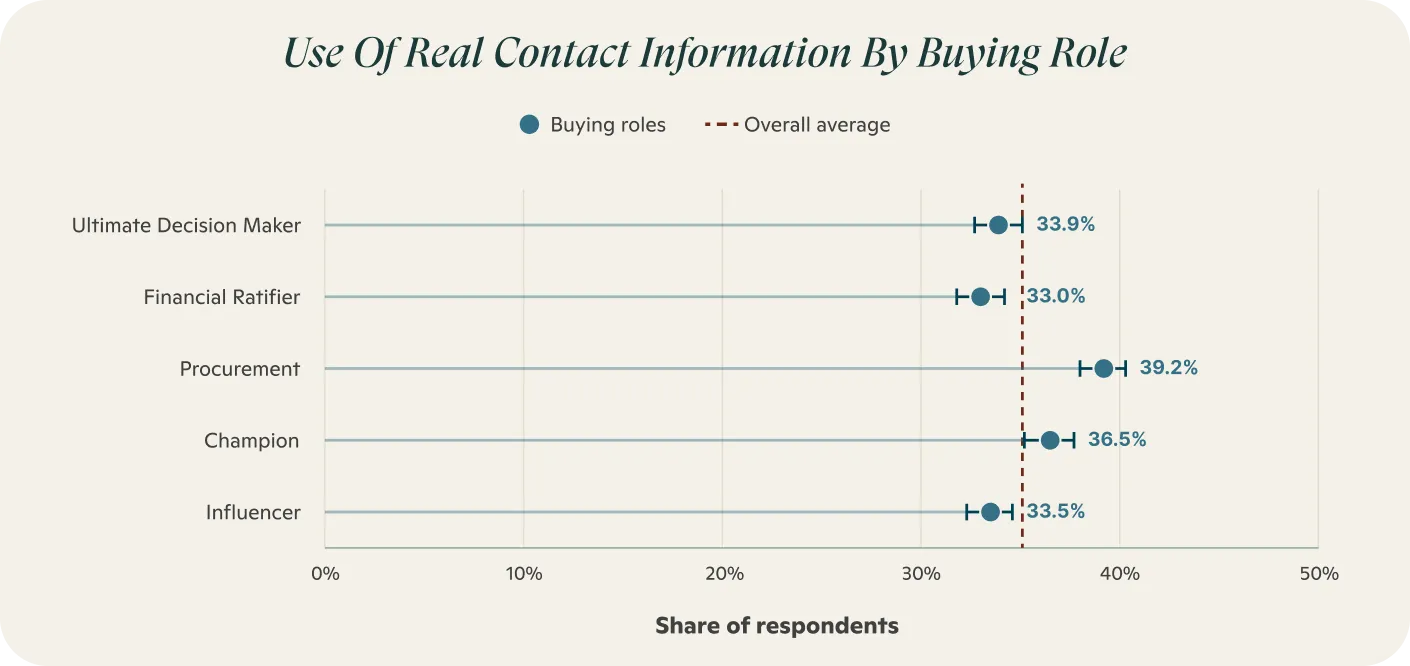
New this year, we asked buyers whether they took steps to disguise their identity from vendors as they progressed through the journey. Just 35.2% used their own contact information on a form, and the buyer's team, not the vendor, initiated 82% of first vendor contacts. Perhaps no other data points in this study more clearly illustrate why lead-based go-to-market practices fail to capture where buyers actually are in the journey.
| How buyers disguise their identity | Share of buyers |
|---|---|
| Team member filled out the form instead | 31.6% |
| Used a personal or secondary email | 19.3% |
| Used AI tools to avoid a form fill | 17.7% |
| Skipped gated content entirely | 7.4% |
| Used their own, real contact information | 35.2% |
Buyers have many influences, but keep their own counsel
Buyers draw on many sources, but their accumulated knowledge and internal deliberations dominate. During Selection, buyers rate existing knowledge as the strongest influence on vendor perception, followed by discussions inside the buying group; AI tools sit in the middle of the pack. Nearly every measured influence—except direct human contact with the provider—declines once Validation begins. The most plausible interpretation is not that those sources cease to matter, but that the group becomes less open to persuasion as its preference solidifies.
| Preference influence | Selection Phase | Validation Phase |
|---|---|---|
| Existing knowledge | 34.4% | 26.0% |
| Internal discussions | 31.8% | 29.4% |
| Analyst / consultant | 24.5% | 18.5% |
| Online review sites | 23.8% | 18.8% |
| AI tools or LLMs | 21.2% | 17.1% |
| Vendor web content | 21.2% | 14.6% |
| Sales-rep conversations | — | 23.3% |
Buying group composition & external influences
Buying journeys are group decisions, but the group extends beyond the formal buying committee. Internal functions bring different forms of scrutiny, risk tolerance, and category familiarity to the evaluation. External actors—including analysts, consultants, channel partners, and investors—can also shape confidence, timing, and commitment. The buying group is therefore better understood as a network of influence than as a fixed committee contained inside the organization.
Buying group composition
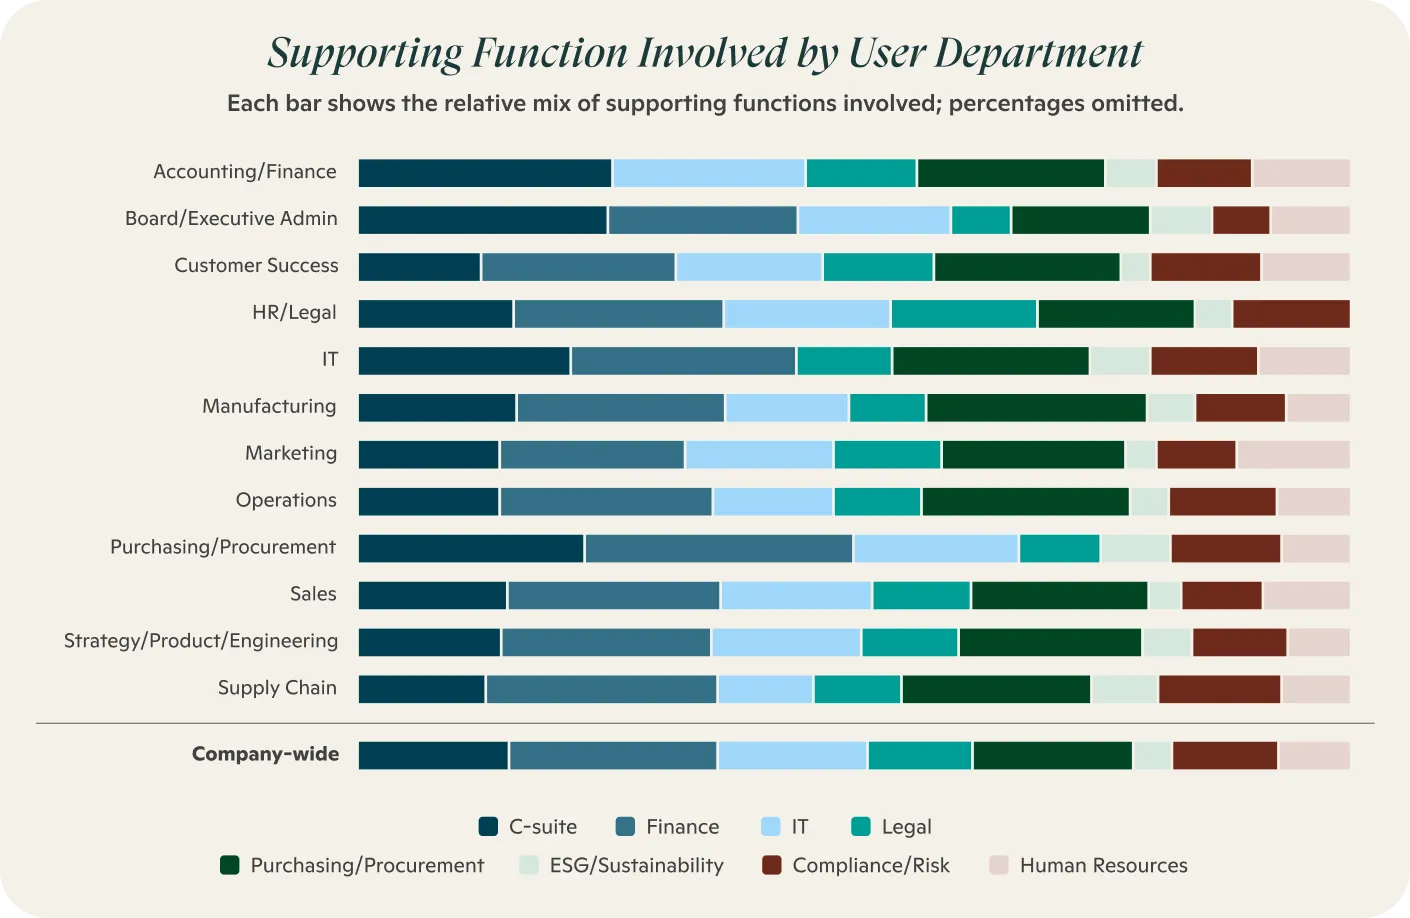
Buying groups span many organizational functions, and supporting functions often bring distinct perspectives to the evaluation. Group size has nevertheless remained steady year over year at roughly 10 people, contrary to the common claim that buying committees are continually expanding. Composition varies more than size: finance is the most frequently involved supporting function for nearly every user department, while other functions become more or less prominent depending on the solution and the department that will own it.
The type of solution influences which functions join the buying group
Solution type shapes which functions show up, too: physical-goods purchases lean more on procurement and less on the C-suite, while software purchases lean heavily on IT. IT shows up in roughly seven of ten software purchases, versus about four in ten purchases of physical goods or services — while physical-goods purchases lean hardest of the three on procurement.
| Department involved | Software | Services | Physical Goods |
|---|---|---|---|
| C-suite | 43.9% | 42.5% | 35.3% |
| Finance | 42.7% | 48.2% | 49.2% |
| Information Technology (IT) | 69.9% | 36.4% | 41.3% |
| Legal | 16.9% | 18.3% | 15.7% |
| Purchasing / Procurement | 38.1% | 33.9% | 48.3% |
| ESG / Sustainability | 8.6% | 8.3% | 9.2% |
| Compliance / Risk | 20.7% | 15.2% | 15.9% |
| Human Resources | 14.0% | 15.3% | 10.5% |
| None of these | 2.8% | 2.8% | 6.3% |
Nearly three-quarters of buyers involve an external party
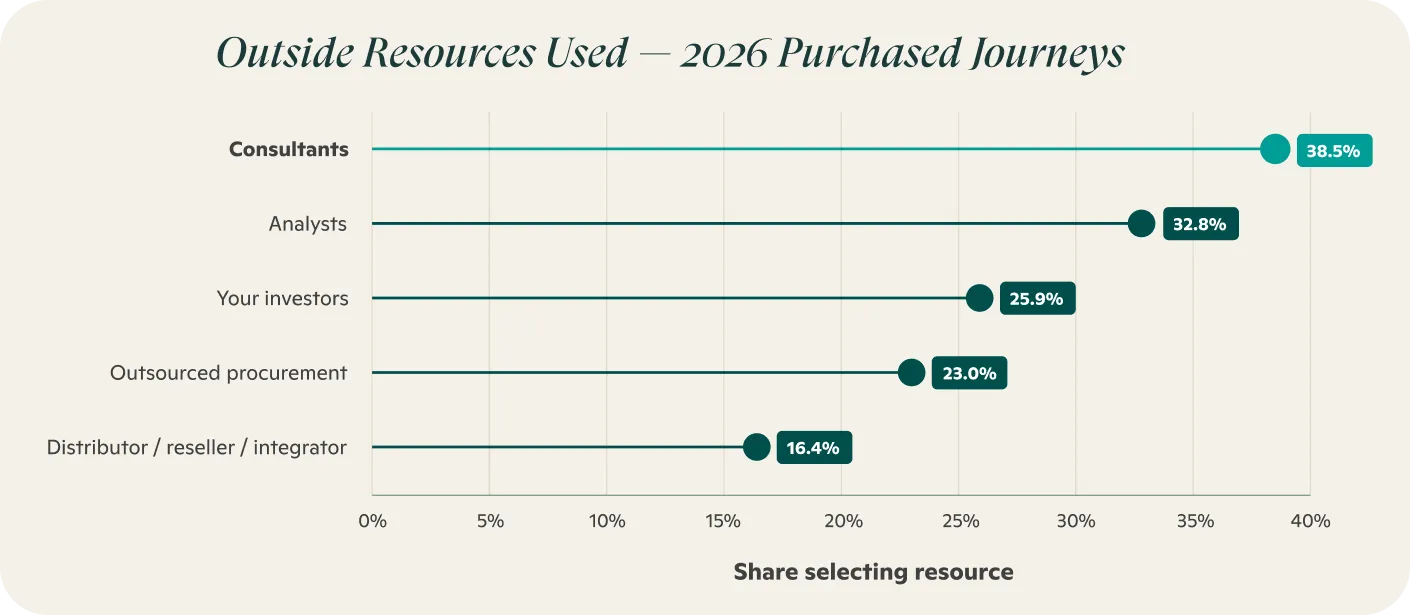
Nearly three-quarters of buyers (74%) engaged at least one external resource during their 2026 evaluation, down slightly from 76% in 2025. The largest declines involved investors, whose participation fell from 31% to 26%, and distributors, resellers, or integrators, whose participation fell from 24% to 16.4%. Analysts and consultants remained the most-used external resource. Their involvement also varied with outcome: 35% of buyers who purchased involved an analyst, compared with 28% of those who did not buy; investor involvement showed the reverse pattern, at 24% among purchasers and 31% among non-purchasers. These associations do not establish that outside actors caused the outcome, but they suggest that different external parties enter evaluations under different conditions.
Channel partners shape evaluations more than they own transactions
Channel partners shape evaluations more often than they own the final transaction. Among buyers who engaged distributors, resellers, or systems integrators, more than four in ten (41.5%) interacted with them as much as they interacted with vendors directly, and another 22% interacted with them more. Yet 80% still purchased directly from the vendor. Influence and transaction ownership are therefore separate roles: channel partners can materially shape the decision even when the vendor ultimately books the sale.
Journey Mechanics of evaluations that were stalled or abandoned
Stalled evaluations are not casual explorations that never became serious. They ran for 8.6 months on average—only slightly less than completed purchases—and buyers engaged directly with an average of 3.3 vendors, about 78% of those they considered. By the time these evaluations stopped, most of the field had received real engagement.
Completed and stalled journeys differ more in experience and motivation than in scale
The strongest differentiator is prior category experience: buyers with more category evaluations under their belts are more likely to complete the purchase. The next clearest signals are motivational — journeys triggered by an identified capability gap, internal growth need, or a regulatory/compliance requirement are more likely to reach a decision, while journeys triggered by contract expiration, dissatisfaction, new leadership, or market shifts are more likely to stall.
| Variable | Bought | Stalled/Abandoned | Reliable? |
|---|---|---|---|
| What differed reliably | |||
| Prior category purchases (total) | 8.90 | 6.78 | Yes, p<.0001 |
| Trigger: identified a capability gap | 19.4% | 6.5% | Yes, p<.0001 |
| Trigger: internal growth/scaling needs | 34.3% | 18.7% | Yes, p<.0001 |
| Number of triggers cited | 1.85 | 1.72 | Yes, p<.0001 |
| Vendors considered (total) | 5.03 | 4.30 | Yes, p<.0001 |
| Trigger: dissatisfaction with current solution | 11.2% | 21.7% | Yes, p<.0001 |
| Trigger: regulatory/compliance requirement | 15.2% | 6.3% | Yes, p<.0001 |
| Trigger: contract expiration | 10.7% | 19.1% | Yes, p<.0001 |
| Day-1 shortlist size (raw count) | 3.38 | 2.94 | Yes, p<.0001 |
| Shortlist ordered before contact | 92.6% | 86.5% | Yes, p<.0001 |
| Trigger: new leadership | 11.7% | 18.9% | Yes, p<.0001 |
| Purchase complexity | 0.04 | -0.11 | Yes, p<.0001 |
| Trigger: shift in market conditions | 13.8% | 20.5% | Yes, p<.0001 |
| Requirements-set (ordinal) | 1.69 | 1.86 | Yes, p<.0001 |
| Buying group size | 10.44 | 9.35 | Yes, p=.0002 |
| Trigger: advances in available technology | 38.7% | 32.2% | Yes, p=.002 |
| Prior experience rate with vendors | 68.5% | 65.7% | Yes, p=.029 |
| What did not differ reliably | |||
| % of vendors from Day-1 shortlist | 67.1% | 69.6% | No, p=.064 |
| Purchase cost (ordinal) | 4.93 | 4.69 | No, p=.136 |
| Trigger: merger or acquisition | 7.8% | 6.0% | No, p=.198 |
| Trigger: internal stakeholder demand | 11.3% | 10.7% | No, p=1.00 |
| Trigger: desire to consolidate vendors/tech stack | 11.4% | 10.8% | No, p=1.00 |
Buying-group size, purchase complexity, and Day 1 shortlist size differ reliably between completed and stalled evaluations, but the differences are modest. They may reflect some of the same underlying forces associated with experience and motivation rather than acting as independent explanations. Buyers who consider more vendors, for example, naturally tend to form somewhat larger groups and Day 1 shortlists.
The following are not meaningfully different in completed versus abandoned purchases: purchase cost; share of considered vendors that reach the Day 1 shortlist; triggers tied to M&A; internal stakeholder demand; and vendor consolidation.
No-decision journeys, then, are not simply larger or more expensive versions of successful ones. They begin with less category experience and more reactive motivations, while the differences in group size and shortlist formation may be downstream echoes of those conditions.
"No decision" usually means "not yet"
Most stalled evaluations are postponed rather than abandoned. Within 12 months, 77.9% of buyers expect to revisit the purchase; only 4.3% have firmly decided to walk away. When the evaluation restarts, most expect at least one boundary condition to change: budget (43%), use of external resources (41%), vendors considered (39%), stakeholders (31%), or requirements (29%). Only 5% expect to approach the decision the same way. Nor do these pauses usually indicate broad financial distress: 56% of organizations with a stalled evaluation report performing above expectations.
| When Buyers Expect Stalled Evaluations to Resume | Percent of Buyers With a Stalled Evaluation |
|---|---|
| Yes, within 6–12 months | 43.8% |
| Yes, within 6 months | 34.1% |
| The process is on hold indefinitely | 14.0% |
| No, we have decided not to pursue this | 4.3% |
| I'm not sure | 3.9% |
Why the purchase paused
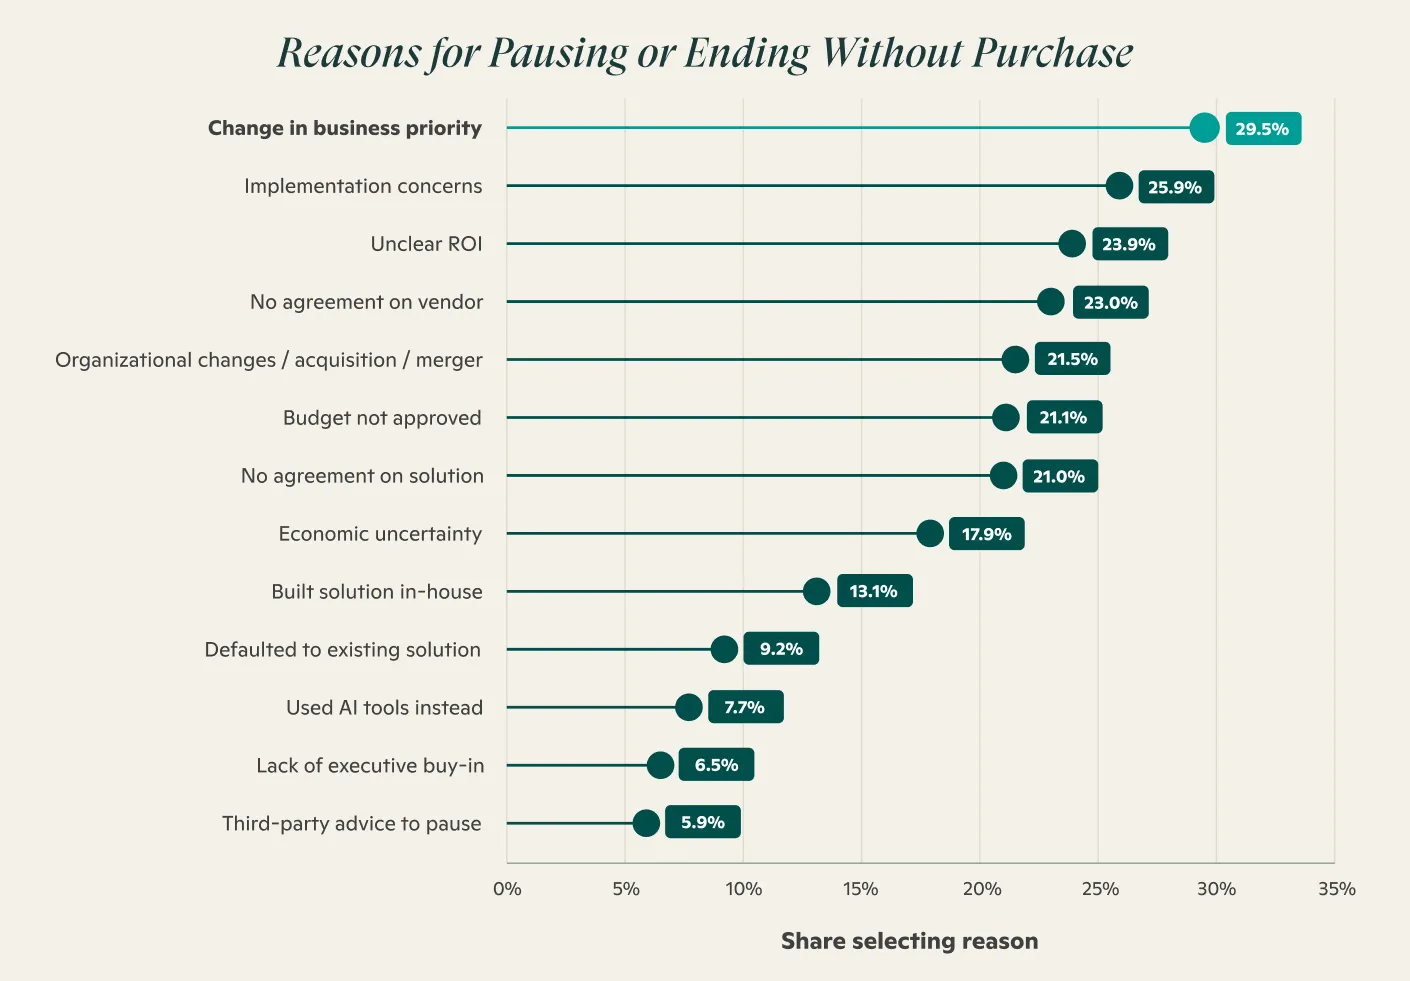
The most-cited reasons were changing business priorities (29%) and implementation concerns (26%), followed by a cluster of similarly sized factors: M&A activity (22%), difficulty reaching vendor consensus (23%), unclear ROI (24%), difficulty reaching solution consensus (21%), and budget approval (21%). Alternative paths were uncommon — just 13% built in-house and 8% chose an AI tool instead (of whom 56.4% said it fully met their needs). Stalled evaluations, in short, are driven more by internal organizational friction than by buyers finding another way to solve the problem.
When budget, vendor consensus, and incumbent status become barriers to purchase
Two of those barriers deserve closer attention because they originate primarily inside the buying organization. Among buyers who cited budget-approval challenges, 68.4% said the obstacle was a company-wide budget freeze rather than a decision specific to the purchase. Among buyers who struggled to reach vendor consensus, conflicting requirements within the buying group ranked first (41%), followed by concerns about vendor stability (34%) and the absence of a clear standout (34%); a poor sales process ranked last (13%).
Three of the four leading causes of vendor disagreement therefore reflect internal alignment problems rather than vendor execution. Even among the small share of groups that stayed with the existing solution (9.2%), the decision was usually practical: incumbent advantages (51%), switching costs (42%), integration concerns (42%), and compliance requirements (37%).
The role of LLMs in B2B buying
LLM adoption is high, but influence remains secondary
Most B2B buyers use LLMs somewhere in the journey, but use is not the same as influence. Adoption fell from 94% last year to 81% this year. The decline was more pronounced among individual contributors and lower-hierarchy roles and was larger in EMEA than in North America. One possibility is that organizations are restricting personal AI access before fully deploying approved corporate alternatives, although we cannot determine from these data whether that is the cause.
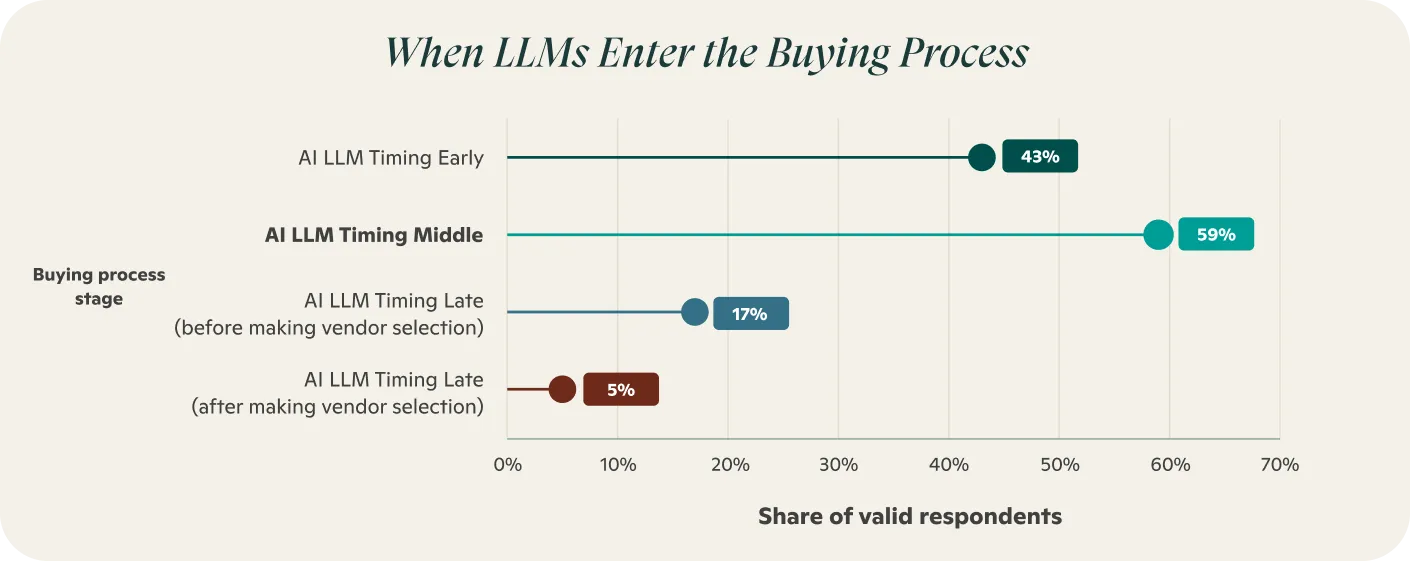
Among those who do use LLMs or AI Agents, usage is concentrated more in the middle of the journey than at the beginning. Only 26% of buyers use LLMs to find new vendors. Most use them to sort, summarize, and validate information they already have rather than to discover what they do not know. LLM discoverability therefore matters, but the evidence does not support the claim that buyers have offloaded solution search to chatbots or that LLMs have displaced established sources of influence.
LLM use is a tweak, not a revolution
A quarter of buyers (25.2%) said LLMs significantly influenced their perception of vendors, and nearly half said LLMs had some influence. That is enough to make LLM visibility worth managing. It is not enough to make LLMs the dominant influence on the journey, because buyers still rate traditional channels, accumulated knowledge, and internal discussion more highly. The practical conclusion is bounded: providers should manage how their solutions appear in LLMs without mistaking a meaningful new influence for the center of B2B buying.
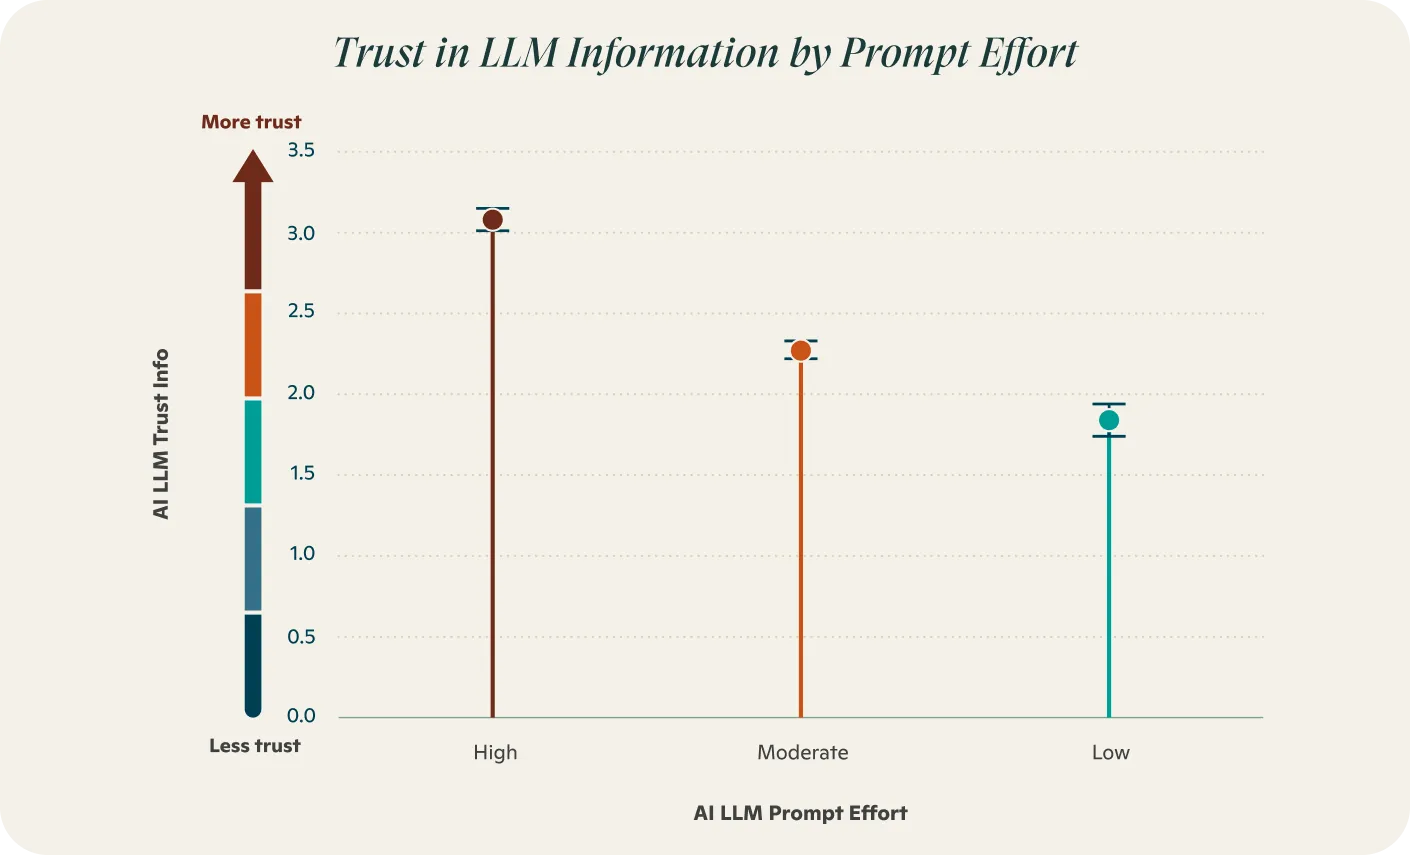
Our buyers reported substantial trust in LLMs: 51.8% reported a high level of trust, and another 36.5% reported a moderate level. Trust also shapes timing. Buyers with greater trust are more likely to use LLMs earlier in the journey, while buyers with less trust tend to use them in the middle. Two outside studies provide useful context but are not directly comparable: a University of Melbourne and KPMG study of 48,000 people across 47 countries found that 46% were willing to trust LLMs at all, including 41% in the United States, while a July 2025 YouGov study of 1,500 American AI users found that 5% completely trusted AI and 43% trusted it somewhat.
Prompting effort is strongly associated with trust and influence
Trust, in turn, is associated with effort. Nearly half of buyers (46.6%) rated their prompting effort as high, and prompting effort correlates strongly with trust in the output (r=.58) and with the influence buyers attribute to it (r=.47). The pattern raises an important question: are buyers using LLMs to research, or to confirm?
Economic uncertainty and AI expectations
AI and economic conditions both affect when buyers engage sellers
Separately, economic pressure and AI expectations appear to push in the same direction rather than against each other: buyers expecting significant AI capability were far more likely to say economic conditions accelerated their seller engagement (65%) than buyers expecting no AI at all (29%) — consistent with some buyers treating AI-enabled solutions as a response to uncertainty rather than waiting it out.
Regional Snapshot
Regional snapshot
The regional differences are real but bounded. North American buyers contact sellers later than buyers elsewhere, APAC buying groups are somewhat larger, and Continental European buyers consider slightly fewer vendors. Yet the decisive mechanics remain stable in every region: the winner is usually present on Day 1, buyers usually control first contact, and the pre-contact favorite usually wins. Regional adaptation should therefore refine the journey model, not replace it.
| Metric | APAC | Continental Europe | North America | UK & Ireland | Global |
|---|---|---|---|---|---|
| Buying cycle length (months) | 10.5 | 10.3 | 10.6 | 9.7 | 10.3 |
| % of cycle elapsed at first contact | 58% | 57% | 63% | 56% | 59% |
| Buying group size | 11.1 | 9.4 | 10.3 | 10.5 | 10.2 |
| Vendors considered, total | 5.3 | 4.6 | 4.9 | 4.9 | 4.9 |
| Vendors with prior experience | 3.8 | 3.2 | 3.5 | 3.3 | 3.4 |
| Day-1 shortlist size | 3.4 | 3.3 | 3.3 | 3.2 | 3.3 |
| Shortlist order set before first contact | 95% | 88% | 93% | 90% | 91.4% |
| Winner was on Day-1 shortlist | 91% | 92% | 91% | 92% | 91.7% |
| Buyer's org had prior experience with winner | 81% | 79% | 80% | 78% | 79% |
| Pre-contact favorite ultimately won | 79% | 84% | 84% | 77% | 81.5% |
| First contact initiated by buyer's team | 81% | 85% | 80% | 85% | 82.2% |
| Eventual winner was first vendor contacted | 77% | 79% | 79% | 68% | 76.6% |
| Prior category purchases, lifetime | 8.8 | 7.9 | 8.4 | 8.2 | 8.3 |
| Total interactions with eventual winner, all years | 30.2 | 28.0 | 32.1 | 30.2 | 30.5 |
| Vendor opinions changed at all between evaluations | 76% | 70% | 78% | 78% | 76% |
Keep Reading
Deep Dive Reports
The Category Familiarity Paradox: Familiar Categories Are Not Easier to Justify
Familiar categories are often harder to justify than vendors because buying groups must first agree that the category belongs in their organization.
B2B’s Biggest Revenue Blocker: What Separates Completed from Abandoned Purchase
Many B2B evaluations never result in a purchase, and the factors that separate completed purchases from abandoned ones are things every GTM team should understand.
AI Inside the Solutions B2B Buyers Evaluate & Economic Uncertainty
AI capabilities and economic uncertainty remain important forces in B2B buying, but their influence is increasingly concentrated among a distinct set of buyers.
The Death of Discovery: Why “Discovery” Is Not an Important Part of B2B Buying
Buyers usually know the categories and vendors they will consider long before an active evaluation begins.
The Never-ending Journey: What We Know About How B2B Buyers Stay Current Between Journeys
Active evaluations are heavily influenced by experiences and opinions buyers develop while they are out of market.
The B2B Buyers We Don’t Serve: Helping Buying Group Support Roles Get to “Yes”
Buying experiences differ between stakeholders purchasing for their own departments and those helping evaluate solutions for someone else's.
It’s Nobody’s First Rodeo: B2B Buying Groups Are Experienced and Opinionated
Even when organizations buy new capabilities for the first time, the people evaluating them are usually already familiar with the category.
Appendix
Methods
Research design
The 2026 B2B Buyer Experience Study was designed to examine how organizational buying journeys begin, progress, pause, and conclude. The research combined three surveys completed by B2B buyers and ancillary research. Together, these sources allowed us to examine completed purchases, evaluations that stalled or ended without a purchase, and buyer responses to AI capabilities and economic uncertainty.
The surveys were structured around a common conceptual model and shared core measures wherever possible. Those measures covered respondent role and seniority, purchase characteristics, category maturity, prior category experience, evaluation triggers, buying-group composition, vendors considered, Day 1 shortlists, requirements-setting, seller-contact timing, prior experience with vendors, external resources, AI use, and purchase outcome. Survey-specific questions were added where the research objective required greater depth.
The unit of analysis was the buying journey described by an individual respondent. Respondents reported on one recent evaluation rather than on their organization’s purchasing behavior in general. The results therefore represent informed participant accounts of specific buying processes.
View Full Methods
Survey instruments
Completed-purchase survey
The primary survey examined completed B2B purchases with an annual value of at least $25,000. Respondents were required to have participated in a qualifying purchase during the prior two years and were instructed to answer with reference to their most recent qualifying transaction.
The survey included participants in several formal buying roles: ultimate decision maker (44%), procurement or purchasing (20%), champion (14%), influencer (11%), and financial ratifier (11%). It covered software (30%), services (44%), and physical-goods purchases (27%) across respondents in North America (34%), continental Europe (28%), APAC (21%), and the UK and Ireland (18%). Respondents came from IT (38%), executive/board (17%), finance (11%), procurement (7%), and other functions. Respondents were senior: 34% were C-level, 11% VP/SVP/EVP, 21% directors, 28% managers, and 5% individual contributors. Purchases were most often $101K–$500K (41%), and 5% exceeded $1M.
We measured how long the purchase took and its total value, the maturity of the solution category, whether the capability was new to the organization, and the respondent’s experience evaluating similar solutions. We also asked how many vendors the team considered, how many of those vendors they knew before the buying cycle began, how many vendors they had on their “Day 1 shortlist”, and whether the team had worked with the eventual winner before. Further questions covered the size and makeup of the buying group, its use of outside resources such as analysts or consultants, and when buyers first engaged sellers. We also asked how well-defined the buyer’s requirements were at first contact with sellers, and how preferences and the final decision took shape over the course of the journey.
AI and economic-conditions survey
As in the 2025 study, a parallel survey examined the role of AI in the evaluated solution and the effects of economic conditions on buying behavior. Participating respondents were required to have been involved in a B2B purchase with an annual value of at least $25,000. Respondents were required to have participated in a qualifying purchase during the prior two years and were instructed to answer with reference to their most recent qualifying transaction.
The survey included participants in several formal buying roles: ultimate decision maker (46%), champion (19%), procurement or purchasing (13%), financial ratifier (12%), and influencer (10%). It covered software (24%), services (48%), and physical-goods purchases (28%) across respondents in North America (54%), the UK and Ireland (25%), and continental Europe (21%). Respondents came from IT (34%), executive/board (20%), finance (9%), operations (7%), HR/legal (6%), and other functions. Respondents were senior: 43% were C-level, 13% VP/SVP/EVP, 20% directors, 24% managers, and 1% individual contributors. Purchases were most often $100K or less (39%) or $101K–$500K (37%), and 4% exceeded $1M.
Questions addressed whether evaluated solutions included AI capabilities, the degree to which those capabilities were required or encouraged, the AI use cases buyers expected, and buyers’ confidence that they understood how providers were implementing AI. The survey also measured buyers’ use of LLMs and AI agents during evaluation, including use case, timing, trust, prompting effort, reliance relative to traditional search, and perceived influence on vendor impressions. Economic-condition questions asked whether uncertainty moved seller engagement earlier or later, shortened or lengthened the buying cycle, increased price sensitivity, or encouraged more conservative vendor choices.
These measures were analyzed independently and, where appropriate, in combination. For example, our analysis examined whether expectations for embedded AI were associated with the reported effect of economic uncertainty on seller-engagement timing. Such relationships are reported as associations and should not be read as causal effects.
Stalled or abandoned evaluation survey
New this year, a third survey examined evaluations that did not end in a purchase. Respondents were required to have participated in a B2B purchase evaluation with an annual value of at least $25,000 within the past year that ended without a purchase. The survey distinguished between evaluations that were paused, abandoned, or deferred indefinitely.
The survey captured many of the same journey variables used in the completed-purchase survey, permitting comparison between successful and unsuccessful evaluations. Additional questions covered why the evaluation stopped, whether and when the organization expected to revisit it, and which conditions were likely to change when the process resumed.
Respondents held the same formal buying roles as in the completed-purchase survey: ultimate decision maker (42%), champion (16%), procurement or purchasing (15%), influencer (15%), and financial ratifier (12%). They reported on evaluations for software (23%), services (52%), and physical goods (25%), and came from North America (50%), the UK and Ireland (28%), and continental Europe (22%). Respondents were senior: 40% were C-level, 8% VP/SVP/EVP, 22% directors, 29% managers, and 1% individual contributors. Most evaluations involved solutions between $25K and $500K (73%). Of the evaluations, 61% were stalled and 39% were abandoned without a purchase.
In total, our 2026 study assesses 3,596 completed-purchase journeys and 1,011 no-decision journeys. The number of respondents included in any given analysis varies because questions were presented only when relevant to the respondent's journey, and missing responses were excluded on a measure-by-measure basis.
Statistical analysis
Statistical analysis was conducted in JASP and Microsoft Excel. JASP was used for formal exploratory and confirmatory tests, including analysis of variance, contingency-table analysis, correlations, nonparametric comparisons, and related significance tests. Excel was used for data inspection, cleaning, derived-variable construction, pivot tables, cross-tabulation, descriptive summaries, robustness checks, and replication of key calculations.
Microsoft Copilot in Excel supported formula development, table construction, test selection, calculation checks, documentation of analysis steps, and execution of statistical analyses. Copilot-generated results used in the report were checked against the underlying data, independently recalculated or replicated where necessary, and reviewed for consistency with the relevant variable definitions, survey routing, and statistical assumptions.
Tests were selected according to the measurement structure, distributional properties, dependency structure, and comparison being made:
Differences in averages: Independent-sample comparisons or analysis of variance were used for continuous or approximately continuous measures such as cycle length, buying-group size, vendors considered, and point of first contact between buyers and sellers.
Differences in proportions: Chi-square tests, two-proportion tests, or exact tests were used for categorical outcomes such as purchase outcome (purchased or abandoned), shortlist ordering, trigger selection, AI-feature expectations, and buyer initiation of contact.
Paired multi-response measures: Cochran’s Q and McNemar tests were used where respondents could select multiple options, and comparisons were made across paired binary indicators.
Ordinal and non-normal measures: Rank-based tests and Spearman correlations were used where scale properties or distributions made parametric assumptions less appropriate.
Repeated binary outcomes: Respondent-clustered models were used in selected analyses involving multiple binary responses from the same participant.
Cross-year comparisons: Analyses were restricted to years and markets with comparable measures and usable data. Results were not projected into years for which the relevant questions were absent.
The conventional threshold of p < .05 was used to identify statistically reliable differences. Where a family of related comparisons created a material multiple-testing risk, Bonferroni or Holm adjustments were applied. Statistical significance was not treated as sufficient evidence of practical importance. The report emphasizes effect direction, magnitude, consistency, and theoretical relevance alongside p-values.
The analysis was primarily descriptive and associational. The surveys were not experiments, and causal claims are therefore avoided. A relationship between two measures may reflect omitted variables, selection effects, common causes, or differences in the kinds of purchases represented in each subgroup.
Cross-year analysis
Where question wording and response structures were sufficiently comparable, 2026 results were evaluated against earlier Buyer Experience studies. Variables were harmonized across years before comparison, and analyses were limited to the years in which a measure was actually fielded.
Cross-year results use available cases rather than a longitudinal panel; the respondents surveyed in one year were not necessarily the same individuals surveyed in another. Observed changes may therefore reflect both changes in buyer behavior and changes in sample composition. Market, solution-type, capability-type, role, and missing-data patterns were examined when interpreting apparent year-over-year movement.
When a measure could not be aligned defensibly across years, the report treats the 2026 result as a standalone finding rather than implying a trend.
Company-age analysis
The survey finding that buyers enter evaluations with substantial category and vendor experience raised a separate contextual question: are prominent vendors generally old enough to have been present throughout much of those buyers’ careers? The company-age analysis was designed as an external plausibility check on that interpretation.
We addressed that question through an independent company-age analysis covering three comparison groups: leading software vendors represented in G2 categories; large manufacturing companies; and large services companies.
Estimating the ages of software companies
For software, we analyzed G2 data acquired in May 2026. The source file contained 59,283 rows spanning 218 categories. Entries were grouped by G2 category and company name, and companies were ranked within each category by category-specific review count. Retaining the five companies with the largest review presence in each category produced 1,090 company–category observations. After company names were standardized and duplicate appearances across categories were removed, the dataset contained 444 distinct companies.
Copilot assisted with processing the G2 data, standardizing company names, calculating category-specific review totals, and producing the ranked company–category file. Founding years were established for 442 of the 444 distinct companies. Claude was then used as a secondary validation aid, with discrepancies reviewed against publicly available sources before company ages were finalized.
Distinct companies: 444. Known ages: 442. Age not established: 2. Mean age: 18.6 years. Median age: 15.0 years.
Note: We do not claim that all software companies would show this age distribution. And G2 reviews are not a reliable proxy for market share. A rank correlation analysis between company age and total reviews across the 442 companies is r = 0.137, a very weak correlation, which tells us that the most-reviewed companies are not simply the oldest. This is partly explained by G2’s age (beta launched 2012), so the accumulation window caps at about 13 years for everyone. A vendor founded in 1995 has had no more time to collect reviews than one founded in 2012.
What G2 review volume does tell us is closer to what interests us here: which companies are buyers looking at and using, and how old are they? G2 vendors with the most ratings are the vendors buyers most often encounter, evaluate and write about on the largest B2B software review site. That’s share of buyer attention, though not share of revenue. This analysis, therefore, gives us a good sense of the ages of the companies buyers most often encounter.
Estimating the ages of manufacturing and services companies
Measure: We estimated the share of the largest manufacturing and services companies that fall into four age bands: 0–5, 6–10, 11–15, and over 15 years. When a company grew out of a merger, a rebrand, or a state restructuring, we dated it from its earliest major predecessor. We applied the same rule to software vendors.
Reference population: No standard list of the world's largest manufacturers or services firms exists, so we used the 2025 Fortune Global 500 as the reference population. Fortune ranks companies by annual revenue and groups them into specific industries rather than broader sectors such as manufacturing or services. Rather than classifying all 500 companies individually, we assigned companies to manufacturing or services categories based on their Fortune industry classifications.
Prior evidence on age: Large companies tend to be long-established organizations. The average Fortune 500 company was approximately 80 years old in 2016, and relatively few Fortune 500 companies were founded after 2000. Even the youngest company to debut on the 2024 Fortune 500 list, DoorDash, was founded in 2013. The global list is similarly stable, with many companies appearing on the ranking for decades. Together, these findings suggest that the world's largest companies are overwhelmingly mature organizations rather than newly founded firms.
Estimation: To estimate the share of large companies founded after 2010, we identified firms that plausibly rank among the 500 largest organizations in their sector by revenue. For manufacturing, these included CATL, NIO, XPeng, Li Auto, and Leapmotor; for services, ByteDance, Didi, Kuaishou, DoorDash, Nubank, PDD Holdings, OpenAI, and Binance. We then grouped these firms into age bands and included a small allowance for additional young firms that may not have been identified. Based on this approach, we estimate that 98.6% of top manufacturers and 97.8% of top services firms are more than 15 years old. Median ages of 75 years for manufacturers and 65 years for services firms are judgment-based estimates anchored on prior evidence that the average Fortune 500 company was approximately 80 years old.
Verification: Founding years were based on publicly available information and were not independently verified against company filings. Among the firms identified, only PDD Holdings has confirmed Fortune Global 500 membership. Several others, including ByteDance, OpenAI, and Binance, are privately held and may not meet Fortune's reporting requirements. We included these companies in the estimate because doing so lowers the estimated age of the comparison groups and therefore results in a more conservative test of our conclusion.
Sensitivity: Doubling the number of young firms in each sector still leaves at least 95% of companies older than 15 years.
Limitations: The age distributions are estimates derived from a sample of likely candidates rather than a complete census of the 500 largest companies in each sector. Replacing them would require tabulating each sector's top 500 companies and identifying their founding years. Sector-specific top-500 lists also reach smaller companies than the Global 500 does. For scale, the 2025 U.S. Fortune 500 revenue threshold was $7.4 billion. Because smaller companies tend to be younger, our estimates may slightly understate the share of young firms. The Fortune age statistics are based on U.S. companies, and we assume the global population is at least as old. Company age was measured from the earliest predecessor organization, which increases the age of both the comparison groups and the software vendors.
Estimating company ages
Company age was calculated from founding year to the study year. Founding dates were gathered from public company histories, corporate websites, reference sources, and other publicly available records. AI-assisted research was used to accelerate source identification and preliminary date capture. Results were reviewed, obvious conflicts were investigated, and documented founding dates were preferred over dates associated with later incorporation, reorganization, merger, public listing, or rebranding.
Where a single unambiguous founding year could not be established, the best-supported estimate was used and treated as approximate. Company ages were then grouped into four bands: 0–5 years, 6–10 years, 11–15 years, and more than 15 years.
This analysis is a contextual cross-check, not a direct linkage between survey respondents and the vendors they evaluated. The G2 method also favors vendors with substantial review volume and should not be interpreted as representative of every software company. The manufacturing and services benchmarks emphasize large firms and therefore predictably skew older. The analysis supports a narrower conclusion: the prominent companies buyers are most likely to have experience with (enabling reviews) are overwhelmingly mature enough to have been present through much or all of a typical mid-career buyer’s working life.
Overall study interpretation and limitations
Several limitations should guide interpretation.
First, all survey measures are self-reported. Respondents may estimate dates, group sizes, vendor counts, influence, or sequence imperfectly. Recall error is especially relevant for long evaluations and for questions that ask respondents to reconstruct the state of the buying group at an earlier point.
Second, each respondent represents one participant’s view of a group process. Buying-group members may not share the same information or interpret the journey identically. Measures of group preference, consensus, and influence therefore reflect the respondent’s knowledge of the group rather than a census of every participant.
Third, subgroup bases vary. Small categories—particularly First-of-its-Kind solutions and narrowly defined regional, role, or solution-type groups—should be treated as directional even when their point estimates are shown.
Fourth, statistical reliability does not establish business importance, and lack of statistical reliability does not prove that two populations are identical. Results were interpreted using magnitude, consistency, sample size, prior-year evidence, and fit with the broader pattern of findings.
Finally, the surveys describe the buying journeys represented in their samples, while the company-age analysis describes separate benchmark populations assembled under different selection rules. Neither component establishes that every market, organization, solution category, transaction, or vendor population follows the same pattern. The recurring survey structure across years, regions, buying roles, and solution types supports the general Selection–Validation model, but local conditions still shape how that structure is expressed.