
Introduction
Research Methods
Findings
Summary of Findings
Endnotes
Introduction
From global positioning systems (GPS) that help us find our way in the world, to the systems that are used to verify close calls in professional sports, technologies that precisely locate objects in space are engineered to ingest multiple signals and combine them into a single set of coordinates. This allows such systems to identify their targets more accurately than any one of the signal inputs could on its own.
Likewise, leading B2B marketing organizations are using multiple signals to locate their next prospects. And despite the endemic threat of third-party cookie deprecation, there are more ways to identify in-market buyers today than ever before. B2B buyers conduct an increasing share of their solution research online, and tools such as traditional form-fill leads, product-review site intent, and de-anonymized web traffic provide more and more sources of buyer behavioral data. These signals enable providers to more readily detect in-market buyers and to develop an increasingly refined image of which buyers to prioritize.
This enhanced ability to detect buying behavior is driven by multiple factors:
- First, websites devoted to B2B topics have proliferated, providing potential buyers more digital resources for their research and giving providers more sources of digital behavioral data.
- Second, buyers are having more digital interactions during their buying journeys. Forrester found buyers in 2021 reported having 27 interactions with vendors during their buying journey, up from 21 in 2019. This stems from a trend for buyers to do more of their research digitally, a trend that was accelerated by the global pandemic.
- Third, buyers are teams and those teams may be growing in size, as more specialized buying team roles have proliferated. The data here is not entirely clear. However, data from B2B research firm SiriusDecisions going back to 2015 held that buying teams for large purchases tended to be six to 10 members in size, with larger buying groups representing more expensive, complex solution purchases. (See this Forrester blog post for that discussion.) More recent data from other sources, including our own research, suggests buying teams are much larger, with averages ranging from six to 19 or more depending on the source of the estimate (see Report, 6sense Buying Groups Report).
What is not clear is whether earlier methods of identifying buying group size were faulty, or whether the teams themselves are increasing in size. Either way, today’s buying groups are understood to be 9 or more individuals for most B2B purposes, and more than double that number for larger purchases (over $250,000). While it may be possible for any given individual’s researching behavior to fly under the B2B radar, more buying group members means a greater likelihood of detecting a buying group.
- Finally, all of these buying signals become useful only when they are captured and separated from the digital noise. Here, ongoing advances in the availability and application of artificial intelligence are enabling dramatically more effective buyer identification and prioritization.
Taken together, these factors suggest B2B providers that take advantage of the abundance of buying signals will be able to create a more accurate, high-definition image of the buying teams they target. In turn, this high-res buyer image allows providers to:
- Narrow their focus on buying teams that are truly in-market
- Concentrate resource expenditure on that smaller set of high propensity targets, and
- Shape and deliver more effective marketing and sales tactics tailored for this more refined audience
Research Methods
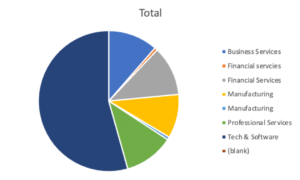
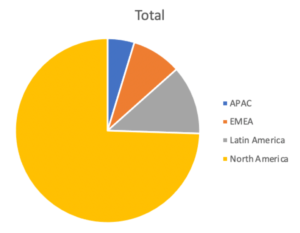
To understand the extent to which B2B revenue teams are capitalizing on these emerging capabilities to identify in-market buying teams, we surveyed 169 marketers from senior leadership, demand generation, ABM, and both marketing and revenue operations functions. Survey respondents came from a variety of industries (Chart 1) and geographies (Chart 2), but the majority of respondents were sourced from technology and software companies with North American headquarters1. Survey respondents were asked a variety of questions concerning their acquisition, use, and preference for a variety of available buying signals (see Table 1 for a list of the signal types presented to survey participants).
Findings
Buying Teams, Average Selling Price, and Signals
The first question we wanted to answer was: Do providers with more costly solutions that involve larger buying teams use more signals?
Before testing the relationship between buying team size and signals, we validated that buying team size for a given solution is driven, at least in part, by that solution’s average selling price (ASP). Indeed, a correlation analysis found a robust relationship2. As the cost of a solution goes up, more people tend to get involved on the buyer side, increasing the chance that provider organizations will be able to identify the research behavior of those buying teams.
Buying Group Size and Signals
To take advantage of the signals emitted by buying teams, marketing organizations should acquire a suite of buying signal types that will reveal when teams are in-market. To assess whether this is happening, we conducted a correlation analysis to determine whether there is a relationship between reported buying group size and two indicators that organizations are trying to take advantage of available buying signals:
- Using a wide variety of signal types, or
- Spending more on signal acquisition
Contrary to expectation, we found a small negative relationship between buying group size and the variety of signals used3, such that respondents in our survey who reported larger buying groups also tended to report using a slightly less diverse suite of buying signals.
Next, we tested whether providers with bigger buying groups might be concentrating their signal acquisition strategy in a relatively small number of signal types, thus increasing spend on signals without increasing the variety of signal types acquired. Here, our analysis found no relationship between size of buying group and spend on signals4, suggesting that not only are organizations with larger buying groups using fewer types of signals, they are not concentrating their spend on a smaller set of signals.
Average Selling Price (ASP) and Signals
While buying group size does not appear to drive either the variety or volume of signal acquisition, perhaps ASP would. When organizations have the opportunity to close bigger deals, perhaps that drives the use of a wider variety or simply a greater volume of signal acquisition, since one would expect there be a bigger trail of online research for more costly/higher stakes purchases. We again tested these relationships using correlation analysis. However, our findings indicate that higher ASP providers do not use a greater variety of signal types5, nor was ASP related to an organization’s spend to acquire signals6. The availability of large deal sizes does not appear to drive organizations to acquire more or a greater variety of buying signals.
What Influences Signal Acquisition Variety and Spend?
While none of the expected factors appear to influence whether organizations acquire a broad array of buying signals, or simply spend more to acquire signals, there may still be other factors that influence how organizations approach the acquisition of buying signals.
To better understand this, we examined characteristics of organizations we surveyed. Perhaps the most likely company characteristic to influence signal utilization and spend is the size of an organization. Larger companies with bigger budgets might be expected to use and spend more on signals.
In our survey, participants reported their company’s revenue in 23 increments from $110,000 to $200,000 to $23 billion). To test if utilization and spend on signals increased with company revenue, we conducted a correlation analysis. It found that, indeed, larger companies tend to spend more on signals7. Larger companies also use a wider variety of signals8.
To understand what might be driving this, we tested whether larger organizations reported that they sold to larger buying groups.
Conventional wisdom suggests that technology and software companies tend to be early adopters of new technologies. Perhaps this would extend to the use of signals? In our survey, we found exactly that. Comparing tech and software company survey takers to others, we found that Tech and Software companies report using an average of 7.3 signals from our list of 18, compared to 3.4 for all other responders. We did not find differences in reported spend on signals between tech vs. non-tech companies, however. It appears, therefore, that tech companies tend to spend an equivalent amount as non-tech companies to acquire buying signals, but they spread that spend among more signal types.
Summary of Findings
B2B providers can tap into a variety of buying signals in order to develop insights into the marketplace and paint a comprehensive picture of their customers. We surveyed 169 individuals from B2B provider organizations to understand:
- How providers are using these buying signals
- The factors that influence adoption
- Gaps in adoption that may be holding back performance
We used correlation coefficients to analyze survey results.
Some surprises:
- The size of buying groups does not seem to influence the number of buying signals being tracked by B2B providers.
- Higher average sales prices do not correlate with higher spending on buying signals or the use of more diverse buying signals.
- Tech companies do not spend more on signal acquisition. Instead, they diversify their sources — spreading their budgets across more types of data signals.
- The two biggest factors that indicate a company will use diverse buying signals are whether the company is in tech and whether the company has a large budget.
- Other companies — other than the biggest — tend to spend on a narrower set of signals, doubling down on those they already use rather than diversifying.
Implication:
Companies that utilize fewer buying signals are missing opportunities to identify buyers and understand their market. Companies that sell to larger buying groups have an advantage in their ability to identify those buying journeys. But, to realize that advantage, organizations have to acquire the relevant buying signals.
Implications
B2B organizations primarily sell to teams of individuals, ranging from a handful for the least expensive purchases to more than 20 for solutions with larger average selling prices9. While the requirement to satisfy the information needs of an entire team, rather than just a target individual, adds considerable complexity to the job of marketing and selling to B2B organizations, it also presents a substantial opportunity. As large buying groups research solutions, they leave a greater body of evidence behind in the form of digital buying signals than do individuals. This gives B2B organizations a much greater opportunity to identify in-market prospects. While it may be possible for a one or two-person buying team to escape notice as they research solutions, the likelihood of a 10- or 15-person team flying completely under the radar is greatly diminished.
But this is only true if organizations that sell to larger buying teams acquire and use the available buying signals. Our research suggests that organizations are not currently taking advantage of the available signals and thereby are failing to capitalize on the natural advantage that B2B organizations, particularly those that sell high ASP solutions, have. In our research, we considered whether organizations were either accessing a wider variety of signal types or were simply spending more to acquire signals in accordance with the size of their buying teams. Neither appears to be the case. Instead, it is the rich, in terms of annual revenue, and technology and software companies, that are helping to make themselves richer by taking greater advantage of available signals.
For others, the availability of signals provides an opportunity to improve revenue generation productivity.
Which industries participated in the survey?
Which global regions participated in the survey?
Appendix
| Signal Type | Description |
| Ad Clicks | Person clicks on a digital ad |
| Form Fill Leads | Web visitor fills out any web form, including chat sessions, unless specifically listed here |
| Email Clicks/Opens | Email recipient opens and/or clicks in the email |
| Marketing Qualified Leads (scored form fill leads, MQLs) | A form-fill lead that has been scored and achieved threshold for passing to sellers |
| Demo Requests/Downloads | A web visitor completes a form to request a demo or to download a demo |
| Live Event Registrations | A web visitor completes a form to register for a live event |
| Social Leads | A prospect expresses interest through social media activity |
| “Contact me” requests | A web visitor completes a form to request to be contacted |
| Partner Referrals | A partner organization refers a potential buyer |
| Virtual Event Registrations | A web visitor completes a form to register for a virtual event |
| Syndicated Content Leads | Form-fill leads received from sites that host relevant gated content |
| Anonymous Traffic, De-anonymized | Web visitors whose account of origin have been determined |
| 3rd Party Intent | Signals of buyer research activity acquired through linking keyword usage and digital content consumption across the internet |
| Freemium Downloads | A web visitor completes a form to download a restricted version of a solution |
| Product Review Site leads | Form-fill leads acquired from websites that host product reviews |
| Demo Usage | Evidence of product usage from users of a demo version of a product |
| Product Review Site Intent | Aggregated consumption of product review site content, associated to prospect accounts |
| Freemium Use | Evidence of product usage from users of a free, restricted version of a product |
Source: 6sense
Endnotes
1. See discussion in Buying Signals Survey Report of how this sampling bias likely influences outcomes reported here.
2. Pearson product-moment correlation coefficient (PPMCC): r = .41, p < .001
4. PPMCC: r = .14, p= .11, non-significant
5. PPMCC: r = .190, p = .173, non-significant
6. PPMCC: r = .172, p = .233, non-significant
9. See Clari blog: https://www.clari.com/blog/relationship-insights/